

 |
市場調查報告書
商品編碼
2071238
LNG液化廠市場商機、成長要素、產業趨勢分析及2026-2035年預測。LNG Liquefaction Train Market Opportunity, Growth Drivers, Industry Trend Analysis, and Forecast 2026 - 2035 |
||||||
全球液化天然氣液化裝置市場預計到 2025 年將達到 135 億美元,並以 7.1% 的複合年成長率成長,到 2035 年將達到 274 億美元。
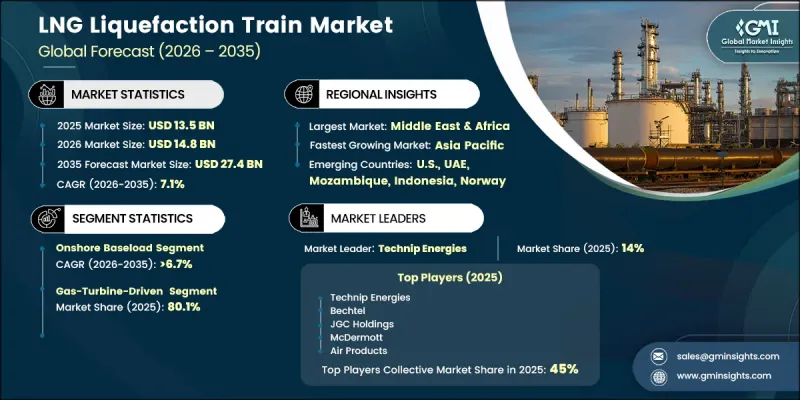
這一成長趨勢得益於重點地區液化天然氣出口基礎設施投資的增加,以及能源籌資策略多元化政策的廣泛轉變。液化天然氣(LNG)作為「過渡燃料」的需求不斷成長,尤其是在那些正在擺脫煤炭能源系統、減少對傳統管道天然氣網路依賴的地區。此外,再氣化能力的持續擴張和長期供應合約的簽訂,提高了上游專案的可行性。技術進步也發揮著至關重要的作用,液化製程的改進提高了營運效率和環境績效。模組化系統、電氣化工廠設計以及數位化最佳化工具的引入,在提高工廠可靠性和全生命週期經濟性的同時也增加了資本密集度,使市場走上了永續長期成長的道路。
| 市場範圍 | |
|---|---|
| 開始年份 | 2025 |
| 預測期 | 2026-2035 |
| 上市時的市場規模 | 135億美元 |
| 預計金額 | 274億美元 |
| 複合年成長率 | 7.1% |
隨著對能夠提高效率和減少排放的先進系統配置的需求不斷成長,液化天然氣(LNG)液化工廠行業正在不斷發展。國際貿易量的穩定成長支撐著全球LNG需求的擴張,越來越多的國家投資建設液化氣進口和加工基礎設施。人們對能源供應穩定性和中斷的日益關注,進一步凸顯了LNG在國家能源戰略中的重要性。同時,核心液化技術的創新正在提高工廠生產率,延長維護週期,並最大限度地減少意外停機時間。
預計到2025年,陸上基本負載系統市佔率將達到55.9%,並在2035年之前以6.7%的複合年成長率成長。該細分市場持續保持主導地位的原因在於其能夠兼顧高產能和高營運效率。這些大規模配置之所以被廣泛採用,是因為它們比分散式或小規模模組化系統更具擴充性,且結構相對簡單,因此非常適合滿足大容量液化需求。
預計到2025年,燃氣渦輪機系統市佔率將達到80.1%,並憑藉其強大的全球影響力及運轉可靠性,持續保持主導地位。這些系統仍然是開發商的首選,尤其是在電力基礎設施不穩定或替代能源方案經濟效益不佳的地區。其適應性和久經考驗的性能使其在大型液化項目中得到廣泛應用。
預計到2025年,北美液化天然氣(LNG)市場將佔據34.1%的市場佔有率,並在2035年之前以6.1%的複合年成長率成長。該地區的領先地位得益於其完善的出口體系和持續的產能擴張。不斷成長的專案活動,以及有利的法規環境和投資環境,進一步鞏固了其作為LNG生產和出口基礎設施建設重要樞紐的地位。
目錄
第1章:調查方法和範圍
第2章執行摘要
第3章 行業洞察
- 產業生態系分析
- 原物料供應及採購分析
- 生產能力評估
- 供應鏈韌性與風險因素
- 配電網路分析
- 監理情勢
- 影響產業的因素
- 促進因素
- 產業潛在風險與挑戰
- 成長潛力分析
- 波特的分析
- PESTLE分析
- 人工智慧和生成式人工智慧對市場的影響
- 利用人工智慧改造現有經營模式
- 生成式人工智慧的應用案例與實施藍圖
- 風險、限制和監管考量
- 投資分析及未來展望
- 永續發展措施與工業4.0的融合
- 未來展望與機遇
- 新興市場的商業機會
- 利用浮式液化天然氣(FLNG)實現未使用天然氣的商業化
- 亞洲煤炭向天然氣的轉型
- 偏遠地區的小規模液化天然氣
- 技術演進與藍圖
- 全電動液化裝置
- 綜合碳捕獲
- 氫氣聯產設施
- 有興趣的投資領域
- 顛覆性趨勢與不確定性
- 新興市場的商業機會
第4章 競爭情勢
- 介紹
- 企業市佔率分析:按地區分類
- 北美洲
- 歐洲
- 亞太地區
- 中東和非洲
- 拉丁美洲
- 主要進展
- 重要合作夥伴關係和合作
- 併購主要趨勢
- 產品創新和新產品發布
- 市場擴大策略
- 競爭定位矩陣
- 排名分類標準與遴選標準
- 按銷售額、地區和創新能力分類的層級定位矩陣。
第5章 市場規模及預測:依植物類型分類,2022-2035年
- 陸基基本負載
- 模組化和中型陸上工廠
- FLNG
第6章 市場規模及預測:按驅動和電源架構分類,2022-2035年
- 燃氣渦輪機驅動型
- 電動馬達驅動型
- 混合動力和雙驅動
第7章 市場規模及預測:依產能分類,2022-2035年
- 小規模
- 中號
- 大規模
第8章 市場規模及預測:依開發商分類,2022-2035年
- NOC
- IOC
- 獨立開發者
第9章 市場規模及預測:依地區分類,2022-2035年
- 北美洲
- 美國
- 加拿大
- 墨西哥
- 歐洲
- 挪威
- 英國
- 荷蘭
- 俄羅斯
- 亞太地區
- 中國
- 澳洲
- 馬來西亞
- 巴布亞紐幾內亞
- 中東和非洲
- 卡達
- UAE
- 阿曼
- 奈及利亞
- 莫三比克
- 拉丁美洲
- 巴西
- 阿根廷
第10章:公司簡介
- Air Products
- Baker Hughes
- Bechtel
- Black &Veatch
- Chiyoda Corporation
- CTCI Corporation
- ConocoPhillips
- Fluor
- GE Vernova
- Honeywell
- JGC Corporation
- Linde
- Technip Energies
- McDermott
- MODEC
- Saipem
- Siemens Energy
- Samsung Heavy Industries(SHI)
- Wartsila
- Worley
The Global LNG Liquefaction Train Market was valued at USD 13.5 billion in 2025 and is estimated to grow at a CAGR of 7.1% to reach USD 27.4 billion by 2035.
The upward movement is supported by rising investments in LNG export infrastructure across key regions, alongside a broader policy shift toward diversified energy sourcing strategies. Expanding demand for liquefied natural gas is being driven by its role as a transitional fuel, particularly in regions moving away from coal-based energy systems and reducing reliance on conventional pipeline gas networks. Additionally, continuous expansion in regasification capacity and long-term supply agreements are strengthening upstream project viability. Technological progress is also playing a central role, with advancements in liquefaction processes enhancing operational efficiency and environmental performance. The integration of modular systems, electrified train designs, and digital optimization tools is enabling higher capital intensity while improving plant reliability and lifecycle economics, positioning the market for sustained long-term growth.
| Market Scope | |
|---|---|
| Start Year | 2025 |
| Forecast Year | 2026-2035 |
| Start Value | $13.5 Billion |
| Forecast Value | $27.4 Billion |
| CAGR | 7.1% |
The LNG liquefaction train industry is evolving with increasing preference for advanced system configurations that enhance efficiency and reduce emissions. Strengthened global demand for LNG is being supported by consistent growth in international trade volumes, as more countries invest in infrastructure to import and process liquefied gas. Rising concerns over energy reliability and supply disruption have further reinforced the importance of LNG within national energy strategies. At the same time, innovation across core liquefaction technologies is improving plant output, extending maintenance cycles, and minimizing unexpected operational interruptions.
The onshore baseload systems segment accounted for 55.9% share in 2025 and is projected to grow at a CAGR of 6.7% through 2035. Their continued dominance is attributed to their ability to deliver high production capacity with operational efficiency. These large-scale configurations are widely adopted due to their scalability and relatively lower complexity when compared to distributed or smaller modular systems, making them suitable for high-volume liquefaction requirements.
The gas turbine-based systems segment held 80.1% share in 2025, maintaining their leadership due to their established global presence and operational reliability. These systems remain a preferred choice for developers, particularly in environments where access to stable electricity infrastructure is limited or where alternative power solutions are not economically feasible. Their adaptability and proven performance continue to support widespread deployment across major liquefaction projects.
North America LNG Liquefaction Train Market represented 34.1% share in 2025 and is anticipated to grow at a CAGR of 6.1% through 2035. The region's prominence is supported by a well-developed export ecosystem and ongoing capacity expansion initiatives. Increasing project activity, coupled with favorable regulatory and investment environments, continues to reinforce its position as a leading hub for LNG production and export infrastructure development.
Key companies operating in the LNG Liquefaction Train Market include Technip Energies, Bechtel, Saipem, JGC Corporation, McDermott International, Samsung Heavy Industries, Linde, Air Products, Siemens Energy, Baker Hughes, GE Vernova, Wartsila, and Honeywell. Market participants are strengthening their competitive positioning through strategic investments in technology development, project execution capabilities, and global expansion. Companies are focusing on enhancing process efficiency and reducing emissions through continuous innovation in liquefaction systems. Partnerships and long-term agreements across the value chain are helping secure project pipelines and stabilize revenue streams. Firms are also prioritizing modular construction approaches and digital integration to improve project timelines and operational performance. Expanding regional presence and aligning with evolving regulatory frameworks are additional strategies being adopted to capture emerging opportunities and reinforce market leadership in the LNG liquefaction train industry.
Table of Contents
Chapter 1 Methodology & Scope
- 1.1 Research approach
- 1.2 Quality commitments
- 1.2.1 GMI AI policy & data integrity commitment
- 1.2.1.1 Source consistency protocol
- 1.2.1 GMI AI policy & data integrity commitment
- 1.3 Research trail & confidence scoring
- 1.3.1 Research trail components
- 1.3.2 Scoring components
- 1.4 Data collection
- 1.4.1 Partial list of primary sources
- 1.5 Data mining sources
- 1.5.1 Paid sources
- 1.5.1.1 Sources, by region
- 1.5.1 Paid sources
- 1.6 Base estimates and calculations
- 1.6.1 Base year calculation for any one approach
- 1.7 Market estimates & forecasts parameters
- 1.8 Forecast model
- 1.8.1 Quantified market impact analysis
- 1.8.1.1 Mathematical impact of growth parameters on forecast
- 1.8.1 Quantified market impact analysis
- 1.9 Research transparency addendum
- 1.9.1 Source attribution framework
- 1.9.2 Quality assurance metrics
- 1.9.3 Our commitment to trust
- 1.10 Market definitions
Chapter 2 Executive Summary
- 2.1 Industry synopsis, 2022 - 2035
- 2.1.1 Business trends
- 2.1.2 Plant type trends
- 2.1.3 Drive & power architecture trends
- 2.1.4 Capacity trends
- 2.1.5 Developer trends
- 2.1.6 Regional trends
Chapter 3 Industry Insights
- 3.1 Industry ecosystem analysis
- 3.1.1 Raw material availability & sourcing analysis
- 3.1.2 Manufacturing capacity assessment
- 3.1.3 Supply chain resilience & risk factors
- 3.1.4 Distribution network analysis
- 3.2 Regulatory landscape
- 3.3 Industry impact forces
- 3.3.1 Growth drivers
- 3.3.2 Industry pitfalls & challenges
- 3.4 Growth potential analysis
- 3.5 Porter's analysis
- 3.5.1 Bargaining power of suppliers
- 3.5.2 Bargaining power of buyers
- 3.5.3 Threat of new entrants
- 3.5.4 Threat of substitutes
- 3.6 PESTEL analysis
- 3.6.1 Political factors
- 3.6.2 Economic factors
- 3.6.3 Social factors
- 3.6.4 Technological factors
- 3.6.5 Legal factors
- 3.6.6 Environmental factors
- 3.7 Impact of AI & Generative AI on the market
- 3.7.1 AI-Driven disruption of existing business models
- 3.7.2 GenAI use cases & adoption roadmap
- 3.7.3 Risks, limitations & regulatory considerations
- 3.8 Investment analysis & future prospects
- 3.9 Sustainability initiatives & industry 4.0 integration
- 3.10 Future outlook & opportunities
- 3.10.1 Emerging market opportunities
- 3.10.1.1 Stranded gas monetization via flng
- 3.10.1.2 Coal-to-gas switching in asia
- 3.10.1.3 Small-scale lng for remote applications
- 3.10.2 Technology evolution & roadmap
- 3.10.2.1 All-electric liquefaction trains
- 3.10.2.2 Carbon capture integration
- 3.10.2.3 Hydrogen co-production facilities
- 3.10.3 Investment hotspots
- 3.10.4 Disruptive trends & wild cards
- 3.10.1 Emerging market opportunities
Chapter 4 Competitive Landscape, 2026
- 4.1 Introduction
- 4.2 Company market share analysis, by region, 2025
- 4.2.1 North America
- 4.2.2 Europe
- 4.2.3 Asia Pacific
- 4.2.4 Middle East & Africa
- 4.2.5 Latin America
- 4.3 Key developments
- 4.3.1 Key partnerships & collaborations
- 4.3.2 Major M&A activities
- 4.3.3 Product innovations & launches
- 4.3.4 Market expansion strategies
- 4.4 Competitive positioning matrix
- 4.4.1 Tier classification criteria & qualifying thresholds
- 4.4.2 Tier positioning matrix by revenue, geography & innovation
Chapter 5 Market Size and Forecast, By Plant type, 2022 - 2035 (USD Million)
- 5.1 Key trends
- 5.2 Onshore baseload
- 5.3 Modular & mid-scale onshore
- 5.4 FLNG
Chapter 6 Market Size and Forecast, By Drive & Power Architecture, 2022 - 2035 (USD Million)
- 6.1 Key trends
- 6.2 Gas turbine driven
- 6.3 Electric motor driven
- 6.4 Hybrid & dual driven
Chapter 7 Market Size and Forecast, By Capacity, 2022 - 2035 (USD Million)
- 7.1 Key trends
- 7.2 Small scale
- 7.3 Mid scale
- 7.4 Large scale
Chapter 8 Market Size and Forecast, By Developer, 2022 - 2035 (USD Million)
- 8.1 Key trends
- 8.2 NOC
- 8.3 IOC
- 8.4 Independent developer
Chapter 9 Market Size and Forecast, By Region, 2022 - 2035 (USD Million)
- 9.1 Key trends
- 9.2 North America
- 9.2.1 U.S.
- 9.2.2 Canada
- 9.2.3 Mexico
- 9.3 Europe
- 9.3.1 Norway
- 9.3.2 UK
- 9.3.3 Netherlands
- 9.3.4 Russia
- 9.4 Asia Pacific
- 9.4.1 China
- 9.4.2 Australia
- 9.4.3 Malaysia
- 9.4.4 Papua New Guinea
- 9.5 Middle East & Africa
- 9.5.1 Qatar
- 9.5.2 UAE
- 9.5.3 Oman
- 9.5.4 Nigeria
- 9.5.5 Mozambique
- 9.6 Latin America
- 9.6.1 Brazil
- 9.6.2 Argentina
Chapter 10 Company Profiles
- 10.1 Air Products
- 10.2 Baker Hughes
- 10.3 Bechtel
- 10.4 Black & Veatch
- 10.5 Chiyoda Corporation
- 10.6 CTCI Corporation
- 10.7 ConocoPhillips
- 10.8 Fluor
- 10.9 GE Vernova
- 10.10 Honeywell
- 10.11 JGC Corporation
- 10.12 Linde
- 10.13 Technip Energies
- 10.14 McDermott
- 10.15 MODEC
- 10.16 Saipem
- 10.17 Siemens Energy
- 10.18 Samsung Heavy Industries (SHI)
- 10.19 Wartsila
- 10.20 Worley
 全球小規模液化天然氣產能與資本投資展望:至2030年
 微電網時代已經來臨嗎?
 全球液化天然氣(LNG)液化設備市場規模、佔有率、趨勢和成長分析報告(2026-2034年)
 全球LNG液化設備市場
 全球小型液化天然氣液化技術與服務市場、機會與策略(至2034年)