

 |
市場調查報告書
商品編碼
2071232
從 2026 年到 2035 年,自動稱重檢測和排放系統的市場機會、成長要素、行業趨勢分析和預測。Automated Weight Checking and Reject Systems Market Opportunity, Growth Drivers, Industry Trend Analysis, and Forecast 2026 - 2035 |
||||||

預計到 2025 年,全球自動稱重和排放系統市場價值將達到 17 億美元,並預計以 5.7% 的複合年成長率成長,到 2035 年達到 30 億美元。
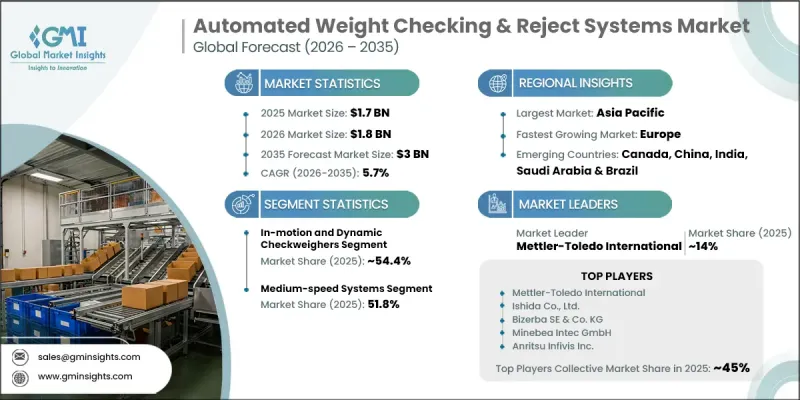
在檢驗,以及全球全自動包裝線的轉型,進一步加速了高精度稱重系統的應用。製造商也面臨著最大限度減少因過度填充造成的損失的壓力,這促使他們投資於高精度稱重系統。隨著生產環境的數位化程度不斷提高,自動檢重設備正在發展成為工業4.0生態系統中的智慧資料節點。法律規範持續支持這一趨勢,並制定了系統性的合規要求,明確了包裝產品的重量和測量精度。在美國,商業稱重系統由各州執行的國家標準進行監管,而歐洲法規則要求嚴格遵守與標稱重量的統計一致性。除了這些監管壓力之外,日常消費品(FMCG) 和製藥製造業的自動化進步預計將推動全球產業部門的持續長期市場擴張。
| 市場範圍 | |
|---|---|
| 開始年份 | 2025 |
| 預測期 | 2026-2035 |
| 上市時的市場規模 | 17億美元 |
| 預測金額 | 30億美元 |
| 複合年成長率 | 5.7% |
預計到2025年,動態稱重市場規模將達到9.253億美元,市佔率將達到54.4%。這一主導地位得益於動態稱重技術在連續生產環境中的廣泛應用,在這些環境中,產品稱重必須在不中斷生產線速度的情況下進行。大批量包裝流程的強勁需求進一步凸顯了動態稱重系統作為現代自動化生產線核心組件的重要性。
中速系統市佔率佔比達51.8%,預計到2035年將以5.9%的複合年成長率成長。此細分市場的優勢在於能夠滿足包括包裝食品、飲料和消費品在內的眾多行業標準生產線的吞吐量需求。中速配置在精度和運行效率之間實現了最佳平衡,使其廣泛適用於需要穩定生產流程的各種製造環境。
預計到2025年,北美自動化稱重檢測和排放系統市場規模將達到4.543億美元,並在2035年之前以5.9%的複合年成長率成長。其中,美國佔最大市場佔有率,約3.79億美元,約佔全部區域銷售額的84%。食品、飲料和製藥業強大的製造業基礎,以及物流和履約營運自動化技術的進步,都支持了市場成長。監管合規要求和標準化測量框架持續推動已部署系統的定期升級,從而保證了整體工業應用領域對升級版高精度檢重技術的持續需求。
目錄
第1章:調查方法和範圍
第2章執行摘要
第3章 行業洞察
- 產業生態系分析
- 供應商情況
- 利潤率
- 每個階段增加的價值
- 影響價值鏈的因素
- 影響產業的因素
- 促進因素
- 主要市場對淨含量有嚴格的規定,並要求符合法律規定的計量標準。
- 快速消費品、製藥和物流行業的包裝生產線迅速採用自動化技術。
- 人們越來越意識到免費提供產品和過度填充造成的損失所帶來的成本意識。
- 微型倉配和電子商務物流的激增對重量檢驗提出了極高的要求。
- 產業潛在風險與挑戰
- 控制高速生產過程中的校準漂移和測量不確定性。
- 工廠環境中振動與環境因素對稱重精度的影響
- 由於各地區的監管和認證要求不同,合規成本不斷增加。
- 手動操作和操作員行為會損害消除系統的完整性。
- 機會
- 透過人工智慧和工業物聯網的整合,實現校準漂移的預測檢測和自主閾值管理。
- 整合測試系統的普及
- 開發亞太和拉丁美洲食品加工領域尚未開發的市場。
- 藥品包裝生產線對可追溯性和序列化整合的需求日益成長。
- 促進因素
- 成長潛力分析
- 未來市場趨勢
- 技術與創新展望
- 最新科技趨勢
- 新興技術
- 監理情勢
- 標準和合規要求
- 區域監理框架
- 認證標準
- 貿易數據分析
- 進出口量及進口額趨勢
- 主要貿易路線及關稅的影響
- 價格分析
- 對過去價格趨勢的分析
- 按業務類型(高階/低階/大眾市場)分類的定價策略
- 人工智慧和生成式人工智慧對市場的影響
- 利用人工智慧改造現有經營模式
- 按細分市場分類的生成式人工智慧用例和部署藍圖
- 風險、限制和監管考量
- 波特的分析
- PESTLE分析
第4章 競爭情勢
- 介紹
- 企業市佔率分析
- 按地區
- 北美洲
- 歐洲
- 亞太地區
- 拉丁美洲
- 中東和非洲
- 按地區
- 企業矩陣分析
- 主要市場公司的競爭分析
- 競爭定位矩陣
- 主要進展
- 併購
- 夥伴關係和聯盟
- 新產品發布
- 業務拓展計劃
第5章 市場估計與預測:依系統類型分類,2022-2035年
- InMotion/動態格紋
- 間歇性/靜態檢查磨損
- 整合檢測系統
第6章 市場估算與預測:依排放機制分類,2022-2035年
- 噴射
- 推桿/槳式
- 翻蓋式/活板門式
- 分流器/導流板類型
- 雙排放系統
第7章 市場估計與預測:依速度分類,2022-2035年
- 高速(超過300台/分鐘)
- 中速(50-300 單位/分鐘)
- 低速(50 單位/分鐘或更低)
第8章 市場估算與預測:依測量技術分類,2022-2035年
- 應變式荷重元
- 電磁力恢復(EMFR)
- 混合/先進感測器系統
第9章 市場估計與預測:依負載容量,2022-2035年
- 12公斤或以下
- 12~60 kg
- 60~150 kg
- 150公斤或以上
第10章 市場估算與預測:依自動化程度分類,2022-2035年
- 獨立/手動輔助系統
- 半自動系統
- 全自動系統
第11章 市場估價與預測:依最終用戶分類,2022-2035年
- 食品/飲料
- 製藥和生命科學
- 物流/小包裹
- 化妝品和個人護理
- 化工/石油化工
- 汽車和電子
- 其他(菸草、農業、建材)
第12章 市場估計與預測:依通路分類,2022-2035年
- 直銷
- 間接銷售
第13章 市場估計與預測:依地區分類,2022-2035年
- 北美洲
- 美國
- 加拿大
- 歐洲
- 德國
- 英國
- 法國
- 義大利
- 西班牙
- 亞太地區
- 中國
- 印度
- 日本
- 韓國
- 澳洲
- 印尼
- 馬來西亞
- 拉丁美洲
- 巴西
- 墨西哥
- 阿根廷
- 中東和非洲
- 沙烏地阿拉伯
- UAE
- 南非
第14章:公司簡介
- 世界頂尖公司
- Mettler-Toledo International Inc.
- Anritsu Corporation
- A&D Company, Limited
- Thermo Fisher Scientific Inc.
- Robert Bosch GmbH(Bosch Packaging Technology)
- 該地區的領先企業
- WIPOTEC-OCS GmbH
- Minebea Intec GmbH
- Yamato Scale Co., Ltd.
- Shanghai Shigan Industrial Co., Ltd.
- Ishida Co., Ltd.
- 新興企業:
- High Dream Machinery Co., Ltd.
- Multivac Group
- Varpe Control Peso SL
- Bizerba SE &Co. KG
- Cassel Messtechnik GmbH
The Global Automated Weight Checking and Reject Systems Market was valued at USD 1.7 billion in 2025 and is estimated to grow at a CAGR of 5.7% to reach USD 3 billion by 2035.
Market growth is driven by the rising need for precise in-line weight verification and automated rejection of non-compliant products across high-throughput manufacturing environments. Demand is particularly strong across food and beverage, pharmaceutical, and logistics operations where accuracy, compliance, and operational efficiency are critical. Increasing regulatory scrutiny on product fill accuracy, combined with the global shift toward fully automated packaging lines, is further accelerating adoption. Manufacturers are also under pressure to minimize product giveaway losses, which is pushing investment in high-precision weighing systems. As production environments become more digitally integrated, automated checkweighers are increasingly evolving into intelligent data nodes within Industry 4.0 ecosystems. Regulatory frameworks continue to reinforce this trend, with structured compliance requirements governing packaged product weights and measurement accuracy. In the United States, commercial weighing systems are regulated through national standards enforced at the state level, while European regulations mandate strict statistical conformity with declared weights. These regulatory pressures, along with rising automation across FMCG and pharmaceutical manufacturing, are expected to sustain long-term market expansion across global industrial sectors.
| Market Scope | |
|---|---|
| Start Year | 2025 |
| Forecast Year | 2026-2035 |
| Start Value | $1.7 Billion |
| Forecast Value | $3 Billion |
| CAGR | 5.7% |
The in-motion and dynamic checkweighers segment accounted generated USD 925.3 million in 2025, held a 54.4% share. Its leadership is supported by widespread adoption in continuous production environments where products must be weighed without interrupting line speed. Strong demand from high-volume packaging operations continues to reinforce the importance of dynamic weighing systems as a core component of modern automated production lines.
The medium-speed systems segment held a 51.8% share and is expected to grow at a CAGR of 5.9% through 2035. This segment's dominance is linked to its alignment with standard production line throughput levels across multiple industries, including packaged foods, beverages, and consumer goods. Medium-speed configurations offer an optimal balance between accuracy and operational efficiency, making them widely applicable across diverse manufacturing setups where consistent production flow is required.
North America Automated Weight Checking and Reject Systems Market accounted for USD 454.3 million in 2025 and is projected to grow at a CAGR of 5.9% through 2035 in the automated weight checking and reject systems market. The United States represented the largest share within the region at approximately USD 379 million, capturing about 84% of regional revenue. Market growth is supported by a strong manufacturing base in food, beverage, and pharmaceutical sectors, along with increasing automation in logistics and fulfillment operations. Regulatory compliance requirements and standardized measurement frameworks continue to support consistent replacement cycles for installed systems, contributing to sustained demand for upgraded and high precision checkweighing technologies across industrial applications.
Key companies operating in the global automated weight checking and reject systems market include Ishida Co., Ltd., Mettler-Toledo International Inc., Bizerba SE & Co. KG, Anritsu Corporation, WIPOTEC-OCS GmbH, Minebea Intec GmbH, Robert Bosch GmbH, A&D Company, Limited, Thermo Fisher Scientific Inc., Yamato Scale Co., Ltd., Multivac Group, Shanghai Shigan Industrial Co., Ltd., High Dream Machinery Co., Ltd., Varpe Control Peso S.L., and Cassel Messtechnik GmbH. Companies operating in the automated weight checking and reject systems market are adopting advanced automation, digital integration, and precision engineering strategies to strengthen their competitive position. Leading players are increasingly investing in smart checkweighing technologies equipped with IoT connectivity and real-time data analytics to enhance production visibility and quality control. Many firms are integrating their systems with broader packaging automation lines to support seamless Industry 4.0 adoption. Strategic partnerships with packaging equipment manufacturers and industrial automation providers are expanding market reach and improving system interoperability.
Table of Contents
Chapter 1 Methodology & Scope
- 1.1 Market scope and definition
- 1.2 Research design
- 1.2.1 Research approach
- 1.2.2 Data collection methods
- 1.3 Data mining sources
- 1.3.1 Global
- 1.3.2 Regional/Country
- 1.4 Base estimates and calculations
- 1.4.1 Base year calculation
- 1.4.2 Key trends for market estimation
- 1.5 Primary research and validation
- 1.5.1 Primary sources
- 1.6 Forecast model
- 1.7 Research assumptions and limitations
Chapter 2 Executive Summary
- 2.1 Industry 360° synopsis
- 2.2 Key market trends
- 2.2.1 Regional
- 2.2.2 System type
- 2.2.3 Rejection mechanism
- 2.2.4 Speed
- 2.2.5 Weighing technology
- 2.2.6 Weight capacity
- 2.2.7 Level of automation
- 2.2.8 End-user industry
- 2.2.9 Distribution channel
Chapter 3 Industry Insights
- 3.1 Industry ecosystem analysis
- 3.1.1 Supplier landscape
- 3.1.2 Profit margin
- 3.1.3 Value addition at each stage
- 3.1.4 Factor affecting the value chain
- 3.2 Industry impact forces
- 3.2.1 Growth drivers
- 3.2.1.1 Stringent net-content regulations & legal metrology compliance requirements across key markets
- 3.2.1.2 Rapid packaging line automation adoption in FMCG, pharma & logistics sectors
- 3.2.1.3 Growing cost awareness around product giveaway & overfill losses
- 3.2.1.4 Surge in micro-fulfillment & e-commerce logistics demanding high-accuracy weight verification
- 3.2.2 Industry pitfalls & challenges
- 3.2.2.1 Calibration drift & measurement uncertainty management at high-speed production rates
- 3.2.2.2 Vibration & environmental interference affecting weighing precision on plant floors
- 3.2.2.3 Fragmented regional regulatory certification requirements increasing compliance costs
- 3.2.2.4 Manual override culture & operator behavior compromising rejection system integrity
- 3.2.3 Opportunities
- 3.2.3.1 AI & IIoT integration enabling predictive calibration drift detection & autonomous threshold management
- 3.2.3.2 Expansion of combination inspection systems
- 3.2.3.3 Untapped market penetration in Asia Pacific & Latin America food processing sectors
- 3.2.3.4 Rising demand for track-and-trace & serialization integration in pharma packaging lines
- 3.2.1 Growth drivers
- 3.3 Growth potential analysis
- 3.4 Future market trends
- 3.5 Technology and innovation landscape
- 3.5.1 Current technological trends
- 3.5.2 Emerging technologies
- 3.6 Regulatory landscape
- 3.6.1 Standards and compliance requirements
- 3.6.2 Regional regulatory frameworks
- 3.6.3 Certification standards
- 3.7 Trade data analysis (HS Code 8423)
- 3.7.1 Import/export volume & value trends
- 3.7.2 Key trade corridors & tariff impact
- 3.8 Pricing analysis
- 3.8.1 Historical price trend analysis (driven by primary research)
- 3.8.2 Pricing strategy by player type (premium / value / mass market)
- 3.9 Impact of AI & generative AI on the market
- 3.9.1 AI-driven disruption of existing business models
- 3.9.2 GenAI use cases & adoption roadmap by segment
- 3.9.3 Risks, limitations & regulatory considerations
- 3.10 Porter's analysis
- 3.11 PESTEL analysis
Chapter 4 Competitive Landscape, 2025
- 4.1 Introduction
- 4.2 Company market share analysis
- 4.2.1 By Region
- 4.2.1.1 North America
- 4.2.1.2 Europe
- 4.2.1.3 Asia Pacific
- 4.2.1.4 Latin America
- 4.2.1.5 Middle East & Africa
- 4.2.1 By Region
- 4.3 Company matrix analysis
- 4.4 Competitive analysis of major market players
- 4.5 Competitive positioning matrix
- 4.6 Key developments
- 4.6.1 Mergers & acquisitions
- 4.6.2 Partnerships & collaborations
- 4.6.3 New product launches
- 4.6.4 Expansion plans
Chapter 5 Market Estimates & Forecast, By System Type, 2022 - 2035, (USD Million) (Thousand Units)
- 5.1 Key trends
- 5.2 In-motion / dynamic checkweighers
- 5.3 Intermittent / static checkweighers
- 5.4 Combination inspection systems
Chapter 6 Market Estimates & Forecast, By Rejection Mechanism, 2022 - 2035, (USD Million) (Thousand Units)
- 6.1 Key trends
- 6.2 Air blast rejection
- 6.3 Pusher / paddle rejection
- 6.4 Drop flap / trapdoor rejection
- 6.5 Diverter / deflector rejection
- 6.6 Dual rejection systems
Chapter 7 Market Estimates & Forecast, By Speed, 2022 - 2035, (USD Million) (Thousand Units)
- 7.1 Key trends
- 7.2 High-speed (>300 Units/Min)
- 7.3 Medium-speed (50-300 Units/Min)
- 7.4 Low-speed (≤50 Units/Min)
Chapter 8 Market Estimates & Forecast, By Weighing Technology, 2022 - 2035, (USD Million) (Thousand Units)
- 8.1 Key trends
- 8.2 Strain gauge load cell
- 8.3 Electro-magnetic force restoration (EMFR)
- 8.4 Hybrid / advanced sensor systems
Chapter 9 Market Estimates & Forecast, By Weight Capacity, 2022 - 2035, (USD Million) (Thousand Units)
- 9.1 Key trends
- 9.2 Up to 12 kg
- 9.3 12 to 60 kg
- 9.4 60-150 kg
- 9.5 Above 150 kg
Chapter 10 Market Estimates & Forecast, By Level of Automation, 2022 - 2035, (USD Million) (Thousand Units)
- 10.1 Key trends
- 10.2 Standalone / manual-assist systems
- 10.3 Semi-automated systems
- 10.4 Fully automated systems
Chapter 11 Market Estimates & Forecast, By End User, 2022 - 2035, (USD Million) (Thousand Units)
- 11.1 Key trends
- 11.2 Food & beverage
- 11.3 Pharmaceuticals & life sciences
- 11.4 Logistics & parcel
- 11.5 Cosmetics & personal care
- 11.6 Chemical & petrochemical
- 11.7 Automotive & electronics
- 11.8 Others (tobacco, agriculture, building materials)
Chapter 12 Market Estimates & Forecast, By Distribution Channel, 2022 - 2035, (USD Million) (Thousand Units)
- 12.1 Key trends
- 12.2 Direct sales
- 12.3 Indirect sales
Chapter 13 Market Estimates & Forecast, By Region, 2022 - 2035, (USD Million) (Thousand Units)
- 13.1 Key trends
- 13.2 North America
- 13.2.1 U.S.
- 13.2.2 Canada
- 13.3 Europe
- 13.3.1 Germany
- 13.3.2 UK
- 13.3.3 France
- 13.3.4 Italy
- 13.3.5 Spain
- 13.4 Asia Pacific
- 13.4.1 China
- 13.4.2 India
- 13.4.3 Japan
- 13.4.4 South Korea
- 13.4.5 Australia
- 13.4.6 Indonesia
- 13.4.7 Malaysia
- 13.5 Latin America
- 13.5.1 Brazil
- 13.5.2 Mexico
- 13.5.3 Argentina
- 13.6 MEA
- 13.6.1 Saudi Arabia
- 13.6.2 UAE
- 13.6.3 South Africa
Chapter 14 Company Profiles
- 14.1 Top Global Players
- 14.1.1 Mettler-Toledo International Inc.
- 14.1.2 Anritsu Corporation
- 14.1.3 A&D Company, Limited
- 14.1.4 Thermo Fisher Scientific Inc.
- 14.1.5 Robert Bosch GmbH (Bosch Packaging Technology)
- 14.2 Regional Champions
- 14.2.1 WIPOTEC-OCS GmbH
- 14.2.2 Minebea Intec GmbH
- 14.2.3 Yamato Scale Co., Ltd.
- 14.2.4 Shanghai Shigan Industrial Co., Ltd.
- 14.2.5 Ishida Co., Ltd.
- 14.3 Emerging Players:
- 14.3.1 High Dream Machinery Co., Ltd.
- 14.3.2 Multivac Group
- 14.3.3 Varpe Control Peso S.L.
- 14.3.4 Bizerba SE & Co. KG
- 14.3.5 Cassel Messtechnik GmbH

 零售自助結帳系統終端市場:全球市場預測,2026-2032年
 自動結帳系統市場預測至2034年-按組件、技術、門市類型、應用、最終用戶和地區分類的全球分析
 零售自助掃描解決方案市場:按組件、產品類型、型號、技術、零售業態和地區分類
 安全掃描設備市場規模、佔有率和成長分析:按系統類型、部署環境、技術和地區分類-2026-2033年產業預測
 全球零售自助結帳系統終端機市場報告:實際結果與預測(2021-2032年)
 2026年全球零售自助掃描解決方案市場報告
 安全掃描設備市場分析及預測(至2035年):類型、產品類型、服務、技術、組件、應用、部署類型、最終用戶、功能
 安檢設備市場機會、成長要素、產業趨勢分析及2026年至2035年預測
 全球電子銷售終端 (EPOS) 與自助結帳市場:報告與資料庫全球零售自助掃描解決方案市場機會與策略(至 2034 年)