

 |
市場調查報告書
商品編碼
2071182
游泳池市場機會、成長促進因素、產業趨勢分析及2026-2035年預測。Swimming Pool Market Opportunity, Growth Drivers, Industry Trend Analysis, and Forecast 2026 - 2035 |
||||||

據估計,到 2025 年,全球游泳池市場價值將達到 428 億美元,年複合成長率為 6.3%,到 2035 年將達到 788 億美元。
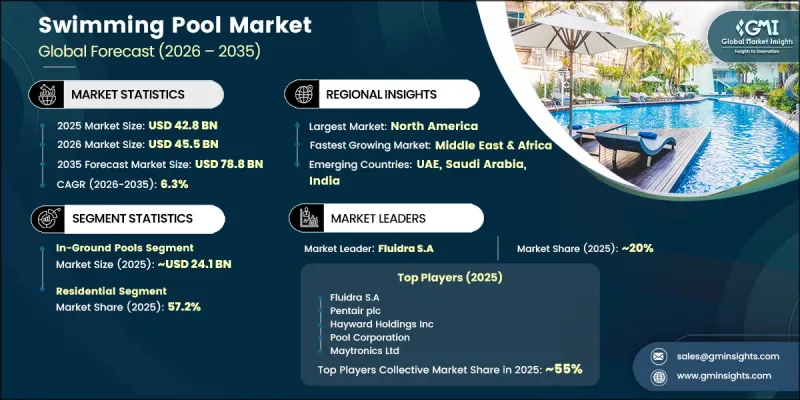
市場擴張的驅動力在於,成熟地區對新建泳池的依賴逐漸轉向更高附加價值的因素,例如技術驅動的升級改造、在以健康為中心的商業設施中安裝泳池,以及新興市場泳池普及的早期階段。可支配收入的成長,加上消費者在家庭休閒設備上支出的增加,持續支撐住宅泳池安裝的強勁需求。同時,人們對健康、健身和水療的日益關注,也影響著對先進泳池配置和物理治療設計的需求。一個關鍵的結構性因素是現有設施的更新換代週期不斷延長,自動化系統、智慧過濾技術、機器人清潔設備和化學品管理解決方案正被擴大採用。這些定期升級改造創造了穩定的售後市場收入來源,減少了對新建設週期的依賴。此外,人口老化和以健康為導向的復健方法的日益普及,進一步推動了對專業泳池基礎設施的需求,從而支持住宅和商業領域的長期成長。
| 市場範圍 | |
|---|---|
| 開始年份 | 2025 |
| 預測期 | 2026-2035 |
| 起始金額 | 428億美元 |
| 預測金額 | 788億美元 |
| 複合年成長率 | 6.3% |
預計到2025年,地下泳池市佔率將達到56.3%,市場規模將達241億美元。該細分市場持續保持主導地位,這主要得益於其強勁的安裝性能以及全球市場持續不斷的維修和更新活動。地下泳池的生命週期由規律的需求週期所支撐。通常情況下,大規模結構維修每10至15年進行一次,表面維修每5至7年進行一次,設備更換則貫穿整個運作週期。這些定期的維護和升級週期產生了永續的收入來源,且基本上獨立於新的安裝活動,從而增強了該細分市場的長期穩定性。
預計2025年,住宅泳池市場規模將達245億美元。此細分市場的需求主要受全球主要市場家庭對生活方式和戶外休閒基礎設施投資的推動。疫情後消費者行為的改變,例如對居家休閒的日益青睞、靈活辦公模式的普及以及對私人健康設施的日益重視,正在推動住宅泳池的持續普及。高所得家庭繼續優先投資於提升戶外生活方式,進一步鞏固了住宅泳池在全球市場中的地位。
到2025年,北美游泳池市場將佔據38%的佔有率,相當於162億美元。該地區的主導地位得益於數量龐大的住宅內置游泳池,估計約有600萬個,這些游泳池持續推動對維修、維護和設備升級的穩定需求。消費者在住宅維修項目上的強勁支出以及根深蒂固的泳池擁有文化,進一步鞏固了北美在全球游泳池行業的領先地位。
目錄
第1章:調查方法
第2章執行摘要
第3章 行業洞察
- 產業生態系分析
- 供應商情況
- 製造商
- 中斷
- 最終用戶
- 利潤率分析
- 每個階段增加的價值
- 影響價值鏈的因素
- 影響產業的因素
- 成長促進因素
- 可支配所得增加,戶外生活方式的投資也隨之增加。
- 旅遊和酒店業的擴張
- 智慧技術的引進與售後升級週期
- 水健康與治療應用領域的成長
- 產業潛在風險與挑戰
- 安裝和維護成本高昂
- 對水資源短缺和環境法規的擔憂
- 季節性需求波動和區域對氣候的敏感性
- 機會
- 成長促進因素
- 成長潛力分析
- 技術與創新展望
- 最新科技趨勢
- 新興技術
- 價格分析
- 按產品類型分析歷史價格趨勢
- 依球員類型分類的定價策略(高級球員、超值球員、成本加成球員)
- 貿易數據分析
- 進出口量及進口額趨勢
- 主要貿易路線及關稅的影響
- 監理情勢
- 標準和合規要求
- 區域監理框架
- 認證標準
- 波特的分析
- PESTLE分析
- 人工智慧和生成式人工智慧對市場的影響
- 利用人工智慧改造現有經營模式
- 按細分市場分類的生成式人工智慧用例和部署藍圖
- 風險、限制和監管考量
第4章 競爭情勢
- 介紹
- 企業市佔率分析
- 按地區
- 企業矩陣分析
- 主要市場公司的競爭分析
- 競爭定位矩陣
- 主要進展
- 併購
- 夥伴關係和聯盟
- 新產品發布
- 業務拓展計劃
第5章 市場估價與預測:依泳池類型分類,2022-2035年
- 住宅泳池
- 商業游泳池
- 公共游泳池
第6章 市場估價與預測:依泳池規模分類,2022-2035年
- 小於170平方米
- 170 m²~500 m²
- 501 m²~1,000 m²
- 1,001 m²~1,500 m²
- 1,501 m²~2,000 m²
- 2,001 m²~2,500 m²
- 2,501 m²~3,000 m²
- 3,001 m²~3,500 m²
- 3,501 m²~4,000 m²
- 4,000平方公尺或以上
第7章 市場估價與預測:依建築類型分類,2022-2035年
- 內建泳池
- 地面式泳池
第8章 市場估算與預測:依組件分類,2022-2035年
- 泳池結構和外殼
- 過濾和水處理系統
- 泳池設施
- 游泳池化學品
- 泳池蓋、安全系統和配件
- 智慧互聯泳池管理系統
- 泳池服務
第9章 市場估計與預測:依最終用途分類,2022-2035年
- 休閒休閒
- 水療和健康
- 休閒水上活動和水上活動
- 娛樂和酒店
- 其他
第10章 市場估價與預測:依地區分類,2022-2035年
- 北美洲
- 美國
- 加拿大
- 歐洲
- 德國
- 英國
- 法國
- 義大利
- 西班牙
- 瑞典
- 荷蘭
- 亞太地區
- 中國
- 印度
- 日本
- 韓國
- 澳洲
- 印尼
- 拉丁美洲
- 巴西
- 墨西哥
- 阿根廷
- 中東和非洲
- 沙烏地阿拉伯
- UAE
- 南非
第11章:公司簡介
- 世界公司
- Crystal Lagoons
- Hayward Industries
- Kelly Slater Wave Company
- Latham Pool Products
- Martin Aquatic
- Pentair plc
- Premier Pools & Spas
- Fluidra
- 當地公司
- Clair Lagon
- Cody Pools
- Maytronics
- Lagoon Life Pools
- Lagoon Pools Asia
- Lucas Lagoons
- Oasis Biosistema
-
- Aventuur
- Blue Haven Pools
- Hydro Master Pools
- MAYGO Pool Technology
- PHNIX
- URBN Surf
The Global Swimming Pool Market was valued at USD 42.8 billion in 2025 and is estimated to grow at a CAGR of 6.3% to reach USD 78.8 billion by 2035.
Market expansion is shaped by a gradual shift away from reliance on new pool construction in mature regions toward higher-value drivers such as technology-enabled upgrades, wellness-focused commercial installations, and early-stage pool adoption in emerging economies. Rising disposable incomes, coupled with increased consumer spending on home-based leisure amenities, continue to support strong demand for residential pool installations. In parallel, the growing emphasis on health, fitness, and hydrotherapy is influencing demand for advanced pool configurations and therapeutic designs. A significant structural driver is the expanding replacement and upgrade cycle within the installed base, where automation systems, smart filtration technologies, robotic cleaning equipment, and chemical management solutions are increasingly being adopted. These recurring upgrades are creating a stable aftermarket revenue stream that is less dependent on new construction cycles. Additionally, demographic aging trends and increasing integration of wellness-oriented rehabilitation practices are further reinforcing demand for specialized pool infrastructure, supporting long-term growth across both residential and commercial segments.
| Market Scope | |
|---|---|
| Start Year | 2025 |
| Forecast Year | 2026-2035 |
| Start Value | $42.8 Billion |
| Forecast Value | $78.8 Billion |
| CAGR | 6.3% |
The in-ground pools segment held a 56.3% share, representing USD 24.1 billion in 2025. This segment continues to lead due to its strong installed base and consistent renovation and refurbishment activity across global markets. The lifecycle of in-ground pools supports recurring demand cycles, with major structural refurbishments typically occurring every 10 to 15 years, surface updates within 5 to 7 years, and continuous equipment replacement requirements throughout their operational lifespan. These recurring maintenance and upgrade cycles generate sustained revenue streams that are largely independent of new installation activity, reinforcing the long-term stability of this segment.
The residential segment generated USD 24.5 billion in 2025. Demand in this segment is strongly influenced by household investment in lifestyle and outdoor leisure infrastructure across key global markets. Shifts in consumer behavior following the pandemic, including increased preference for home-centered recreation, flexible work arrangements, and greater emphasis on private wellness amenities, have contributed to sustained residential pool adoption. Higher-income households continue to prioritize investment in outdoor living enhancements, further strengthening the residential segment's position within the global market landscape.
North America Swimming Pool Market held a 38% share, equivalent to USD 16.2 billion in 2025. The region's leadership is supported by a substantial installed base of residential in-ground pools, estimated at approximately 6 million units, which continues to drive consistent renovation, maintenance, and equipment upgrade demand. Strong consumer spending on home improvement projects and well-established pool ownership culture further reinforce North America's dominant position in the global swimming pool industry.
Major companies operating in the global swimming pool market include Hayward Holdings Inc., Fluidra S.A., Pentair plc, Pool Corporation, Latham Group Inc., Maytronics Ltd, BWT AG, Paramount Pool Products, and Intex Recreation Corp. Companies operating in the swimming pool market are adopting multiple strategic initiatives to strengthen their competitive positioning and expand their global footprint. Product innovation remains a core focus, with manufacturers developing advanced automation systems, energy-efficient pumps, smart monitoring technologies, and robotic cleaning solutions to enhance pool performance and user convenience. Many companies are expanding their aftermarket service offerings to capture recurring revenue from maintenance, refurbishment, and upgrade cycles. Strategic partnerships with builders, distributors, and service providers are helping improve market penetration and distribution efficiency. Businesses are also investing in digital platforms and connected pool technologies to improve customer engagement and remote system management.
Table of Contents
Chapter 1 Research methodology
- 1.1 Research approach
- 1.2 Quality Commitments
- 1.2.1 GMI AI policy & data integrity commitment
- 1.2.1.1 Source consistency protocol
- 1.2.1 GMI AI policy & data integrity commitment
- 1.3 Research trail & confidence scoring
- 1.3.1 Research trail components
- 1.3.2 Scoring components
- 1.4 Data Collection
- 1.4.1 Partial list of primary sources
- 1.5 Data mining sources
- 1.5.1 Paid sources
- 1.5.1.1 Sources, by region
- 1.5.1 Paid sources
- 1.6 Base estimates and calculations
- 1.6.1 Base year calculation
- 1.7 Forecast model
- 1.7.1 Quantified market impact analysis
- 1.7.1.1 Mathematical impact of growth parameters on forecast
- 1.7.1 Quantified market impact analysis
- 1.8 Research transparency addendum
- 1.8.1 Source attribution framework
- 1.8.2 Quality assurance metrics
- 1.8.3 Our commitment to trust
Chapter 2 Executive Summary
- 2.1 Industry 360° synopsis
- 2.2 Business trends
- 2.3 Regional
- 2.4 Pool type
- 2.5 Pool size
- 2.6 Construction type
- 2.7 Component
- 2.8 End use
Chapter 3 Industry Insights
- 3.1 Industry ecosystem analysis
- 3.1.1 Supplier landscape
- 3.1.2 Manufacturers
- 3.1.3 Distributors
- 3.1.4 End users
- 3.1.5 Profit margin analysis
- 3.1.6 Value addition at each stage
- 3.1.7 Factor affecting the value chain
- 3.2 Industry impact forces
- 3.2.1 Growth drivers
- 3.2.1.1 Rising disposable income and outdoor living investment
- 3.2.1.2 Expansion of the tourism and hospitality sector
- 3.2.1.3 Smart technology adoption and aftermarket upgrade cycles
- 3.2.1.4 Growth in aquatic wellness and therapeutic applications
- 3.2.2 Industry pitfalls & challenges
- 3.2.2.1 High installation and maintenance costs
- 3.2.2.2 Water scarcity concerns and environmental regulations
- 3.2.2.3 Seasonal demand volatility and regional climate sensitivity
- 3.2.3 Opportunities
- 3.2.1 Growth drivers
- 3.3 Growth potential analysis
- 3.4 Technology and innovation landscape
- 3.4.1 Current technological trends
- 3.4.2 Emerging technologies
- 3.5 Pricing analysis (driven by primary research)
- 3.5.1 Historical price trend analysis by product category
- 3.5.2 Pricing strategy by player type (premium / value / cost-plus)
- 3.6 Trade data analysis (based on paid database)
- 3.6.1 Import/export volume & value trends
- 3.6.2 Key trade corridors & tariff impact
- 3.7 Regulatory landscape
- 3.7.1 Standards and compliance requirements
- 3.7.2 Regional regulatory frameworks
- 3.7.3 Certification standards
- 3.8 Porter's analysis
- 3.9 PESTEL analysis
- 3.10 Impact of AI & generative AI on the market
- 3.10.1 AI-driven disruption of existing business models
- 3.10.2 GenAI use cases & adoption roadmap by segment
- 3.10.3 Risks, limitations & regulatory considerations
Chapter 4 Competitive Landscape, 2025
- 4.1 Introduction
- 4.2 Company market share analysis
- 4.2.1 By Region
- 4.2.1.1 North America
- 4.2.1.2 Europe
- 4.2.1.3 Asia Pacific
- 4.2.1.4 Latin America
- 4.2.1.5 Middle East & Africa
- 4.2.1 By Region
- 4.3 Company matrix analysis
- 4.4 Competitive analysis of major market players
- 4.5 Competitive positioning matrix
- 4.6 Key developments
- 4.6.1 Mergers & acquisitions
- 4.6.2 Partnerships & collaborations
- 4.6.3 New product launches
- 4.6.4 Expansion plans
Chapter 5 Market Estimates & Forecast, By Pool Type, 2022 - 2035, (USD Billion)
- 5.1 Key trends
- 5.2 Residential Pools
- 5.3 Commercial Pools
- 5.4 Public Pools
Chapter 6 Market Estimates & Forecast, By Pool Size, 2022 - 2035, (USD Billion)
- 6.1 Key trends
- 6.2 Below 170 m2
- 6.3 170 m2 to 500 m2
- 6.4 501 m2 to 1,000 m2
- 6.5 1,001 m2 to 1,500 m2
- 6.6 1,501 m2 to 2,000 m2
- 6.7 2,001 m2 to 2,500 m2
- 6.8 2,501 m2 to 3,000 m2
- 6.9 3,001 m2 to 3,500 m2
- 6.10 3,501 m2 to 4,000 m2
- 6.11 Above 4,000 m2
Chapter 7 Market Estimates & Forecast, By Construction Type, 2022 - 2035, (USD Billion)
- 7.1 Key trends
- 7.2 In-Ground Pools
- 7.3 Above-Ground Pools
Chapter 8 Market Estimates & Forecast, By Component, 2022 - 2035, (USD Billion)
- 8.1 Key trends
- 8.2 Pool Structure and Shell
- 8.3 Filtration and Water Treatment Systems
- 8.4 Pool Equipment
- 8.5 Pool Chemicals
- 8.6 Pool Covers, Safety Systems, and Accessories
- 8.7 Smart and Connected Pool Management Systems
- 8.8 Pool Services
Chapter 9 Market Estimates & Forecast, By End Use, 2022 - 2035, (USD Billion)
- 9.1 Key trends
- 9.2 Recreational and Leisure
- 9.3 Aquatic Therapy and Wellness
- 9.4 Recreational Water Sports and Aquatic Activities
- 9.5 Entertainment and Hospitality
- 9.6 Others
Chapter 10 Market Estimates & Forecast, By Region, 2022 - 2035, (USD Billion)
- 10.1 Key trends
- 10.2 North America
- 10.2.1 U.S
- 10.2.2 Canada
- 10.3 Europe
- 10.3.1 Germany
- 10.3.2 UK
- 10.3.3 France
- 10.3.4 Italy
- 10.3.5 Spain
- 10.3.6 Sweden
- 10.3.7 Netherlands
- 10.4 Asia Pacific
- 10.4.1 China
- 10.4.2 India
- 10.4.3 Japan
- 10.4.4 South Korea
- 10.4.5 Australia
- 10.4.6 Indonesia
- 10.5 Latin America
- 10.5.1 Brazil
- 10.5.2 Mexico
- 10.5.3 Argentina
- 10.6 Middle East and Africa
- 10.6.1 Saudi Arabia
- 10.6.2 UAE
- 10.6.3 South Africa
Chapter 11 Company Profiles
- 11.1 Global Players
- 11.1.1 Crystal Lagoons
- 11.1.2 Hayward Industries
- 11.1.3 Kelly Slater Wave Company
- 11.1.4 Latham Pool Products
- 11.1.5 Martin Aquatic
- 11.1.6 Pentair plc
- 11.1.7 Premier Pools & Spas
- 11.1.8 Fluidra
- 11.2 Regional Players
- 11.2.1 Clair Lagon
- 11.2.2 Cody Pools
- 11.2.3 Maytronics
- 11.2.4 Lagoon Life Pools
- 11.2.5 Lagoon Pools Asia
- 11.2.6 Lucas Lagoons
- 11.2.7 Oasis Biosistema
- 11.3 Emerging Players & Innovators
- 11.3.1 Aventuur
- 11.3.2 Blue Haven Pools
- 11.3.3 Hydro Master Pools
- 11.3.4 MAYGO Pool Technology
- 11.3.5 PHNIX
- 11.3.6 URBN Surf

 游泳池建造市場規模、佔有率和成長分析:按泳池類型、建造類型、材質、安裝類型、施工方法、應用、最終用戶和地區分類-2026-2033年產業預測
 泳池建造市場-全球產業規模、佔有率、趨勢、機會、預測:按材料、最終用戶、地區和競爭格局分類,2021-2031年
 全球可攜式游泳池市場規模、佔有率、趨勢和成長分析報告(2026-2034年)
 2026-2030年全球游泳池市場
 游泳池建造市場報告:按材料、建造類型、最終用戶和地區分類(2026-2034 年)
 LED水下泳池照明市場按產品類型、燈光顏色、安裝類型、功率範圍、最終用戶和分銷管道分類-2026-2032年全球預測游泳池設備市場按設備類型、泳池類型、材料、最終用途和分銷管道分類,全球預測(2026-2032年)
 可攜式游泳池市場:市場機會、成長促進因素、產業趨勢分析及預測(2026-2035)
 全球泳池配件市場全球太陽能泳池撇渣器市場