


 |
市場調查報告書
商品編碼
2071170
BESS 容器和外殼市場機會、成長促進因素、產業趨勢分析以及 2026-2035 年預測。BESS Container and Enclosure Market Opportunity, Growth Drivers, Industry Trend Analysis, and Forecast 2026 - 2035 |
||||||
全球儲能系統容器和外殼市場預計到 2025 年將達到 68 億美元,年複合成長率為 15.3%,到 2035 年將達到 314 億美元。
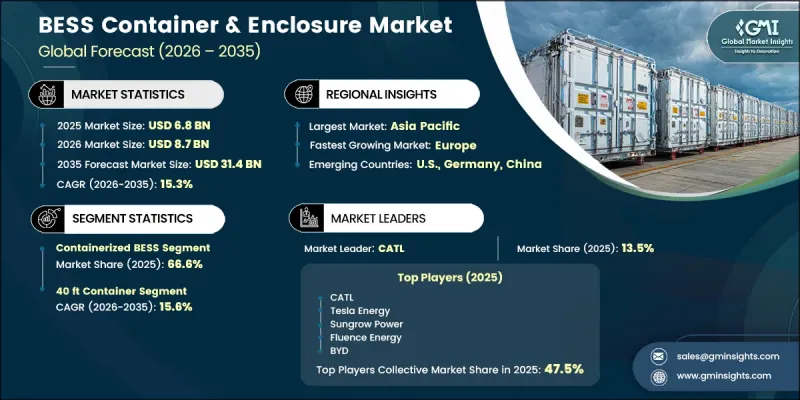
磷酸鋰鐵電池(LFP)價格的快速下降正在推動市場成長。預計到2025年底,其在中國國內市場的價格將達到每千瓦時約40美元,這將顯著改善專案的經濟效益,並促使高性能貨櫃式儲能系統得到更廣泛的應用。同時,外殼系統在系統總成本結構中的佔比越來越大,在每千瓦時75美元的核心設備基準成本中,外殼系統幾乎占到90%,凸顯了其在系統層面創造價值方面日益成長的重要性。業界正經歷著從基本防護外殼向完全整合的貨櫃式能源平台的明顯轉變,這些平台將溫度控制、電池管理系統和功率轉換技術整合到預製單元中。這一轉變降低了安裝的複雜性,縮短了部署時間,並減輕了開發商和EPC承包商的土木工程要求。符合安全標準和熱性能標準現在是外殼設計的核心技術重點,進一步推動了產品複雜性的提升。向標準化工廠組裝系統的轉變正在縮短採購週期,並在全球儲能專案中實現更具擴充性的部署模式。
| 市場範圍 | |
|---|---|
| 開始年份 | 2025 |
| 預測期 | 2026-2035 |
| 起始金額 | 68億美元 |
| 預測金額 | 314億美元 |
| 複合年成長率 | 15.3% |
預計到2025年,貨櫃式儲能系統(BESS)的市佔率將達到66.6%,並在2035年之前維持15.3%的複合年成長率。其在該領域的主導地位主要得益於其適用於公用事業規模和電網規模的儲能應用。標準化的貨櫃尺寸、整合的電池模組、內建的溫度控管系統、電池管理系統和功率轉換組件均有助於實現高運作效率。此外,這些裝置與全球航運和物流系統的兼容性也使其在國際能源專案中部署時更具柔軟性。
預計到2025年,機櫃和機架式儲能系統市場佔有率將達到21.8%,並在2035年之前以14.8%的複合年成長率成長。這些系統主要部署於商業和工業環境、資料中心以及使用者側應用,在這些應用中,緊湊的設計、模組化的擴充性和室內安裝的柔軟性至關重要。推動這一市場成長的因素是,市場對本地化儲能解決方案的需求日益成長,這些解決方案能夠提高能源可靠性,並在有限的空間內支援尖峰負載管理。
預計到2025年,北美儲能系統(BESS)貨櫃外殼市佔率將達到29.9%,並在2035年之前以14.9%的複合年成長率成長。這主要得益於公用事業規模電池部署的強勁成長。近期聯邦數據顯示,2025年將新增57.6吉瓦時的儲能容量,比先前的最高紀錄年份增加30%。隨著更多吉瓦級儲能容量併入國家電網以支持可再生能源的擴張並提高電網可靠性,預計該市場將持續擴張。
目錄
第1章:調查方法和範圍
第2章執行摘要
第3章 行業洞察
- 產業生態系分析
- 原物料供應商分析
- 零件製造商分析
- 機殼OEM製造商和整合商
- EPC承包商和專案開發商
- 最終使用者和資產管理者
- 監理情勢
- 影響產業的因素
- 成長促進因素
- 產業潛在風險與挑戰
- 成長潛力分析
- 波特的分析
- PESTLE分析
- 投資與資金籌措分析
- 小規模天然氣基礎設施資本投資趨勢
- 政府津貼和補貼
- 貿易數據分析
- 進出口分析
- 主要貿易路線及關稅的影響
- 人工智慧和生成式人工智慧對市場的影響
- 利用人工智慧改造現有經營模式
- 生成式人工智慧的應用案例與實施藍圖
- 風險、限制和監管考量
- 永續發展措施與工業4.0的融合
- 投資與資金籌措分析
第4章 競爭情勢
- 介紹
- 企業市佔率分析:按地區分類
- 北美洲
- 歐洲
- 亞太地區
- 中東和非洲
- 拉丁美洲
- 主要進展
- 重要合作夥伴關係和合作
- 主要併購活動
- 產品創新和新產品發布
- 市場擴大策略
- 競爭定位矩陣
- 排名分類標準與遴選標準
- 按銷售額、地區和創新能力分類的層級定位矩陣。
第5章 市場規模及預測:依產品分類,2022-2035年
- 容器型 BESS
- 機櫃和機架
- 移動式及拖車式
第6章 市場規模及預測:依貨櫃尺寸分類,2022-2035年
- 40英尺
- 20英尺
- 10英尺
- 客製化/非標準
第7章 市場規模及預測:依冷卻系統分類,2022-2035年
- 空冷式
- 液冷
- 混合冷卻
- PCM冷卻
第8章 市場規模及預測:依安裝類型分類,2022-2035年
- 室內的
- 戶外的
- 近海/海洋
第9章 市場規模及預測:依應用領域分類,2022-2035年
- 公用事業規模
- 可再生能源併網
- 商業和工業(C&I)
- 資料中心
- 電動車充電基礎設施
- 軍事/國防
- 住宅
- 醫療保健和醫院
- 其他
第10章 市場規模及預測:依地區分類,2022-2035年
- 北美洲
- 美國
- 加拿大
- 墨西哥
- 歐洲
- 英國
- 德國
- 法國
- 西班牙
- 俄羅斯
- 義大利
- 亞太地區
- 中國
- 日本
- 韓國
- 印度
- 澳洲
- 中東和非洲
- UAE
- 沙烏地阿拉伯
- 南非
- 埃及
- 拉丁美洲
- 巴西
- 智利
- 阿根廷
第11章:公司簡介
- AlphaESS
- BYD
- CATL
- Canadian Solar
- Eaton
- Fluence Energy
- Gotion High-tech
- Hithium Energy Storage Technology
- Hitachi Energy
- Honeywell International
- Hyperstrong Energy Technology
- Huawei Digital Power
- Powin
- Sungrow Power
- Samsung SDI
- Schneider Electric
- Saft
- Tesla Energy
- TLS Energy
- Voltra Energy
- Wartsila Energy
The Global BESS Container & Enclosure Market was valued at USD 6.8 billion in 2025 and is estimated to grow at a CAGR of 15.3% to reach USD 31.4 billion in 2035.
Market growth is reinforced by rapidly falling lithium iron phosphate (LFP) cell prices, which reached approximately USD 40 per kWh in Chinese domestic markets by late 2025, significantly improving project economics and expanding adoption across higher-performance containerized storage systems. At the same time, enclosure systems are increasingly capturing a larger share of total system cost structures, accounting for nearly 90% of the USD 75 per kWh core equipment baseline, highlighting their rising importance in system-level value creation. The industry is undergoing a clear transition from basic protective housing toward fully integrated containerized energy platforms that combine thermal regulation, battery management systems, and power conversion technologies within prefabricated units. This shift is reducing installation complexity, shortening deployment timelines, and lowering civil engineering requirements for developers and EPC contractors. Safety compliance and thermal performance standards are now central engineering priorities in enclosure design, further elevating product sophistication. The move toward standardized, factory-assembled systems is enabling faster procurement cycles and more scalable deployment models across global energy storage projects.
| Market Scope | |
|---|---|
| Start Year | 2025 |
| Forecast Year | 2026-2035 |
| Start Value | $6.8 Billion |
| Forecast Value | $31.4 Billion |
| CAGR | 15.3% |
Containerized BESS systems accounted for 66.6% share in 2025, maintaining growth at a CAGR of 15.3% through 2035. This segment's leadership is driven by its suitability for utility-scale and grid-scale energy storage applications, where standardized container dimensions, integrated battery modules, built-in thermal management systems, battery management systems, and power conversion components deliver high operational efficiency. The compatibility of these units with global shipping and logistics frameworks further enhances their deployment flexibility across international energy projects.
The cabinet and rack-based enclosure systems segment held a 21.8% share in 2025 and is projected to grow at a CAGR of 14.8% through 2035. These systems are primarily deployed in commercial and industrial environments, data centers, and behind-the-meter applications where compact design, modular scalability, and indoor installation flexibility are essential. Their adoption is supported by increasing demand for localized energy storage solutions that enhance energy reliability and support peak load management in constrained spaces.
North America BESS Container & Enclosure Market 29.9% share in 2025 and is projected to grow at a CAGR of 14.9% through 2035, supported by strong growth in utility-scale battery installations. Recent federal data indicates that 57.6 GWh of new storage capacity was added in 2025, representing a 30% increase over the previous record year. Continued expansion is expected as additional multi-gigawatt storage capacity is integrated into the national grid to support renewable energy expansion and grid reliability improvements.
Major companies operating in the BESS Container & Enclosure market include CATL (Contemporary Amperex Technology Co., Ltd.), BYD, Sungrow Power, Fluence Energy, Hitachi Energy, Schneider Electric, Samsung SDI, Eaton, Canadian Solar, Huawei Digital Power, Gotion High-Tech, AlphaESS, Hithium Energy Storage Technology, Hyperstrong Energy Technology, Powin, and Samsung SDI. Companies operating in the BESS Container & Enclosure market are focusing on several strategic initiatives to strengthen their competitive position and expand global market share. A key strategy involves developing highly integrated, prefabricated container systems that combine batteries, thermal management, and power conversion technologies into standardized units. Manufacturers are also investing heavily in improving safety architecture, fire suppression systems, and thermal stability mechanisms to meet increasingly strict regulatory requirements. Strategic partnerships with utilities, EPC contractors, and renewable developers are enabling large-scale deployment and long-term supply agreements. Firms are expanding manufacturing capacity in key regions to reduce logistics costs and improve delivery timelines.
Table of Contents
Chapter 1 Methodology & Scope
- 1.1 Research approach
- 1.2 Quality commitments
- 1.2.1 GMI AI policy & data integrity commitment
- 1.2.1.1 Source consistency protocol
- 1.2.1 GMI AI policy & data integrity commitment
- 1.3 Research trail & confidence scoring
- 1.3.1 Research trail components
- 1.3.2 Scoring components
- 1.4 Data collection
- 1.4.1 Partial list of primary sources
- 1.5 Data mining sources
- 1.5.1 Paid sources
- 1.5.1.1 Sources, by region
- 1.5.1 Paid sources
- 1.6 Base estimates and calculations
- 1.6.1 Base year calculation for any one approach
- 1.7 Market estimates & forecasts parameters
- 1.8 Forecast model
- 1.8.1 Quantified market impact analysis
- 1.8.1.1 Mathematical impact of growth parameters on forecast
- 1.8.1 Quantified market impact analysis
- 1.9 Research transparency addendum
- 1.9.1 Source attribution framework
- 1.9.2 Quality assurance metrics
- 1.9.3 Our commitment to trust
- 1.10 Market definitions
Chapter 2 Executive Summary
- 2.1 Industry synopsis, 2022 - 2035
- 2.1.1 Business trends
- 2.1.2 Product trends
- 2.1.3 Container size trends
- 2.1.4 Cooling trends
- 2.1.5 Installation trends
- 2.1.6 Application trends
- 2.1.7 Regional trends
Chapter 3 Industry Insights
- 3.1 Industry ecosystem analysis
- 3.1.1 Raw material suppliers analysis
- 3.1.2 Component manufacturers analysis
- 3.1.3 Enclosure OEMs & integrators
- 3.1.4 EPC contractors & project developers
- 3.1.5 End-users & asset operators
- 3.2 Regulatory landscape
- 3.3 Industry impact forces
- 3.3.1 Growth drivers
- 3.3.2 Industry pitfalls & challenges
- 3.4 Growth potential analysis
- 3.5 Porter's analysis
- 3.5.1 Bargaining power of suppliers
- 3.5.2 Bargaining power of buyers
- 3.5.3 Threat of new entrants
- 3.5.4 Threat of substitutes
- 3.6 PESTEL analysis
- 3.6.1 Political factors
- 3.6.2 Economic factors
- 3.6.3 Social factors
- 3.6.4 Technological factors
- 3.6.5 Legal factors
- 3.6.6 Environmental factors
- 3.7 Investment & funding analysis
- 3.7.1 Capital investment trends in small-scale LNG infrastructure
- 3.7.2 Government grants & subsidies
- 3.8 Trade Data Analysis (Driven by Primary Research)
- 3.8.1 Import/export analysis
- 3.8.2 Key trade corridors & tariff impact
- 3.9 Impact of AI & Generative AI on the market
- 3.9.1 AI-Driven disruption of existing business models
- 3.9.2 GenAI use cases & adoption roadmap
- 3.9.3 Risks, limitations & regulatory considerations
- 3.10 Sustainability initiatives & industry 4.0 integration
- 3.11 Investment & funding analysis
Chapter 4 Competitive Landscape, 2026
- 4.1 Introduction
- 4.2 Company market share analysis, by region, 2025
- 4.2.1 North America
- 4.2.2 Europe
- 4.2.3 Asia Pacific
- 4.2.4 Middle East & Africa
- 4.2.5 Latin America
- 4.3 Key developments
- 4.3.1 Key partnerships & collaborations
- 4.3.2 Major M&A activities
- 4.3.3 Product innovations & launches
- 4.3.4 Market expansion strategies
- 4.4 Competitive positioning matrix
- 4.4.1 Tier classification criteria & qualifying thresholds
- 4.4.2 Tier positioning matrix by revenue, geography & innovation
Chapter 5 Market Size and Forecast, By Product, 2022 - 2035 (USD Million)
- 5.1 Key trends
- 5.2 Containerized BESS
- 5.3 Cabinet & Rack
- 5.4 Mobile & Trailer-Mounted
Chapter 6 Market Size and Forecast, By Container Size, 2022 - 2035 (USD Million)
- 6.1 Key trends
- 6.2 40 ft
- 6.3 20 ft
- 6.4 10 ft
- 6.5 Custom/Non-Standard
Chapter 7 Market Size and Forecast, By Cooling, 2022 - 2035 (USD Million)
- 7.1 Key trends
- 7.2 Air Cooling
- 7.3 Liquid Cooling
- 7.4 Hybrid Cooling
- 7.5 PCM Cooling
Chapter 8 Market Size and Forecast, By Installation, 2022 - 2035 (USD Million)
- 8.1 Key trends
- 8.2 Indoor
- 8.3 Outdoor
- 8.4 Offshore/Marine
Chapter 9 Market Size and Forecast, By Application, 2022 - 2035 (USD Million)
- 9.1 Key trends
- 9.2 Utility Scale
- 9.3 Renewable Energy Integration
- 9.4 Commercial & Industrial (C&I)
- 9.5 Data Centers
- 9.6 EV Charging Infrastructure
- 9.7 Military & Defense
- 9.8 Residential
- 9.9 Healthcare & Hospitals
- 9.10 Others
Chapter 10 Market Size and Forecast, By Region, 2022 - 2035 (USD Million)
- 10.1 Key trends
- 10.2 North America
- 10.2.1 U.S.
- 10.2.2 Canada
- 10.2.3 Mexico
- 10.3 Europe
- 10.3.1 UK
- 10.3.2 Germany
- 10.3.3 France
- 10.3.4 Spain
- 10.3.5 Russia
- 10.3.6 Italy
- 10.4 Asia Pacific
- 10.4.1 China
- 10.4.2 Japan
- 10.4.3 South Korea
- 10.4.4 India
- 10.4.5 Australia
- 10.5 Middle East & Africa
- 10.5.1 UAE
- 10.5.2 Saudi Arabia
- 10.5.3 South Africa
- 10.5.4 Egypt
- 10.6 Latin America
- 10.6.1 Brazil
- 10.6.2 Chile
- 10.6.3 Argentina
Chapter 11 Company Profiles
- 11.1 AlphaESS
- 11.2 BYD
- 11.3 CATL
- 11.4 Canadian Solar
- 11.5 Eaton
- 11.6 Fluence Energy
- 11.7 Gotion High-tech
- 11.8 Hithium Energy Storage Technology
- 11.9 Hitachi Energy
- 11.10 Honeywell International
- 11.11 Hyperstrong Energy Technology
- 11.12 Huawei Digital Power
- 11.13 Powin
- 11.14 Sungrow Power
- 11.15 Samsung SDI
- 11.16 Schneider Electric
- 11.17 Saft
- 11.18 Tesla Energy
- 11.19 TLS Energy
- 11.20 Voltra Energy
- 11.21 Wartsila Energy
 貨櫃式製氫裝置市場按裝置類型、容量、壓力類型、生產技術和最終用途分類-全球預測,2026-2032年液冷電池儲能容器市場按技術類型、電池容量、安裝方式、應用領域和最終用戶分類,全球預測(2026-2032年)貨櫃式液冷能源儲存系統系統市場:按技術、容量、電壓、應用和最終用途分類的全球預測(2026-2032年)電池能源儲存系統(BESS)容器市場按化學成分、容量、應用和最終用戶分類 - 全球預測 2026-2032
 全球貨櫃式電池儲能系統市場規模研究與預測,按電池類型、功率等級、貨櫃尺寸、應用和最終用戶分類,以及2025-2035年區域預測貨櫃電池能源儲存系統市場(按電池類型、系統容量、貨櫃尺寸、應用和最終用戶)—2025-2030 年全球預測
 全球貨櫃式儲能系統 (BESS) 市場(按電池類型、容量、貨櫃尺寸、應用和地區分類)- 預測至 2030 年
 液冷貨櫃式能源儲存系統市場-全球及區域產品、應用與國家分析-分析與預測(2025-2034)