


 |
市場調查報告書
商品編碼
2061478
裝甲車輛市場機會、成長要素、產業趨勢分析及2026-2035年預測Armored Vehicles Market Opportunity, Growth Drivers, Industry Trend Analysis, and Forecast 2026 - 2035 |
||||||
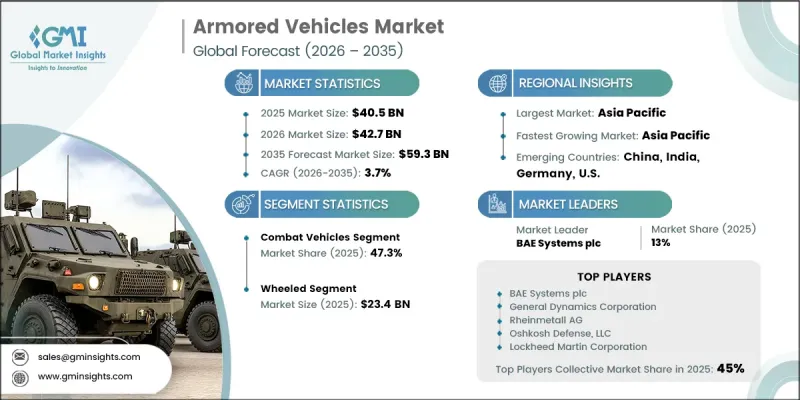
預計到 2025 年,全球裝甲車市場價值將達到 405 億美元,並預計以 3.7% 的複合年成長率成長,到 2035 年達到 593 億美元。
市場擴張的促進因素包括:地緣政治不確定性加劇,各國加強防禦態勢;加大能力提升項目投入;以及日益關注國內安全行動和非對稱戰爭威脅。此外,隨著裝甲平台的應用範圍從傳統軍事用途擴展到國內防禦和特種安全任務,市場需求也不斷成長。同時,在惡劣和敵對地形中對高防護、高機動性解決方案的需求持續推動全球國防部隊的採購活動。持續進行的車輛升級和現代化舉措,以及旨在提升生存能力、機動性和任務多功能性的新一代裝甲平台的研發,進一步加速了這些平台的應用。
| 市場範圍 | |
|---|---|
| 開始年份 | 2025 |
| 預測期 | 2026-2035 |
| 上市時的市場規模 | 405億美元 |
| 預測金額 | 593億美元 |
| 複合年成長率 | 3.7% |
裝甲車輛市場正受到衝突升級和持續安全威脅的推動,促使各國政府大幅增加國防預算以保護其地面部隊。隨著全球區域衝突的加劇,國防機構正在增加對陸上作戰系統的投資,以增強部隊防護和戰場效能。同時,政府主導的現代化舉措正在重新評估採購重點,並著重於替換老舊車輛和提升作戰能力。這些現代化計畫強調加強防護系統、提高機動性和提升戰備標準。日益增強的威脅意識進一步促使各國政府投入更多資金來加強裝甲機動基礎設施。因此,車輛現代化和國防能力提升的持續投資在推動市場長期擴張方面發揮核心作用。
預計2026年至2035年間,無人裝甲地面車輛市場將以10.1%的複合年成長率成長。降低戰場人員風險和提高任務效率的需求日益成長,正在加速自主和遠端操控地面系統的應用。人工智慧、感測器技術以及指揮控制架構的不斷進步,也進一步推動了這些無人平台的研發和部署。
預計到2035年,拖曳式裝甲車市場將以2.7%的複合年成長率成長。市場對這些平台的需求主要源自於其在複雜地形和高強度作戰環境中高效作戰的能力。卓越的有效載荷能力、增強的防護水平和高戰場穩定性使其成為前線作戰任務的理想選擇,因此正被各國國防部長穩採用。
預計到2025年,北美裝甲車輛市佔率將達到33.5%。該地區的成長主要得益於對現代化項目、能力提升以及整體陸地防禦系統戰備水準的持續投入。對作戰機動性、生存能力和互通性的重視,支撐了對各類任務類別中先進裝甲平台的需求。此外,成熟的國防製造基地以及將先進技術融入下一代軍用車輛的持續努力,也進一步推動了市場成長。
目錄
第1章:調查方法和範圍
第2章執行摘要
第3章 行業洞察
- 工業生態系分析
- 供應商情況
- 利潤率
- 成本結構
- 每個階段增加的價值
- 影響價值鏈的因素
- 中斷
- 影響產業的因素
- 促進因素
- 日益惡化的安全威脅與地緣政治衝突
- 政府加大對國防現代化計畫的投入
- 擴大反恐和國內安全行動
- 商用裝甲車輛需求不斷成長
- 加強都市區作戰與安全行動
- 產業潛在風險與挑戰
- 裝甲車輛的購置成本和全壽命週期成本高昂
- 複雜的採購流程和漫長的開發週期
- 市場機遇
- 自主式和可選有人駕駛式裝甲車輛技術的融合。
- 人們對輕量材料和最佳化移動性越來越感興趣。
- 促進因素
- 成長潛力分析
- 監理情勢
- 北美洲
- 歐洲
- 亞太地區
- 拉丁美洲
- 中東和非洲
- 波特的分析
- PESTLE分析
- 技術與創新展望
- 最新科技趨勢
- 新技術
- 價格趨勢
- 按地區
- 依產品
- 定價策略
- 新興經營模式
- 合規要求
- 專利和智慧財產權分析
第4章 競爭情勢
- 介紹
- 企業市佔率分析
- 按地區
- 北美洲
- 歐洲
- 亞太地區
- 拉丁美洲
- 中東和非洲
- 市場集中度分析
- 按地區
- 主要公司的競爭標竿分析
- 財務績效比較
- 收入
- 利潤率
- R&D
- 產品系列比較
- 產品線寬度
- 科技
- 創新
- 區域擴張比較
- 全球擴張分析
- 服務網路覆蓋
- 按地區分類的市場滲透率
- 競爭定位矩陣
- 領導者
- 挑戰者
- 追蹤者
- 利基參與企業
- 戰略展望矩陣
- 併購
- 夥伴關係和聯盟
- 技術進步
- 擴張和投資策略
- 數位轉型計劃
- 財務績效比較
- 新興企業競爭公司和新創企業的發展趨勢
第5章 市場估計與預測:依平台分類,2022-2035年
- 戰鬥車輛
- 戰鬥支援車輛
- 無人裝甲地面車輛
- 民用/商用裝甲車輛
第6章 市場估算與預測:依行程類型分類,2022-2035年
- 帶輪子的
- 牽引類型
- 其他
第7章 市場估計與預測:依促進因素分類,2022-2035年
- 傳統的
- 混合
- 電的
- 其他
第8章 市場估算與預測:依解類型分類,2022-2035年
- Line-Fit/原廠配套
- 維修和安裝
第9章 市場估計與預測:依地區分類,2022-2035年
- 北美洲
- 美國
- 加拿大
- 歐洲
- 德國
- 英國
- 法國
- 西班牙
- 義大利
- 俄羅斯
- 亞太地區
- 中國
- 印度
- 日本
- 澳洲
- 韓國
- 拉丁美洲
- 巴西
- 墨西哥
- 阿根廷
- 中東和非洲
- 南非
- 沙烏地阿拉伯
- 阿拉伯聯合大公國
第10章:公司簡介
- 全球主要公司
- BAE Systems plc
- General Dynamics Corporation
- Rheinmetall AG
- Oshkosh Defense, LLC
- Lockheed Martin Corporation
- 該地區的主要公司
- 亞太地區
- Hanwha Defense
- Hyundai Rotem Company
- Tata Advanced Systems Limited
- ST Engineering Land Systems
- 歐洲
- KNDS(Krauss-Maffei Wegmann & Nexter Group)
- Iveco Defense Vehicles
- Arquus
- Middle East & Africa
- NIMR Automotive LLC
- Denel Vehicle Systems
- Paramount Group
- 亞太地區
- 小眾參與企業和顛覆者
- Milrem Robotics
The Global Armored Vehicles Market was valued at USD 40.5 billion in 2025 and is estimated to grow at a CAGR of 3.7% to reach USD 59.3 billion by 2035.
Market expansion is being supported by rising defense preparedness amid geopolitical uncertainties, increasing investment in capability enhancement programs, and a stronger focus on internal security operations and asymmetric warfare threats. Demand is also strengthening as armored platforms are increasingly deployed beyond traditional military roles into internal protection and specialized security missions. Additionally, the need for highly protected mobility solutions in challenging and hostile terrains continues to reinforce procurement activity across defense forces globally. Ongoing fleet replacement programs, combined with modernization initiatives, are further accelerating the adoption of next-generation armored platforms designed for improved survivability, mobility, and mission versatility.
| Market Scope | |
|---|---|
| Start Year | 2025 |
| Forecast Year | 2026-2035 |
| Start Value | $40.5 Billion |
| Forecast Value | $59.3 Billion |
| CAGR | 3.7% |
The armored vehicles market is fueled by rising conflict intensity and persistent security threats, which are prompting governments to significantly raise defense allocations to safeguard ground forces. As regional conflicts intensify across multiple geographies, defense agencies are channeling higher investments into land-based combat systems to enhance troop protection and battlefield effectiveness. At the same time, government-led modernization initiatives are reshaping procurement priorities, with increased focus on replacing aging fleets and upgrading operational capabilities. These modernization programs emphasize improved protection systems, enhanced maneuverability, and higher combat readiness standards. Rising threat perceptions are further compelling governments to allocate larger capital budgets toward strengthening armored mobility infrastructure. As a result, sustained investment in fleet renewal and defense upgrades is playing a central role in driving long-term market expansion.
The unmanned armored ground vehicles segment is projected to grow at a CAGR of 10.1% during 2026 to 2035. Rising efforts to reduce battlefield risk for personnel and improve mission efficiency are accelerating the adoption of autonomous and remotely operated ground systems. Continuous advancements in artificial intelligence, sensor technologies, and command and control architectures are further strengthening the development and deployment of these unmanned platforms.
The tracked segment is expected to grow at a CAGR of 2.7% through 2035. Demand for these platforms is supported by their ability to operate effectively in difficult terrain and high-intensity combat environments. Their superior load-bearing capacity, enhanced protection levels, and strong battlefield stability make them highly suitable for frontline combat missions, thereby sustaining steady adoption across defense forces.
North America Armored Vehicles Market accounted for a 33.5% share in 2025. The region's growth is driven by continuous investment in modernization programs, capability upgrades, and readiness enhancement across land-based defense systems. Strong emphasis on operational mobility, survivability, and interoperability is sustaining demand for advanced armored platforms across multiple mission categories. Growth is further reinforced by a well-established defense manufacturing base and ongoing efforts to integrate advanced technologies into next-generation military vehicles.
Key companies operating in the Global Armored Vehicles Industry include Rheinmetall AG, General Dynamics Corporation, BAE Systems plc, Oshkosh Defense, LLC, Lockheed Martin Corporation, Hyundai Rotem Company, Hanwha Defense, KNDS (Krauss-Maffei Wegmann & Nexter Group), Iveco Defense Vehicles, Tata Advanced Systems Limited, Denel Vehicle Systems, NIMR Automotive LLC, Milrem Robotics, Arquus, Paramount Group, and ST Engineering Land Systems. Companies in the armored vehicles market are actively focusing on technological modernization, integrating advanced protection systems, AI-enabled situational awareness tools, and next-generation mobility platforms to enhance battlefield performance. They are strengthening partnerships with defense agencies to align product development with evolving military requirements and procurement standards. Manufacturers are also investing in unmanned and hybrid vehicle technologies to reduce troop exposure and improve operational efficiency. Expansion of domestic production capabilities and localization strategies is helping firms meet sovereign defense requirements while reducing supply chain risks.
Table of Contents
Chapter 1 Methodology and Scope
- 1.1 Market scope and definition
- 1.2 Research design
- 1.2.1 Research approach
- 1.2.2 Data collection methods
- 1.3 Data mining sources
- 1.3.1 Global
- 1.3.2 Regional/Country
- 1.4 Base estimates and calculations
- 1.4.1 Base year calculation
- 1.4.2 Key trends for market estimation
- 1.5 Primary research and validation
- 1.5.1 Primary sources
- 1.6 Forecast model
- 1.7 Research assumptions and limitations
Chapter 2 Executive Summary
- 2.1 Industry 360° synopsis, 2022 - 2035
- 2.2 Key market trends
- 2.2.1 Platform trends
- 2.2.2 Mobility trends
- 2.2.3 Propulsion trends
- 2.2.4 Solution type trends
- 2.2.5 Regional trends
- 2.3 TAM Analysis, 2026-2035
- 2.4 CXO perspectives: Strategic imperatives
Chapter 3 Industry Insights
- 3.1 Industry ecosystem analysis
- 3.1.1 Supplier Landscape
- 3.1.2 Profit Margin
- 3.1.3 Cost structure
- 3.1.4 Value addition at each stage
- 3.1.5 Factor affecting the value chain
- 3.1.6 Disruptions
- 3.2 Industry impact forces
- 3.2.1 Growth drivers
- 3.2.1.1 Escalating security threats and geopolitical conflicts
- 3.2.1.2 Rising government investments in defense modernization programs
- 3.2.1.3 Expansion of counter-terrorism and internal security operations
- 3.2.1.4 Growing need for commercial armored vehicles
- 3.2.1.5 Rising Urban Combat and Security Operations
- 3.2.2 Industry pitfalls and challenges
- 3.2.2.1 High acquisition and lifecycle costs of armored vehicles
- 3.2.2.2 Complex procurement and long development cycles
- 3.2.3 Market opportunities
- 3.2.3.1 Integration of autonomous and optionally manned armored vehicle technologies
- 3.2.3.2 Increasing focus on lightweight materials and mobility optimization
- 3.2.1 Growth drivers
- 3.3 Growth potential analysis
- 3.4 Regulatory landscape
- 3.4.1 North America
- 3.4.2 Europe
- 3.4.3 Asia Pacific
- 3.4.4 Latin America
- 3.4.5 Middle East & Africa
- 3.5 Porter’s analysis
- 3.6 PESTEL analysis
- 3.7 Technology and Innovation landscape
- 3.7.1 Current technological trends
- 3.7.2 Emerging technologies
- 3.8 Price trends
- 3.8.1 By region
- 3.8.2 By product
- 3.9 Pricing Strategies
- 3.10 Emerging Business Models
- 3.11 Compliance Requirements
- 3.12 Patent and IP analysis
Chapter 4 Competitive Landscape, 2025
- 4.1 Introduction
- 4.2 Company market share analysis
- 4.2.1 By region
- 4.2.1.1 North America
- 4.2.1.2 Europe
- 4.2.1.3 Asia Pacific
- 4.2.1.4 Latin America
- 4.2.1.5 Middle East & Africa
- 4.2.2 Market concentration analysis
- 4.2.1 By region
- 4.3 Competitive benchmarking of key players
- 4.3.1 Financial performance comparison
- 4.3.1.1 Revenue
- 4.3.1.2 Profit margin
- 4.3.1.3 R&D
- 4.3.2 Product portfolio comparison
- 4.3.2.1 Product range breadth
- 4.3.2.2 Technology
- 4.3.2.3 Innovation
- 4.3.3 Geographic presence comparison
- 4.3.3.1 Global footprint analysis
- 4.3.3.2 Service network coverage
- 4.3.3.3 Market penetration by region
- 4.3.4 Competitive positioning matrix
- 4.3.4.1 Leaders
- 4.3.4.2 Challengers
- 4.3.4.3 Followers
- 4.3.4.4 Niche players
- 4.3.5 Strategic outlook matrix
- 4.3.1 Financial performance comparison
- 4.4 Key developments
- 4.4.1 Mergers and acquisitions
- 4.4.2 Partnerships and collaborations
- 4.4.3 Technological advancements
- 4.4.4 Expansion and investment strategies
- 4.4.5 Digital transformation initiatives
- 4.5 Emerging/ startup competitors landscape
Chapter 5 Market Estimates and Forecast, By Platform, 2022 - 2035 (USD Million)
- 5.1 Key trends
- 5.2 Combat vehicles
- 5.3 Combat support vehicles
- 5.4 Unmanned armored ground vehicles
- 5.5 Civilian/commercial armored vehicles
Chapter 6 Market Estimates and Forecast, By Mobility, 2022 - 2035 (USD Million)
- 6.1 Key trends
- 6.2 Wheeled
- 6.3 Tracked
- 6.4 Others
Chapter 7 Market Estimates and Forecast, By Propulsion, 2022 - 2035 (USD Million)
- 7.1 Key trends
- 7.2 Conventional
- 7.3 Hybrid
- 7.4 Electric
- 7.5 Others
Chapter 8 Market Estimates and Forecast, By Solution Type, 2022 - 2035 (USD Million)
- 8.1 Key trends
- 8.2 Line Fit/OEM
- 8.3 Retrofit
Chapter 9 Market Estimates and Forecast, By Region, 2022 - 2035 (USD Million)
- 9.1 Key trends
- 9.2 North America
- 9.2.1 U.S.
- 9.2.2 Canada
- 9.3 Europe
- 9.3.1 Germany
- 9.3.2 UK
- 9.3.3 France
- 9.3.4 Spain
- 9.3.5 Italy
- 9.3.6 Russia
- 9.4 Asia Pacific
- 9.4.1 China
- 9.4.2 India
- 9.4.3 Japan
- 9.4.4 Australia
- 9.4.5 South Korea
- 9.5 Latin America
- 9.5.1 Brazil
- 9.5.2 Mexico
- 9.5.3 Argentina
- 9.6 Middle East and Africa
- 9.6.1 South Africa
- 9.6.2 Saudi Arabia
- 9.6.3 UAE
Chapter 10 Company Profiles
- 10.1 Global Key Players
- 10.1.1 BAE Systems plc
- 10.1.2 General Dynamics Corporation
- 10.1.3 Rheinmetall AG
- 10.1.4 Oshkosh Defense, LLC
- 10.1.5 Lockheed Martin Corporation
- 10.2 Regional key players
- 10.2.1 Asia Pacific
- 10.2.1.1 Hanwha Defense
- 10.2.1.2 Hyundai Rotem Company
- 10.2.1.3 Tata Advanced Systems Limited
- 10.2.1.4 ST Engineering Land Systems
- 10.2.2 Europe
- 10.2.2.1 KNDS (Krauss-Maffei Wegmann & Nexter Group)
- 10.2.2.2 Iveco Defense Vehicles
- 10.2.2.3 Arquus
- 10.2.3 Middle East & Africa
- 10.2.3.1 NIMR Automotive LLC
- 10.2.3.2 Denel Vehicle Systems
- 10.2.3.3 Paramount Group
- 10.2.1 Asia Pacific
- 10.3 Niche Players/Disruptors
- 10.3.1 Milrem Robotics
 裝甲車市場:全球市場預測,2026-2032年
 2026-2030年全球民用裝甲車市場
 2026-2030年全球裝甲車輛市場
 裝甲車輛:市場規模及預測(2021-2034 年)、全球及區域佔有率、趨勢和成長機會 - 分析範圍(按應用、技術和地區分類)
 全球裝甲車市場:2026-2036年
 裝甲車輛市場:按類型、作戰模式、系統和地區分類
 2026年全球裝甲救護車市場報告2026年全球裝甲車輛市場報告2026年全球防彈裝甲車市場報告
 裝甲車輛市場規模、佔有率、成長及全球產業分析:按類型、應用和地區分類-2026-2034年洞察與預測