


 |
市場調查報告書
商品編碼
2061477
PARP抑制劑生物標記市場:市場機會、成長要素、產業趨勢分析及2026-2035年預測PARP Inhibitor Biomarkers Market Opportunity, Growth Drivers, Industry Trend Analysis, and Forecast 2026 - 2035 |
||||||
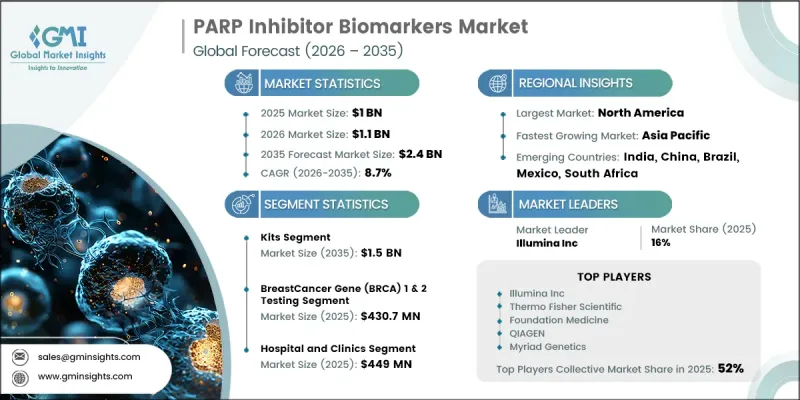
2025 年全球 PARP 抑制劑生物標記市場價值為 10 億美元,預計到 2035 年將以 8.7% 的複合年成長率成長至 24 億美元。
由於乳癌發病率上升、基因組研究快速發展以及全球對癌症治療投入的不斷增加,PARP抑制劑生物標記市場展現出強勁的成長勢頭。隨著醫療專業人員持續關注能夠提高治療效果和改善患者預後的標靶治療,PARP抑制劑生物標記在精準醫療中變得至關重要。分子診斷技術的進步使醫療專業人員能夠更精準地識別合格條件的患者,這也惠及了這個行業。人們對癌症早期檢測和個人化醫療的日益重視進一步推動了對基於生物標記的檢測解決方案的需求。此外,製藥公司和診斷設備製造商正在加強研發力度,開發能夠改善臨床決策的先進檢測技術。醫療基礎設施的擴張、伴隨診斷的日益普及以及對精準腫瘤解決方案需求的成長,都在加速市場發展。將先進的基因檢測整合到常規臨床工作流程中,以及對基於生物標記的治療方法的日益接受,預計將繼續塑造PARP抑制劑生物標記行業的長期前景。
| 市場範圍 | |
|---|---|
| 開始年份 | 2025 |
| 預測期 | 2026-2035 |
| 上市時的市場規模 | 10億美元 |
| 預計金額 | 24億美元 |
| 複合年成長率 | 8.7% |
PARP抑制劑生物標記是能夠幫助識別可能從PARP抑制劑治療中獲益的癌症患者的遺傳標記。這些生物標記廣泛應用於精準腫瘤學領域,以支持標靶治療策略並改善治療效果。全球乳癌負擔的不斷加重持續推動著對先進生物標記檢測解決方案的強勁需求。分子譜分析和新一代診斷技術的日益普及,進一步促進了患者篩選和治療方案製定的改進。此外,對個人化癌症治療的日益重視,也推動了基於生物標記的診斷方法在整個醫療保健系統中的應用。不斷上漲的癌症治療成本和先進治療方案的出現,也推動了市場擴張。隨著醫療服務提供者越來越重視高效的標靶治療,預計在預測期內,對PARP抑制劑生物標記的需求將穩定成長。
預計到2035年,試劑盒市場規模將達到15億美元,主要得益於醫院、研究機構和診斷檢查室的強勁需求。該市場持續成長的動力源於其便利性、標準化的工作流程以及簡化生物標記檢測程序的能力。即用型檢測套組降低了操作複雜性,同時縮短了周轉時間,提高了檢查室效率。其在臨床環境中的廣泛應用也推動了大規模篩檢和精準腫瘤學計畫的進展。此外,製造商不斷推出技術先進的試劑盒,旨在提高準確性、可靠性和工作流程相容性。自動化和方便用戶使用型解決方案的日益普及進一步鞏固了試劑盒在PARP抑制劑生物標記市場中的地位。
預計到2025年,乳癌基因(BRCA)1和2檢測市場規模將達到4.307億美元。 BRCA檢測在市場中佔據主導地位,因為它在識別適合接受靶向PARP抑制劑治療的患者方面發揮著至關重要的作用。這些檢測在臨床腫瘤學實踐中已廣泛應用,尤其適用於確診乳癌或卵巢癌的患者。基因篩檢計畫的日益普及以及臨床指引對BRCA檢測的支持力度不斷加大,正在加速這一市場的成長。此外,人們對遺傳性癌症風險的認知不斷提高,以及基因諮詢服務的普及,也促使更多人接受早期檢測。對精準診斷和早期治療性介入的日益重視,預計將進一步推動對BRCA 1和2檢測解決方案的需求。
預計到2025年,北美PARP抑制劑生物標記市場佔有率將達到40.7%。該地區市場正經歷強勁成長,主要受乳癌發病率上升和先進診斷技術日益普及的推動。該地區每年進行大量的癌症診斷,從而對基於生物標記的治療策略產生了顯著需求。人們對癌症篩檢和早期診斷計畫的日益重視也促進了醫療機構的檢測量增加。此外,與BRCA基因突變相關的遺傳性乳癌病例的增加也加速了PARP抑制劑生物標記檢測的應用。完善的醫療基礎設施、高額的醫療支出以及精準腫瘤學的不斷進步預計將支撐北美市場的持續擴張。
目錄
第1章:調查方法
第2章執行摘要
第3章 行業洞察
- 產業生態系分析
- 影響產業的因素
- 促進因素
- 乳癌發生率增加
- 基因組技術的進步
- 癌症治療費用增加
- 個人化醫療和精準醫療的普及
- 產業潛在風險與挑戰
- PARP抑制劑生物標記檢測套組和檢測方法高成本
- 對PARP抑制劑生物標記的認知與理解不足
- 市場機遇
- 液態生物檢體和基於ctDNA的檢測方法的擴展
- 促進因素
- 成長潛力分析
- 監理情勢
- 技術展望
- 最新科技趨勢
- 擴大伴隨診斷的整合
- 改進的多生物標記檢測板
- 新興技術
- 液態生物檢體和ctDNA檢測的興起
- 人工智慧與生物資訊學在基因組學中的融合
- 最新科技趨勢
- 未來市場趨勢
- 人工智慧和生成式人工智慧對市場的影響
- 價格趨勢分析
- 波特的分析
- PESTLE分析
第4章 競爭情勢
- 介紹
- 企業市佔率分析
- 世界
- 北美洲
- 歐洲
- 亞太地區
- 企業矩陣分析
- 主要市場公司的競爭分析
- 競爭定位矩陣
- 主要進展
- 併購
- 夥伴關係和聯盟
- 新產品發布
- 業務拓展計劃
第5章 市場估價與預測:依產品分類,2022-2035年
- 成套工具
- 偵測
第6章 市場估計與預測:依服務業分類,2022-2035年
- 乳癌基因(BRCA)1 和 2 檢測
- 同源重組缺陷(HRD)檢測
- 同源重組修復(HRR)檢測
- 其他服務
第7章 市場估計與預測:依技術分類,2022-2035年
- 次世代定序
- 聚合酵素鏈鎖反應
- 免疫組織化學
- 原位雜合反應
- 其他技術
第8章 市場估計與預測:依應用領域分類,2022-2035年
- 乳癌
- 卵巢癌
- 胰臟癌
- 攝護腺癌
- 其他用途
第9章 市場估計與預測:依最終用途分類,2022-2035年
- 醫院及不孕症治療診所
- 居家照護
- 其他最終用戶
第10章 市場估價與預測:依地區分類,2022-2035年
- 北美洲
- 美國
- 加拿大
- 歐洲
- 德國
- 英國
- 法國
- 西班牙
- 義大利
- 荷蘭
- 亞太地區
- 中國
- 日本
- 印度
- 澳洲
- 韓國
- 拉丁美洲
- 巴西
- 墨西哥
- 阿根廷
- 中東和非洲
- 南非
- 沙烏地阿拉伯
- UAE
第11章:公司簡介
- Agilent Technologies
- Ambry Genetics
- Amoy Diagnostics
- BPS Bioscience
- EntroGen
- Foundation Medicine
- Guardant Health
- Illumina Inc.
- Invitae
- Myriad Genetics
- Pillar Biosciences
- QIAGEN
- Thermo Fisher Scientific
The Global PARP Inhibitor Biomarkers Market was valued at USD 1 billion in 2025 and is estimated to grow at a CAGR of 8.7% to reach USD 2.4 billion by 2035.
The market is witnessing notable momentum due to the growing incidence of breast cancer, rapid progress in genomic research, and increasing investments in oncology treatment worldwide. PARP inhibitor biomarkers have become essential in precision medicine as healthcare providers continue focusing on targeted therapies that improve treatment effectiveness and patient outcomes. The industry is also benefiting from advancements in molecular diagnostics, which enable healthcare professionals to identify suitable patients with greater accuracy. Rising awareness regarding early cancer detection and personalized medicine is further supporting demand for biomarker-based testing solutions. In addition, pharmaceutical and diagnostic companies are strengthening research initiatives to develop advanced testing technologies that improve clinical decision-making. Expanding healthcare infrastructure, growing adoption of companion diagnostics, and increasing demand for precision oncology solutions are collectively accelerating market development. The integration of advanced genetic testing into routine clinical workflows, along with increasing acceptance of biomarker-guided therapies, is expected to continue shaping the long-term outlook of the PARP inhibitor biomarkers industry.
| Market Scope | |
|---|---|
| Start Year | 2025 |
| Forecast Year | 2026-2035 |
| Start Value | $1 Billion |
| Forecast Value | $2.4 Billion |
| CAGR | 8.7% |
PARP inhibitor biomarkers are genetic markers that help identify cancer patients who are more likely to benefit from PARP inhibitor therapies. These biomarkers are widely utilized in precision oncology to support targeted treatment strategies and improve therapeutic outcomes. The increasing burden of breast cancer worldwide continues to create strong demand for advanced biomarker testing solutions. Expanding use of molecular profiling and next-generation diagnostic technologies is further contributing to improved patient selection and treatment planning. In addition, the growing emphasis on personalized cancer care is driving the adoption of biomarker-based diagnostics across healthcare systems. Rising spending on cancer therapies and the growing availability of advanced treatment options are also strengthening market expansion. As healthcare providers increasingly prioritize targeted therapies with higher treatment efficiency, the demand for PARP inhibitor biomarkers is expected to rise steadily over the forecast period.
The kits segment is anticipated to reach USD 1.5 billion by 2035, supported by strong demand across hospitals, research facilities, and diagnostic laboratories. The segment continues to gain traction due to its convenience, standardized workflows, and ability to simplify biomarker testing procedures. Ready-to-use testing kits help reduce operational complexity while improving turnaround time and laboratory efficiency. Their broad adoption across clinical environments is also supporting large-scale screening and precision oncology programs. Furthermore, manufacturers are continuously introducing technologically advanced kits designed to deliver improved accuracy, reliability, and workflow compatibility. The increasing availability of automated and user-friendly solutions is further enhancing the position of the kits segment within the PARP inhibitor biomarkers market.
The breast cancer gene (BRCA) 1 & 2 testing segment generated USD 430.7 million in 2025. BRCA testing maintains a leading position in the market because of its critical role in identifying patients eligible for targeted PARP inhibitor therapies. These tests are widely incorporated into clinical oncology practices, particularly for patients diagnosed with breast and ovarian cancers. The growing acceptance of genetic screening programs and favorable clinical recommendations supporting BRCA testing are accelerating segment growth. In addition, rising awareness regarding hereditary cancer risks and increasing access to genetic counseling services are encouraging more individuals to undergo early-stage testing. The increasing focus on precision diagnostics and early treatment intervention is expected to further strengthen demand for BRCA 1 & 2 testing solutions.
North America PARP Inhibitor Biomarkers Market accounted for 40.7% share in 2025. The regional market is experiencing strong growth due to the rising prevalence of breast cancer and increasing adoption of advanced diagnostic technologies. The region records a substantial number of cancer diagnoses each year, creating significant demand for biomarker-driven treatment strategies. Greater awareness regarding cancer screening and early diagnosis programs is also contributing to higher testing volumes across healthcare institutions. Furthermore, the increasing occurrence of hereditary breast cancer cases linked to BRCA mutations is accelerating the adoption of PARP inhibitor biomarker testing. Strong healthcare infrastructure, high healthcare expenditure, and continued advancements in precision oncology are expected to support sustained market expansion across North America.
Prominent companies operating in the Global PARP Inhibitor Biomarkers Market include Agilent Technologies, Thermo Fisher Scientific, Foundation Medicine, Myriad Genetics, Illumina Inc., QIAGEN, Guardant Health, Invitae, Ambry Genetics, EntroGen, Amoy Diagnostics, BPS Bioscience, and Pillar Biosciences. Companies operating in the PARP inhibitor biomarkers market are implementing several strategic initiatives to strengthen their competitive positioning and expand market presence. Leading players are heavily investing in research and development activities to introduce advanced genomic testing technologies with improved sensitivity and accuracy. Strategic collaborations between pharmaceutical companies, diagnostic developers, and healthcare institutions are helping accelerate biomarker discovery and commercialization. Many organizations are also focusing on regulatory approvals and product launches to broaden their diagnostic portfolios and enhance clinical adoption. Expansion into emerging healthcare markets, increased investment in precision oncology infrastructure, and partnerships for companion diagnostic development are further supporting business growth.
Table of Contents
Chapter 1 Research Methodology
- 1.1 Research approach
- 1.2 Quality commitments
- 1.2.1 GMI AI policy & data integrity commitment
- 1.2.1.1 Source consistency protocol
- 1.2.1 GMI AI policy & data integrity commitment
- 1.3 Research trail & confidence scoring
- 1.3.1 Research trail components
- 1.3.2 Scoring components
- 1.4 Data collection
- 1.4.1 Partial list of primary sources
- 1.5 Data mining sources
- 1.5.1 Paid sources
- 1.5.1.1 Sources, by region
- 1.5.1 Paid sources
- 1.6 Base estimates and calculations
- 1.6.1 Base year calculation for any one approach
- 1.7 Forecast model
- 1.7.1 Quantified market impact analysis
- 1.7.1.1 Mathematical impact of growth parameters on forecast
- 1.7.1 Quantified market impact analysis
- 1.8 Research transparency addendum
- 1.8.1 Source attribution framework
- 1.8.2 Quality assurance metrics
- 1.8.3 Our commitment to trust
Chapter 2 Executive Summary
- 2.1 Industry 3600 synopsis
- 2.2 Key market trends
- 2.2.1 Product trends
- 2.2.2 Service trends
- 2.2.3 Technology trends
- 2.2.4 Application trends
- 2.2.5 End use trends
- 2.2.6 Regional trends
- 2.3 CXO perspectives: Strategic imperatives
Chapter 3 Industry Insights
- 3.1 Industry ecosystem analysis
- 3.2 Industry impact forces
- 3.2.1 Growth drivers
- 3.2.1.1 Increasing prevalence of breast cancer
- 3.2.1.2 Advancements in genomic technologies
- 3.2.1.3 Rising expenditure for cancer treatment
- 3.2.1.4 Growing adoption of personalized medicine and precision therapy
- 3.2.2 Industry pitfalls and challenges
- 3.2.2.1 High cost of PARP inhibitor biomarker test kits and assays
- 3.2.2.2 Limited awareness and understanding of PARP inhibitor biomarkers
- 3.2.3 Market opportunities
- 3.2.3.1 Liquid biopsy & ctDNA-based testing expansion
- 3.2.1 Growth drivers
- 3.3 Growth potential analysis
- 3.4 Regulatory landscape (Driven by primary research)
- 3.4.1 North America
- 3.4.2 Europe
- 3.4.3 Asia Pacific
- 3.4.4 Latin America
- 3.4.5 Middle East and Africa
- 3.5 Technology landscape (Driven by primary research)
- 3.5.1 Current technological trends
- 3.5.1.1 Expansion of companion diagnostics integration
- 3.5.1.2 Improved multiplex biomarker panels
- 3.5.2 Emerging technologies
- 3.5.2.1 Rise of liquid biopsy and ctDNA testing
- 3.5.2.2 Integration of AI and bioinformatics in genomics
- 3.5.1 Current technological trends
- 3.6 Future market trends (Driven by primary research)
- 3.7 Impact of AI and Generative AI on the market (Driven by primary research)
- 3.8 Pricing trend analysis (Driven by primary research)
- 3.9 Porter's analysis
- 3.10 PESTEL analysis
Chapter 4 Competitive Landscape, 2025
- 4.1 Introduction
- 4.2 Company market share analysis
- 4.2.1 Global
- 4.2.2 North America
- 4.2.3 Europe
- 4.2.4 Asia Pacific
- 4.3 Company matrix analysis
- 4.4 Competitive analysis of major market players
- 4.5 Competitive positioning matrix
- 4.6 Key developments
- 4.6.1 Mergers and acquisitions
- 4.6.2 Partnerships and collaborations
- 4.6.3 New product launches
- 4.6.4 Expansion plans
Chapter 5 Market Estimates and Forecast, By Product, 2022 - 2035 ($ Mn)
- 5.1 Key trends
- 5.2 Kits
- 5.3 Assays
Chapter 6 Market Estimates and Forecast, By Service, 2022 - 2035 ($ Mn)
- 6.1 Key trends
- 6.2 Breast cancer gene (BRCA) 1 & 2 testing
- 6.3 Homologous recombination deficiency (HRD) testing
- 6.4 Homologous recombination repair (HRR) testing
- 6.5 Other services
Chapter 7 Market Estimates and Forecast, By Technology, 2022 - 2035 ($ Mn)
- 7.1 Key trends
- 7.2 Next-generation sequencing
- 7.3 Polymerase Chain Reaction
- 7.4 Immunohistochemistry
- 7.5 In situ hybridization
- 7.6 other technologies
Chapter 8 Market Estimates and Forecast, By Application, 2022 - 2035 ($ Mn)
- 8.1 Key trends
- 8.2 Breast cancer
- 8.3 Ovarian cancer
- 8.4 Pancreatic cancer
- 8.5 Prostate cancer
- 8.6 Other applications
Chapter 9 Market Estimates and Forecast, By End Use, 2022 - 2035 ($ Mn)
- 9.1 Key trends
- 9.2 Hospitals and fertility clinics
- 9.3 Home care
- 9.4 Other end users
Chapter 10 Market Estimates and Forecast, By Region, 2022 - 2035 ($ Mn)
- 10.1 Key trends
- 10.2 North America
- 10.2.1 U.S.
- 10.2.2 Canada
- 10.3 Europe
- 10.3.1 Germany
- 10.3.2 UK
- 10.3.3 France
- 10.3.4 Spain
- 10.3.5 Italy
- 10.3.6 Netherlands
- 10.4 Asia Pacific
- 10.4.1 China
- 10.4.2 Japan
- 10.4.3 India
- 10.4.4 Australia
- 10.4.5 South Korea
- 10.5 Latin America
- 10.5.1 Brazil
- 10.5.2 Mexico
- 10.5.3 Argentina
- 10.6 Middle East and Africa
- 10.6.1 South Africa
- 10.6.2 Saudi Arabia
- 10.6.3 UAE
Chapter 11 Company Profiles
- 11.1 Agilent Technologies
- 11.2 Ambry Genetics
- 11.3 Amoy Diagnostics
- 11.4 BPS Bioscience
- 11.5 EntroGen
- 11.6 Foundation Medicine
- 11.7 Guardant Health
- 11.8 Illumina Inc.
- 11.9 Invitae
- 11.10 Myriad Genetics
- 11.11 Pillar Biosciences
- 11.12 QIAGEN
- 11.13 Thermo Fisher Scientific
 全球PARP抑制劑生物標記市場規模、佔有率、趨勢和成長分析報告(2026-2034年)
 PARP抑制劑生物標記市場-全球產業規模、佔有率、趨勢、機會、預測:按產品、服務、應用、地區和競爭對手分類,2021-2031年