


 |
市場調查報告書
商品編碼
2061465
2026 年至 2035 年多層 C-UAS 架構的市場機會、成長要素、產業趨勢分析與預測。Layered C-UAS Architecture Market Opportunity, Growth Drivers, Industry Trend Analysis, and Forecast 2026 - 2035 |
||||||
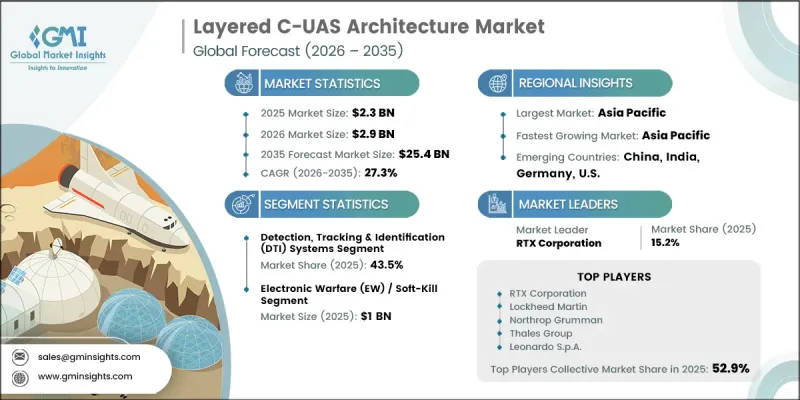
全球多層 C-UAS 架構市場預計到 2025 年價值 23 億美元,預計到 2035 年將達到 254 億美元,複合年成長率為 27.3%。
多層反無人機系統(C-UAS)架構產業的擴張,源自於無人機威脅日益複雜化、頻繁出現和多樣化,這需要全面的防禦策略而非孤立的措施。負責保護敏感資產的機構正擴大採用能夠支援全方位探測、追蹤、識別和回應能力的整合系統。國防機構、關鍵基礎設施和公共部門營運中不斷提高的安全需求,進一步加速了市場成長。此外,對國防安全保障計畫和國防現代化舉措的持續投入,也催生了對先進反無人機技術的強勁需求。感測器網路、指揮控制平台和資料處理能力的進步,也提升了多層防禦架構的有效性和可靠性。隨著威脅情勢日益複雜,各機構優先考慮擴充性且互通性的解決方案,以應對多種威脅場景,同時保持運作效率。隨著各國政府和安全機構不斷加強其空域保護能力,這些因素表明,多層反無人機系統(C-UAS)架構市場有望實現顯著的長期成長。
| 市場範圍 | |
|---|---|
| 開始年份 | 2025 |
| 預測期 | 2026-2035 |
| 上市時的市場規模 | 23億美元 |
| 預計金額 | 254億美元 |
| 複合年成長率 | 27.3% |
隨著無人機威脅的不斷演變,對能夠應對各種作戰挑戰的整合防禦框架的需求日益成長,多層反無人機(C-UAS)架構市場正蓬勃發展。先進無人機技術的日益普及凸顯了孤立響應系統的局限性,推動了旨在提升情境察覺和協同威脅響應的多層架構的採用。政府對國家安全的日益重視、國防費用的增加以及安全機構間合作的加強,都促進了綜合反無人機解決方案的廣泛部署。同時,感測器技術、指揮控制系統和互通性的進步,正在提升作戰性能,並增強多層防禦網路的效能。
預計在預測期內,指揮控制與資料整合(C2/DF)平台細分市場將以29.3%的複合年成長率成長。這一成長主要受現代無人機系統(UAS)環境日益複雜以及整合來自多個探測和響應系統的資訊需求不斷成長的驅動。隨著多層防禦架構日益複雜,各組織正在投資於集中式平台,以支援即時資訊處理、自動化決策支援以及跨多個作戰層的協同響應。這些能力對於提升情境察覺和增強系統整體效能至關重要。
混合與整合系統領域預計在2026年至2035年間將達到28.1%的複合年成長率。該領域的成長主要得益於對能夠在各種環境下運作的靈活、適應性強的無人機系統解決方案日益成長的需求。日益複雜的空中威脅場景正在推動採用在統一作戰框架下整合多層防禦的架構。透過集中式管理系統協調固定資產和可部署資產的能力提高了回應效率,並推動了其在國防和安全領域的更廣泛應用。
預計到2025年,北美多層反無人機系統架構市場將佔據31.4%的佔有率。該地區的成長主要得益於國防安全保障、空域保護、邊境監控和關鍵基礎設施防禦等相關領域日益成長的優先事項。對未經授權的空中活動的擔憂日益加劇,推動了對能夠在各種運行環境下提供全面保護的先進反無人機系統解決方案的需求成長。政府的大量投資、大規模的國防現代化項目以及加強的聯邦間合作,進一步促進了全部區域多層反無人機系統架構的採用。這些因素進一步鞏固了北美作為先進空域安全技術領先市場的地位。
目錄
第1章:調查方法和範圍
第2章執行摘要
第3章 行業洞察
- 產業生態系分析
- 供應商情況
- 利潤率
- 成本結構
- 每個階段增加的價值
- 影響價值鏈的因素
- 中斷
- 影響產業的因素
- 促進因素
- 無人機威脅的頻率和複雜性。
- 向一體化網路化防禦系統過渡
- 關鍵基礎設施保護需求不斷提高
- 國防和國防安全保障支出增加
- 感測器融合與指揮控制技術的進步
- 產業潛在風險與挑戰
- 監管複雜性和營運限制
- 系統整合成本高且技術複雜
- 市場機遇
- 在商業和民用空域實施安全措施
- 與盟友的出口潛力及國防合作項目
- 促進因素
- 成長潛力分析
- 監理情勢
- 北美洲
- 歐洲
- 亞太地區
- 拉丁美洲
- 中東和非洲
- 波特的分析
- PESTLE分析
- 技術與創新展望
- 最新科技趨勢
- 新興技術
- 價格趨勢
- 按地區
- 依產品
- 定價策略
- 新興經營模式
- 合規要求
- 專利和智慧財產權分析
第4章 競爭情勢
- 介紹
- 企業市佔率分析
- 按地區
- 北美洲
- 歐洲
- 亞太地區
- 拉丁美洲
- 中東和非洲
- 市場集中度分析
- 按地區
- 主要公司的競爭標竿分析
- 財務績效比較
- 收入
- 利潤率
- R&D
- 產品系列比較
- 產品線寬度
- 科技
- 創新
- 區域擴張比較
- 全球擴張分析
- 服務網路覆蓋
- 按地區分類的市場滲透率
- 競爭定位矩陣
- 領導者
- 挑戰者
- 追蹤者
- 小眾玩家
- 戰略展望矩陣
- 財務績效比較
- 主要進展
- 併購
- 夥伴關係和聯盟
- 技術進步
- 擴張和投資策略
- 數位轉型計劃
- 新興企業競爭公司和新創企業的發展趨勢
第5章 市場估計與預測:依組件類型分類,2022-2035年
- 檢測、追蹤和識別(DTI)系統
- 指揮控制與資料融合(C2/DF)平台
- 緩解/中和系統
第6章 市場估算與預測:依緩解技術類型分類,2022-2035年
- 動態/物理排毒
- 電子戰/軟殺傷
- 定向能武器(DE)/硬殺傷
第7章 市場估算與預測:依部署架構分類,2022-2035年
- 固定/靜態系統
- 行動/可攜式系統
- 混合/整合系統
第8章 市場估算與預測:依最終使用者分類,2022-2035年
- 軍事和國防組織
- 政府安全和邊境管制機構
- 關鍵基礎設施營運商
- 機場/航空當局
- 商業/私部門
第9章 市場估計與預測:依地區分類,2022-2035年
- 北美洲
- 美國
- 加拿大
- 歐洲
- 德國
- 英國
- 法國
- 西班牙
- 義大利
- 俄羅斯
- 亞太地區
- 中國
- 印度
- 日本
- 澳洲
- 韓國
- 拉丁美洲
- 巴西
- 墨西哥
- 阿根廷
- 中東和非洲
- 南非
- 沙烏地阿拉伯
- UAE
第10章:公司簡介
- 全球主要公司
- RTX Corporation
- Lockheed Martin
- Northrop Grumman
- Thales Group
- Leonardo SpA
- 該地區的主要公司
- 北美洲
- L3Harris Technologies
- Anduril Industries
- 歐洲
- BAE Systems
- Saab AB
- Rheinmetall AG
- Middle East &Africa
- Israel Aerospace Industries
- Rafael Advanced Defense Systems
- Elbit Systems
- 北美洲
- 小眾玩家/顛覆者
- DroneShield
- Dedrone
The Global Layered C-UAS Architecture Market was valued at USD 2.3 billion in 2025 and is estimated to grow at a CAGR of 27.3% to reach USD 25.4 billion by 2035.
Expansion of the layered C-UAS architecture industry is driven by the growing sophistication, frequency, and diversity of unmanned aerial threats that require comprehensive defense strategies rather than standalone countermeasures. Organizations responsible for protecting sensitive assets are increasingly adopting integrated systems capable of supporting the full spectrum of detection, tracking, identification, and mitigation functions. Rising security requirements across defense establishments, critical infrastructure facilities, and public-sector operations are further accelerating market growth. In addition, continued investments in homeland security programs and defense modernization initiatives are creating strong demand for advanced counter-drone technologies. Technological advancements in sensor networks, command-and-control platforms, and data processing capabilities are also improving the effectiveness and reliability of layered defense architectures. As threat environments become more complex, organizations are prioritizing scalable and interoperable solutions that can respond to multiple threat scenarios while maintaining operational efficiency. These factors are positioning the layered C-UAS architecture market for substantial long-term expansion as governments and security organizations continue strengthening airspace protection capabilities.
| Market Scope | |
|---|---|
| Start Year | 2025 |
| Forecast Year | 2026-2035 |
| Start Value | $2.3 Billion |
| Forecast Value | $25.4 Billion |
| CAGR | 27.3% |
The layered C-UAS architecture market is gaining momentum as evolving unmanned aerial threats create increasing demand for integrated defense frameworks capable of addressing a broad range of operational challenges. The growing use of advanced drone technologies has highlighted the limitations of isolated countermeasure systems, prompting greater adoption of multi-layered architectures designed to provide enhanced situational awareness and coordinated threat response. Increased government focus on national security, rising defense expenditures, and stronger collaboration among security agencies are contributing to the broader implementation of comprehensive counter-UAS solutions. At the same time, advancements in sensor technologies, command-and-control systems, and interoperability capabilities are improving operational performance and strengthening the effectiveness of layered defense networks.
The command, control, and data fusion (C2/DF) platforms segment is projected to grow at a CAGR of 29.3% throughout the forecast period. Growth within this segment is driven by the increasing complexity of modern counter-UAS environments and the growing requirement to integrate information from multiple detection and mitigation systems. As layered defense architectures become more sophisticated, organizations are investing in centralized platforms that support real-time information processing, automated decision support, and coordinated responses across multiple operational layers. These capabilities are becoming essential for improving situational awareness and enhancing overall system performance.
The hybrid and integrated systems segment is anticipated to register a CAGR of 28.1% during 2026-2035. Segment growth is supported by the rising need for flexible and adaptive counter-UAS solutions capable of operating across diverse environments. Increasingly advanced aerial threat scenarios are encouraging adoption of integrated architectures that combine multiple defense layers under a unified operational framework. The ability to coordinate fixed and deployable assets through centralized management systems is improving response effectiveness and supporting wider adoption across defense and security applications.
North America Layered C-UAS Architecture Market accounted for 31.4% share in 2025. Regional growth is driven by heightened priorities surrounding homeland security, airspace protection, border monitoring, and critical infrastructure defense. Growing concerns related to unauthorized aerial activity have increased demand for advanced counter-UAS solutions capable of providing comprehensive protection across a range of operational environments. Significant government investments, large-scale defense modernization programs, and enhanced coordination among federal agencies are further supporting the adoption of layered counter-UAS architectures throughout the region. These factors continue to strengthen North America's position as a key market for advanced airspace security technologies.
Major companies operating in the Global Layered C-UAS Architecture Industry include RTX Corporation, Lockheed Martin, Northrop Grumman, Thales Group, Leonardo S.p.A., Israel Aerospace Industries, Rafael Advanced Defense Systems, BAE Systems, Saab AB, Elbit Systems, Rheinmetall AG, L3Harris Technologies, Anduril Industries, DroneShield, and Dedrone. Companies competing in the layered C-UAS architecture market are implementing a variety of strategies to strengthen their market position and expand their competitive advantage. Significant investments in research and development are enabling organizations to enhance threat detection accuracy, improve sensor integration capabilities, and develop more advanced command-and-control platforms. Strategic collaborations with defense agencies, technology providers, and security organizations are accelerating innovation and expanding deployment opportunities. Market participants are also focusing on developing scalable and interoperable solutions capable of addressing evolving aerial threat environments. Portfolio expansion through acquisitions, technology partnerships, and product diversification remains a key growth strategy. In addition, companies are emphasizing artificial intelligence integration, real-time data analytics, and autonomous response capabilities to improve operational effectiveness, strengthen customer value propositions, and secure a stronger foothold within the rapidly growing layered C-UAS architecture market.
Table of Contents
Chapter 1 Methodology and Scope
- 1.1 Market scope and definition
- 1.2 Research design
- 1.2.1 Research approach
- 1.2.2 Data collection methods
- 1.3 Data mining sources
- 1.3.1 Global
- 1.3.2 Regional/Country
- 1.4 Base estimates and calculations
- 1.4.1 Base year calculation
- 1.4.2 Key trends for market estimation
- 1.5 Primary research and validation
- 1.5.1 Primary sources
- 1.6 Forecast model
- 1.7 Research assumptions and limitations
Chapter 2 Executive Summary
- 2.1 Industry 360° synopsis, 2022 - 2035
- 2.2 Key market trends
- 2.2.1 Component type trends
- 2.2.2 Mitigation technology type trends
- 2.2.3 Deployment architecture trends
- 2.2.4 End-User trends
- 2.2.5 Regional trends
- 2.3 TAM Analysis, 2026-2035
- 2.4 CXO perspectives: Strategic imperatives
Chapter 3 Industry Insights
- 3.1 Industry ecosystem analysis
- 3.1.1 Supplier Landscape
- 3.1.2 Profit Margin
- 3.1.3 Cost structure
- 3.1.4 Value addition at each stage
- 3.1.5 Factor affecting the value chain
- 3.1.6 Disruptions
- 3.2 Industry impact forces
- 3.2.1 Growth drivers
- 3.2.1.1 Rising frequency and complexity of drone threats
- 3.2.1.2 Shift toward integrated and networked defense systems
- 3.2.1.3 Growing protection requirements for critical infrastructure
- 3.2.1.4 Increased defense and homeland security spending
- 3.2.1.5 Advancements in sensor fusion and command-and-control technologies
- 3.2.2 Industry pitfalls and challenges
- 3.2.2.1 Regulatory complexity and operational restrictions
- 3.2.2.2 High system integration cost and technical complexity
- 3.2.3 Market opportunities
- 3.2.3.1 Commercial and civilian airspace security adoption
- 3.2.3.2 Export potential and allied defense collaboration programs
- 3.2.1 Growth drivers
- 3.3 Growth potential analysis
- 3.4 Regulatory landscape
- 3.4.1 North America
- 3.4.2 Europe
- 3.4.3 Asia Pacific
- 3.4.4 Latin America
- 3.4.5 Middle East & Africa
- 3.5 Porter’s analysis
- 3.6 PESTEL analysis
- 3.7 Technology and Innovation landscape
- 3.7.1 Current technological trends
- 3.7.2 Emerging technologies
- 3.8 Price trends
- 3.8.1 By region
- 3.8.2 By product
- 3.9 Pricing Strategies
- 3.10 Emerging Business Models
- 3.11 Compliance Requirements
- 3.12 Patent and IP analysis
Chapter 4 Competitive Landscape, 2025
- 4.1 Introduction
- 4.2 Company market share analysis
- 4.2.1 By region
- 4.2.1.1 North America
- 4.2.1.2 Europe
- 4.2.1.3 Asia Pacific
- 4.2.1.4 Latin America
- 4.2.1.5 Middle East & Africa
- 4.2.2 Market concentration analysis
- 4.2.1 By region
- 4.3 Competitive benchmarking of key players
- 4.3.1 Financial performance comparison
- 4.3.1.1 Revenue
- 4.3.1.2 Profit margin
- 4.3.1.3 R&D
- 4.3.2 Product portfolio comparison
- 4.3.2.1 Product range breadth
- 4.3.2.2 Technology
- 4.3.2.3 Innovation
- 4.3.3 Geographic presence comparison
- 4.3.3.1 Global footprint analysis
- 4.3.3.2 Service network coverage
- 4.3.3.3 Market penetration by region
- 4.3.4 Competitive positioning matrix
- 4.3.4.1 Leaders
- 4.3.4.2 Challengers
- 4.3.4.3 Followers
- 4.3.4.4 Niche players
- 4.3.5 Strategic outlook matrix
- 4.3.1 Financial performance comparison
- 4.4 Key developments
- 4.4.1 Mergers and acquisitions
- 4.4.2 Partnerships and collaborations
- 4.4.3 Technological advancements
- 4.4.4 Expansion and investment strategies
- 4.4.5 Digital transformation initiatives
- 4.5 Emerging/ startup competitors landscape
Chapter 5 Market Estimates and Forecast, By Component Type, 2022 - 2035 (USD Million)
- 5.1 Key trends
- 5.2 Detection, tracking & identification (DTI) systems
- 5.3 Command, control & data fusion (C2/DF) platforms
- 5.4 Mitigation & neutralization systems
Chapter 6 Market Estimates and Forecast, By Mitigation Technology Type, 2022 - 2035 (USD Million)
- 6.1 Key trends
- 6.2 Kinetic/physical neutralization
- 6.3 Electronic warfare (EW) / soft-kill
- 6.4 Directed energy (DE) / hard-kill
Chapter 7 Market Estimates and Forecast, By Deployment Architecture, 2022 - 2035 (USD Million)
- 7.1 Key trends
- 7.2 Fixed / static systems
- 7.3 Mobile / portable systems
- 7.4 Hybrid / integrated systems
Chapter 8 Market Estimates and Forecast, By End-User, 2022 - 2035 (USD Million)
- 8.1 Key trends
- 8.2 Military & defense forces
- 8.3 Government security & border agencies
- 8.4 Critical infrastructure operators
- 8.5 Airport & aviation authorities
- 8.6 Commercial & private sector
Chapter 9 Market Estimates and Forecast, By Region, 2022 - 2035 (USD Million)
- 9.1 Key trends
- 9.2 North America
- 9.2.1 U.S.
- 9.2.2 Canada
- 9.3 Europe
- 9.3.1 Germany
- 9.3.2 UK
- 9.3.3 France
- 9.3.4 Spain
- 9.3.5 Italy
- 9.3.6 Russia
- 9.4 Asia Pacific
- 9.4.1 China
- 9.4.2 India
- 9.4.3 Japan
- 9.4.4 Australia
- 9.4.5 South Korea
- 9.5 Latin America
- 9.5.1 Brazil
- 9.5.2 Mexico
- 9.5.3 Argentina
- 9.6 Middle East and Africa
- 9.6.1 South Africa
- 9.6.2 Saudi Arabia
- 9.6.3 UAE
Chapter 10 Company Profiles
- 10.1 Global Key Players
- 10.1.1 RTX Corporation
- 10.1.2 Lockheed Martin
- 10.1.3 Northrop Grumman
- 10.1.4 Thales Group
- 10.1.5 Leonardo S.p.A.
- 10.2 Regional key players
- 10.2.1 North America
- 10.2.1.1 L3Harris Technologies
- 10.2.1.2 Anduril Industries
- 10.2.2 Europe
- 10.2.2.1 BAE Systems
- 10.2.2.2 Saab AB
- 10.2.2.3 Rheinmetall AG
- 10.2.3 Middle East & Africa
- 10.2.3.1 Israel Aerospace Industries
- 10.2.3.2 Rafael Advanced Defense Systems
- 10.2.3.3 Elbit Systems
- 10.2.1 North America
- 10.3 Niche Players/Disruptors
- 10.3.1 DroneShield
- 10.3.2 Dedrone
 2026-2034年多層反無人機系統架構全球市場規模、佔有率、趨勢與成長分析報告
 2026年全球無人機及無人駕駛航空器系統(UAS)技術市場報告
 軍用反無人機系統(C-UAS):市場與技術預測(至2034年)
 無人機反制措施市場報告:趨勢、預測及競爭分析(至2035年)2026年全球無人機系統(UAS)市場報告2026年全球高能量微波C型無人機系統(UAS)市場報告高功率微波(HPM)與無人機系統(UAS)全球市場報告(2026年)
 無人機系統市場:按組件、技術、航程、部署方式、平台類型、應用和最終用戶分類-2026-2032年全球預測機場反無人機系統市場按功能、產品類型、平台和應用分類,全球預測(2026-2032年)
 計數器UAS的全球市場,各終端用戶,各技術,系統配置,各地區,機會,預測,2018年~2032年