


 |
市場調查報告書
商品編碼
2061447
二手曳引機市場機會、成長要素、產業趨勢分析及2026-2035年預測Used Tractors Market Opportunity, Growth Drivers, Industry Trend Analysis, and Forecast 2026 - 2035 |
||||||

預計到 2025 年,全球二手曳引機市場價值將達到 354 億美元,並預計以 5.1% 的複合年成長率成長,到 2035 年達到 586 億美元。
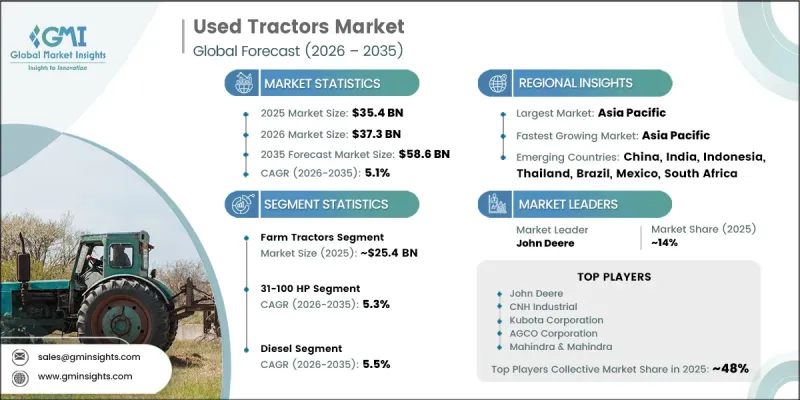
對農業機械化和經濟高效耕作解決方案日益成長的需求持續支撐著全球市場的穩定擴張。農民擴大採用機械化設備來提高生產力、減少對勞動力的依賴、縮短工時並提高整體耕作效率。二手曳引機正成為新機械的經濟替代品,尤其對於尋求經濟實惠的機械化解決方案的中小農戶而言更是如此。政府為促進農業現代化和獎勵採用農業機械而採取的支持措施也對市場產生了積極影響。全球人口成長帶來的糧食增產壓力進一步加劇了對高效農場管理和提高耕作效率的需求。在土地利用競爭日益激烈的背景下,農民擴大投資於可靠且價格合理的二手曳引機,以最佳化田間作業並降低營運成本。擴大分銷網路、提高修復標準以及增加線上市場管道也有助於提高市場滲透率,並增加已開發國家和開發中國家農業經濟體的客戶獲取管道。
| 市場範圍 | |
|---|---|
| 開始年份 | 2025 |
| 預測期 | 2026-2035 |
| 上市時的市場規模 | 354億美元 |
| 預測金額 | 586億美元 |
| 複合年成長率 | 5.1% |
預計到2025年,農業曳引機市場規模將達到254億美元,並在2026年至2035年間以5.5%的複合年成長率成長。由於曳引機仍然是二手農業管理中不可或缺的設備,因此該細分市場將繼續推動市場成長。二手農業曳引機廣泛應用於犁地、播種、收割和物料運輸等作業。尤其是在價格敏感的農業市場中,農民越來越傾向於選擇二手,將其作為新機械的經濟實惠的替代方案。此外,不同馬力等級和設備配置的曳引機也讓農民能夠根據自身的工作需求、農場規模和作物種植要求選擇合適的曳引機。
預計到2025年,31-100馬力細分市場的佔有率將達到40.2%,並在2035年之前以5.3%的複合年成長率成長。該馬力範圍內的曳引機因其多功能性以及對中小型農業應用的適用性而備受青睞。這些曳引機在燃油效率、動力輸出、維護成本和整體運作性能之間實現了有效的平衡。由於價格適中、功能廣泛且能夠很好地適應各種耕作條件和附件,該類別的曳引機持續受到農民的歡迎。
美國二手曳引機市場預計到2025年將達到92億美元,並在2026年至2035年間維持5.8%的複合年成長率。美國市場成長的促進因素包括大規模農業經營、完善的農業基礎設施以及商業農業經營者持續的機械更新換代週期。經銷商網路、競標系統和數位化設備交易平台上的大量優質二手曳引機進一步刺激了市場活躍度,並使客戶能夠獲得價格合理的機械解決方案。
目錄
第1章:調查方法和範圍
第2章執行摘要
第3章 行業洞察
- 產業生態系分析
- 供應商情況
- 利潤率
- 每個階段增加的價值
- 影響價值鏈的因素
- 影響產業的因素
- 促進因素
- 租賃模式的廣泛應用
- 新興農業市場機械化進展
- 線上平台和數位市場的擴張
- 產業潛在風險與挑戰
- 價格波動和市場不可預測性
- 對品質保證和設備可靠性的擔憂
- 機會
- 擴大永續曳引機和電動曳引機的使用範圍
- 在新興市場拓展業務和農村地區實現機械化
- 促進因素
- 成長潛力分析
- 價格波動和市場不確定性
- 對品質保證和設備可靠性的擔憂
- 未來市場趨勢
- 技術與創新展望
- 最新科技趨勢
- 新興技術
- 價格分析
- 對過去價格趨勢的分析
- 依球員類型分類的定價策略(高級球員、超值球員、成本加成球員)
- 監理情勢
- 標準和合規要求
- 區域監理框架
- 認證標準
- 波特的分析
- PESTLE分析
- 貿易數據分析
- 進出口量及進口額趨勢
- 主要貿易路線及關稅的影響
- HS編碼分類及貿易流量分析
- 人工智慧和生成式人工智慧對市場的影響
- 利用人工智慧改造現有經營模式
- 按細分市場分類的生成式人工智慧用例和部署藍圖
- 風險、限制和監管考量
- 再生能力和經銷商基礎設施
- 各地區及主要公司的再生能力
- 經銷商網路密度與競標處理能力分析
第4章 競爭情勢
- 介紹
- 企業市佔率分析
- 按地區
- 企業矩陣分析
- 主要市場公司的競爭分析
- 競爭定位矩陣
- 主要進展
- 併購
- 夥伴關係和聯盟
- 新產品發布
- 業務拓展計劃
第5章 市場估計與預測:依類型分類,2022-2035年
- 農用曳引機
- 小型多用途曳引機
- 小型多用途曳引機
- 特種曳引機
- 建築用曳引機
- 園圃曳引機
第6章 市場估計與預測:依馬力分類,2022-2035年
- 不到30馬力
- 31-100馬力
- 101-200馬力
- 超過200馬力
第7章 市場估算與預測:依燃料類型分類,2022-2035年
- 柴油引擎
- 汽油
- 其他(例如,壓縮天然氣、液化石油氣)
第8章 市場估算與預測:依最終使用者分類,2022-2035年
- 個人所有者
- 住宅
- 商業
第9章 市場估價與預測:依通路分類,2022-2035年
- 零售商
- 競標
- 私人銷售
- 線上平台
第10章 市場估價與預測:依地區分類,2022-2035年
- 北美洲
- 美國
- 加拿大
- 歐洲
- 德國
- 英國
- 法國
- 義大利
- 西班牙
- 亞太地區
- 中國
- 日本
- 印度
- 澳洲
- 韓國
- 拉丁美洲
- 巴西
- 墨西哥
- 阿根廷
- 中東和非洲
- 南非
- 沙烏地阿拉伯
- UAE
第11章:公司簡介
- Top Global Player
- John Deere
- CNH Industrial
- Kubota Corporation
- AGCO Corporation
- Mahindra & Mahindra
- Claas Group
- Massey Ferguson
- Escorts Kubota
- Yanmar
- Regional Player
- Sonalika
- LS Mtron
- Kioti
- Argo Tractors
- SDF Group
- Valtra
- Belarus
- TYM Tractors
- 新興企業
- Lovol
- Foton Tractors
- Powertrac
- Dongfeng Agricultural
The Global Used Tractors Market was valued at USD 35.4 billion in 2025 and is estimated to grow at a CAGR of 5.1% to reach USD 58.6 billion by 2035.
Rising demand for agricultural mechanization and cost-efficient farming solutions continues to support steady expansion of the market worldwide. Farmers are increasingly adopting mechanized equipment to improve productivity, reduce labor dependency, save operational time, and enhance efficiency across agricultural activities. Used tractors have emerged as an economical alternative to new machinery, particularly among small and medium-sized farmers seeking affordable mechanization solutions. The market is also benefiting from supportive government initiatives promoting farm modernization and providing incentives for agricultural equipment adoption. Growing pressure to increase food production due to rising global population levels is further accelerating the need for efficient farming operations and improved cultivation productivity. As agricultural land utilization intensifies, farmers are increasingly investing in reliable and affordable used tractors to optimize field operations and reduce operating costs. Expanding dealership networks, improved refurbishment standards, and increasing access to online equipment marketplaces are also contributing to stronger market penetration and wider customer accessibility across developed and developing agricultural economies.
| Market Scope | |
|---|---|
| Start Year | 2025 |
| Forecast Year | 2026-2035 |
| Start Value | $35.4 Billion |
| Forecast Value | $58.6 Billion |
| CAGR | 5.1% |
The farm tractors segment generated USD 25.4 billion in 2025 and is expected to grow at a CAGR of 5.5% from 2026 to 2035. The segment continues to dominate the market because tractors remain essential equipment for modern agricultural operations. Used farm tractors are widely utilized for plowing, cultivation, planting, harvesting, and material transportation activities. Farmers increasingly prefer used tractors as cost-effective alternatives to new machinery, particularly in price-sensitive agricultural markets. The availability of multiple horsepower categories and equipment configurations also allows farmers to select tractors suited to their operational requirements, farm size, and crop cultivation needs.
The 31-100 HP segment accounted for 40.2% share in 2025 and is anticipated to grow at a CAGR of 5.3% through 2035. Tractors within this horsepower range are highly preferred due to their operational versatility and suitability for small and medium-sized farming applications. These tractors offer an effective balance between fuel efficiency, power output, maintenance costs, and overall operational performance. Farmers continue to favor this category because it supports a broad range of agricultural functions while remaining affordable and adaptable to different farming conditions and equipment attachments.
United States Used Tractors Market generated USD 9.2 billion in 2025 and is expected to register a CAGR of 5.8% from 2026 to 2035. Growth in the country is supported by large-scale agricultural operations, established farming infrastructure, and continuous equipment replacement cycles among commercial farming businesses. Strong availability of quality used tractors through dealership networks, auction systems, and digital equipment marketplaces continues to strengthen market activity and improve customer access to affordable machinery solutions.
Major companies operating in the Global Used Tractors Market include John Deere, Kubota Corporation, Mahindra & Mahindra, CNH Industrial, AGCO Corporation, Massey Ferguson, Claas Group, Escorts Kubota, Yanmar, Kioti, TYM Tractors, Argo Tractors, SDF Group, Valtra, Sonalika, Powertrac, LS Mtron, Dongfeng Agricultural, Foton Tractors, Belarus, and Lovol. Companies operating in the used tractors market are adopting several strategic initiatives to strengthen their market position and expand customer reach. A major focus area involves expanding dealership and distribution networks to improve equipment availability across rural and agricultural regions. Manufacturers and dealers are also investing in certified refurbishment programs to improve product quality, reliability, and customer confidence in used equipment purchases. Digital transformation strategies, including online marketplaces and virtual equipment inspection platforms, are helping companies enhance customer accessibility and streamline the purchasing process. Businesses are further strengthening financing and leasing options to make used tractors more affordable for small and medium-sized farmers. Strategic partnerships with agricultural cooperatives, local distributors, and financial institutions are also supporting broader market penetration.
Table of Contents
Chapter 1 Methodology and Scope
- 1.1 Market scope and definition
- 1.2 Research design
- 1.2.1 Research approach
- 1.2.2 Data collection methods
- 1.3 Data mining sources
- 1.3.1 Global
- 1.3.2 Regional/Country
- 1.4 Base estimates and calculations
- 1.4.1 Base year calculation
- 1.4.2 Key trends for market estimation
- 1.5 Primary research and validation
- 1.5.1 Primary sources
- 1.6 Forecast model
- 1.7 Research assumptions and limitations
Chapter 2 Executive Summary
- 2.1 Industry 360° synopsis
- 2.2 Key market trends
- 2.2.1 Regional
- 2.2.2 Type
- 2.2.3 Horsepower
- 2.2.4 Fuel
- 2.2.5 End Users
- 2.2.6 Distribution channel
Chapter 3 Industry Insights
- 3.1 Industry ecosystem analysis
- 3.1.1 Supplier landscape
- 3.1.2 Profit margin
- 3.1.3 Value addition at each stage
- 3.1.4 Factor affecting the value chain
- 3.2 Industry impact forces
- 3.2.1 Growth drivers
- 3.2.1.1 Growing adoption of rental and leasing models
- 3.2.1.2 Rising mechanization in emerging agricultural markets
- 3.2.1.3 Expansion of online platforms and digital marketplaces
- 3.2.2 Industry pitfalls & challenges
- 3.2.2.1 Price volatility and market unpredictability
- 3.2.2.2 Quality assurance and equipment reliability concerns
- 3.2.3 Opportunities
- 3.2.3.1 Growth in sustainable and electric tractor adoption
- 3.2.3.2 Expansion in emerging markets and rural mechanization
- 3.2.1 Growth drivers
- 3.3 Growth potential analysis
- 3.3.1 Price volatility and market unpredictability
- 3.3.2 Quality assurance and equipment reliability concerns
- 3.4 Future market trends
- 3.5 Technology and innovation landscape
- 3.5.1 Current technological trends
- 3.5.2 Emerging technologies
- 3.6 Pricing Analysis (Driven by Primary Research)
- 3.6.1 Historical Price Trend Analysis (Driven by Primary Research)
- 3.6.2 Pricing Strategy by Player Type (Premium/Value/Cost-plus) (Driven by Primary Research)
- 3.7 Regulatory landscape
- 3.7.1 Standards and compliance requirements
- 3.7.2 Regional regulatory frameworks
- 3.7.3 Certification standards
- 3.8 Porter's analysis
- 3.9 PESTEL analysis
- 3.10 Trade Data Analysis (Driven by Primary Research)
- 3.10.1 Import/Export Volume & Value Trends (Driven by Primary Research)
- 3.10.2 Key Trade Corridors & Tariff Impact (Driven by Primary Research)
- 3.10.3 HS Code Classification & Trade Flow Analysis
- 3.11 Impact of AI & Generative AI on the Market
- 3.11.1 AI-Driven Disruption of Existing Business Models
- 3.11.2 GenAI Use Cases & Adoption Roadmap by Segment
- 3.11.3 Risks, Limitations & Regulatory Considerations
- 3.12 Refurbishment Capacity & Dealer Infrastructure Landscape (Driven by Primary Research)
- 3.12.1 Refurbishment Facility Capacity by Region & Key Player (Driven by Primary Research)
- 3.12.2 Dealer Network Density & Auction Throughput Analysis (Driven by Primary Research)
Chapter 4 Competitive Landscape, 2025
- 4.1 Introduction
- 4.2 Company market share analysis
- 4.2.1 By region
- 4.2.1.1 North America
- 4.2.1.2 Europe
- 4.2.1.3 Asia Pacific
- 4.2.1.4 Latin America
- 4.2.1.5 Middle East and Africa
- 4.2.1 By region
- 4.3 Company matrix analysis
- 4.4 Competitive analysis of major market players
- 4.5 Competitive positioning matrix
- 4.6 Key developments
- 4.6.1 Mergers & acquisitions
- 4.6.2 Partnerships & collaborations
- 4.6.3 New product launches
- 4.6.4 Expansion plans
Chapter 5 Market Estimates & Forecast, By Type, 2022 - 2035, (USD Billion) (Thousand Units)
- 5.1 Key trends
- 5.2 Farm tractor
- 5.2.1 Sub-compact utility tractor
- 5.2.2 Compact utility tractor
- 5.2.3 Specialty tractor
- 5.3 Construction tractor
- 5.4 Garden tractor
Chapter 6 Market Estimates & Forecast, By Horsepower, 2022 - 2035, (USD Billion) (Thousand Units)
- 6.1 Key trends
- 6.2 Below 30 HP
- 6.3 31-100 HP
- 6.4 101-200 HP
- 6.5 Above 200 HP
Chapter 7 Market Estimates & Forecast, By Fuel, 2022 - 2035, (USD Billion) (Thousand Units)
- 7.1 Key trends
- 7.2 Diesel
- 7.3 Petrol
- 7.4 Others (e.g., CNG, LPG)
Chapter 8 Market Estimates & Forecast, By End Users, 2022 - 2035, (USD Billion) (Thousand Units)
- 8.1 Key trends
- 8.2 Individual Owners
- 8.3 Residential
- 8.4 Commercial
Chapter 9 Market Estimates & Forecast, By Distribution Channel, 2022 - 2035, (USD Billion) (Thousand Units)
- 9.1 Key trends
- 9.2 Dealerships
- 9.3 Auctions
- 9.4 Private sales
- 9.5 Online platforms
Chapter 10 Market Estimates and Forecast, By Region, 2022 - 2035 (USD Billion) (Thousand Units)
- 10.1 Key trends
- 10.2 North America
- 10.2.1 U.S.
- 10.2.2 Canada
- 10.3 Europe
- 10.3.1 Germany
- 10.3.2 UK
- 10.3.3 France
- 10.3.4 Italy
- 10.3.5 Spain
- 10.4 Asia Pacific
- 10.4.1 China
- 10.4.2 Japan
- 10.4.3 India
- 10.4.4 Australia
- 10.4.5 South Korea
- 10.5 Latin America
- 10.5.1 Brazil
- 10.5.2 Mexico
- 10.5.3 Argentina
- 10.6 Middle East and Africa
- 10.6.1 South Africa
- 10.6.2 Saudi Arabia
- 10.6.3 UAE
Chapter 11 Company Profiles
- 11.1 Top Global Player
- 11.1.1 John Deere
- 11.1.2 CNH Industrial
- 11.1.3 Kubota Corporation
- 11.1.4 AGCO Corporation
- 11.1.5 Mahindra & Mahindra
- 11.1.6 Claas Group
- 11.1.7 Massey Ferguson
- 11.1.8 Escorts Kubota
- 11.1.9 Yanmar
- 11.2 Regional Player
- 11.2.1 Sonalika
- 11.2.2 LS Mtron
- 11.2.3 Kioti
- 11.2.4 Argo Tractors
- 11.2.5 SDF Group
- 11.2.6 Valtra
- 11.2.7 Belarus
- 11.2.8 TYM Tractors
- 11.3 Emerging Players
- 11.3.1 Lovol
- 11.3.2 Foton Tractors
- 11.3.3 Powertrac
- 11.3.4 Dongfeng Agricultural

 全輪驅動曳引機市場:全球市場預測(2026-2032年)
 全球二手曳引機市場規模、佔有率、趨勢和成長分析報告(2026-2034)
 全輪驅動曳引機市場機會、成長要素、產業趨勢分析及 2026-2035 年預測。
 大馬力曳引機市場 - 全球產業規模、佔有率、趨勢、機會、預測:按類型、應用、地區和競爭格局分類,2021-2031年
 低馬力曳引機市場:按馬力、驅動系統、應用和地區分類(2026-2034 年)
 曳引機市場:按功率輸出、驅動類型、應用和地區分類履帶曳引機市場:2026-2032年全球市場預測(按應用、功率範圍、最終用戶、燃料類型、變速箱類型和銷售管道)全球全輪驅動曳引機市場:市場規模、佔有率、趨勢和成長分析(2026-2034 年)大型推土機市場:2026-2032年全球市場預測(依型號、功率範圍、動力傳動系統、應用、最終用戶和銷售管道分類)
 曳引機:市場佔有率分析、行業趨勢和統計數據、成長預測(2026-2031 年)