

 |
市場調查報告書
商品編碼
2061436
雷射印表機市場機會、成長促進因素、產業趨勢分析及2026-2035年預測。Laser Printer Market Opportunity, Growth Drivers, Industry Trend Analysis, and Forecast 2026 - 2035 |
||||||
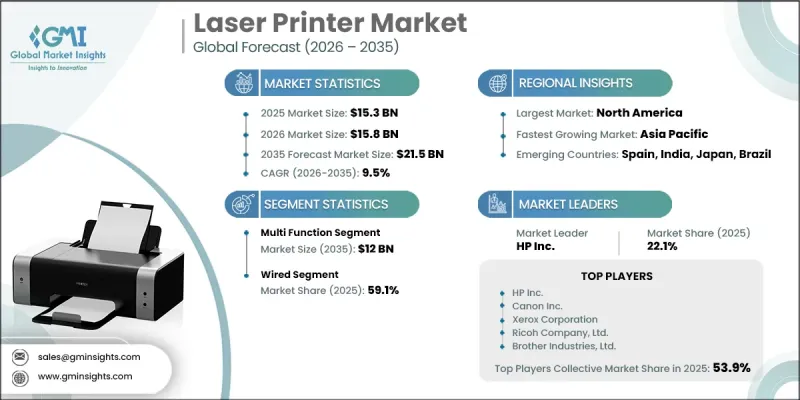
2025年全球雷射印表機市場價值為153億美元,預計2035年將以9.5%的複合年成長率成長至215億美元。
由於當今商業環境對高速、大批量文件處理的持續需求,市場持續擴張。企業越來越重視工作流程效率、更快的首張列印速度和更高的運轉率時間,這使得雷射列印系統相對於其他技術的需求持續成長。在結構化辦公環境中,對業務效率的日益重視也進一步推動了雷射列印系統的普及。貫穿產品整個生命週期的成本效益仍然是主要促進因素,因為雷射印表機雖然初始投資較高,但單頁列印成本低,非常適合大規模企業使用。對資料安全的日益關注也影響著採購決策,企業擴大選擇配備加密儲存、安全啟動系統和身份驗證控制功能的印表機來保護敏感資訊。數位商務的擴張和物流相關文件需求的增加也促進了需求的穩定成長。預計企業持續的數位轉型、混合辦公模式的普及以及託管列印服務的廣泛應用將支撐商業和公共部門市場的長期擴張。
| 市場範圍 | |
|---|---|
| 開始年份 | 2025 |
| 預測期 | 2026-2035 |
| 起始金額 | 153億美元 |
| 預測金額 | 215億美元 |
| 複合年成長率 | 9.5% |
預計到2025年,多功能印表機市場規模將達到85億美元,到2035年將達到120億美元。該細分市場持續成長,主要得益於其將多種辦公功能整合到單一設備中,從而提高空間利用率和營運效率。多功能印表機集列印、掃描、影印和文件處理功能於一體,既降低了設備成本,也節省了辦公空間。這些設備正日益成為數位化工作流程環境的核心組件,幫助企業從紙本流程過渡到整合的數位化運營,同時也有助於提高生產力和資源管理效率。
預計到2025年,有線連接市佔率將達到59.1%。有線列印解決方案因其效能穩定、資料傳輸速度一致以及安全功能增強而備受青睞。對資料保護要求嚴格的企業更傾向於選擇有線連接,因為這樣可以降低未授權存取和網路漏洞的風險。高運作可靠性和不間斷的工作流程效能進一步推動了對有線雷射印表機系統的需求,尤其是在結構化的企業環境中,一致性和安全性至關重要。
到2025年,美國雷射印表機市佔率將達到79.7%。其在美國市場的主導地位得益於強勁的企業數位舉措以及包括醫療保健、金融服務和政府機構在內的各行各業的大量列印需求。舊有系統向先進、多功能且安全的列印解決方案的持續升級,並不斷推動更換。雲端列印管理平台的日益普及,以及混合辦公室模式和節能列印技術的興起,進一步促進了採購活動的穩定。主要製造商和成熟的分銷管道也增強了其在商業和機構用戶中的市場滲透率。
目錄
第1章:調查方法和範圍
第2章執行摘要
第3章 行業洞察
- 產業生態系分析
- 供應商情況
- 利潤率
- 每個階段增加的價值
- 影響價值鏈的因素
- 影響產業的因素
- 成長促進因素
- 數位化和多功能性
- 遠距辦公模式的擴展
- 機構和政府相關需求
- 產業潛在風險與挑戰
- 數位文件使用範圍的擴大
- 環境問題和電子廢棄物法規
- 機會
- 亞太地區和拉丁美洲的新興市場
- 開發永續和環保印表機
- 成長促進因素
- 成長潛力分析
- 監理框架
- 標準和認證
- 環境法規(WEEE、RoHS、EPEAT)
- 出口和進口限制
- 能源之星和生態標章的要求
- 關鍵市場趨勢與顛覆性因素
- 技術與創新展望
- 泳裝最新潮流
- 新進展
- 價格分析
- 對過去價格趨勢的分析
- 依球員類型分類的定價策略(高級球員、超值球員、成本加成球員)
- 未來市場趨勢
- 貿易數據分析
- 進出口量及進口額趨勢
- 主要貿易路線及關稅的影響
- 人工智慧和生成式人工智慧對市場的影響
- 利用人工智慧改造現有經營模式
- 按細分市場分類的生成式人工智慧用例和部署藍圖
- 風險、限制和監管考量
- 波特的分析
- PESTLE分析
- 目前分銷基礎設施和通路滲透情況
- 按地區與業態(現代零售與傳統零售)分類的通路覆蓋率
- 缺乏最後一公里基礎設施和不斷變化的管道
- 亞太地區電子商務市場滲透率
第4章 競爭情勢
- 介紹
- 企業市佔率分析
- 按地區
- 企業矩陣分析
- 主要市場公司的競爭分析
- 競爭定位矩陣
- 主要進展
- 併購
- 夥伴關係和聯盟
- 新產品發布
- 業務拓展計劃
第5章 市場估計與預測:依類型分類,2022-2035年
- 單功能
- 多功能的
第6章 市場估計與預測:依產出類型分類,2022-2035年
- 彩色雷射
- 黑白雷射
第7章 市場估計與預測:依性別分類的互聯互通情況,2022-2035年
- 有線
- 無線的
第8章 市場估算與預測:依列印速度分類,2022-2035年
- 最高可達 30 ppm
- 30~50 ppm
- 超過 50 ppm
第9章 市場估計與預測:依價格分類,2022-2035年
- 低的
- 中等的
- 高的
第10章 市場估價與預測:依最終用途分類,2022-2035年
- 主要趨勢
- 個人
- 商業
- 公司
- 教育機構
- 媒體和出版公司
- 印刷中心/文具
- 其他(醫療、零售等)
- 政府機構
- 產業
第11章 市場估價與預測:依通路分類,2022-2035年
- 線上
- 電子商務
- 企業網站
- 離線
- 超級市場/大賣場
- 專業零售店
- 其他(例如獨立經營零售商店)
第12章 市場估計與預測:依地區分類,2022-2035年
- 北美洲
- 美國
- 加拿大
- 歐洲
- 德國
- 英國
- 法國
- 西班牙
- 義大利
- 亞太地區
- 中國
- 日本
- 印度
- 澳洲
- 韓國
- 拉丁美洲
- 巴西
- 墨西哥
- 阿根廷
- 中東和非洲
- 南非
- 沙烏地阿拉伯
- UAE
第13章:公司簡介
- 世界公司
- Brother Industries, Ltd.
- Canon Inc.
- Fujifilm Business Innovation
- HP Inc.
- Konica Minolta, Inc.
- Kyocera Document Solutions
- Pantum
- Ricoh Company, Ltd.
- Sharp Corporation
- Xerox Corporation
- 當地公司
- Lexmark
- Muratec/Murata Machinery
- Primax Electronics
- SATO America, Inc.
- Sindoh Co., Ltd.
- TECO Image Systems/TIS
- 新興企業
- ASTA
- Lenovo
- TVS Electronics
- Xiaomi
- Ziguang Hantu
The Global Laser Printer Market was valued at USD 15.3 billion in 2025 and is estimated to grow at a CAGR of 9.5% to reach USD 21.5 billion by 2035.
The market is witnessing expansion due to the sustained need for high-speed, high-volume document processing across modern enterprise environments. Organizations are increasingly prioritizing workflow efficiency, faster first-page output, and higher-duty cycle performance, which continues to strengthen demand for laser-based printing systems over alternative technologies. Rising focus on operational productivity in structured office environments is further reinforcing adoption. Cost efficiency over the product lifecycle also remains a major driver, as laser printers deliver lower per-page printing costs despite higher upfront investment, making them highly suitable for large-scale enterprise use. Growing concerns around data security are also influencing purchasing decisions, with businesses increasingly selecting printers equipped with encrypted storage, secure boot systems, and authentication controls to protect sensitive information. Expansion of digital commerce operations and logistics-driven documentation needs is further contributing to consistent demand growth. Continued enterprise digital transformation, hybrid work models, and increasing deployment of managed print services are expected to sustain long-term market expansion across commercial and institutional sectors.
| Market Scope | |
|---|---|
| Start Year | 2025 |
| Forecast Year | 2026-2035 |
| Start Value | $15.3 Billion |
| Forecast Value | $21.5 Billion |
| CAGR | 9.5% |
The multi-function printer segment generated USD 8.5 billion in 2025 and is projected to reach USD 12 billion by 2035. This segment continues to dominate due to its ability to consolidate multiple office functions into a single device, improving space utilization and operational efficiency. Multi-function systems integrate printing, scanning, copying, and document handling capabilities, reducing both equipment costs and office footprint requirements. These devices are increasingly used as central components in digital workflow environments, helping organizations transition from paper-based processes to integrated digital operations while improving productivity and resource management.
The wired connectivity segment held a 59.1% share in 2025. Wired printing solutions continue to be widely preferred due to their stable performance, consistent data transfer rates, and enhanced security features. Organizations with strict data protection requirements favor wired connections as they reduce exposure to unauthorized access and network vulnerabilities. High operational reliability and uninterrupted workflow performance further strengthen demand for wired-enabled laser printing systems, particularly in structured enterprise environments where consistency and security are critical.
U.S. Laser Printer Market accounted for 79.7% share in 2025. Market leadership in the country is supported by strong enterprise digitization initiatives and high-volume printing requirements across multiple sectors, including healthcare, financial services, and government institutions. Ongoing upgrades from legacy systems to advanced multifunction and secure printing solutions continue to drive replacement demand. Increasing adoption of cloud-based print management platforms, combined with hybrid work models and energy-efficient printing technologies, is further supporting consistent procurement activity. The presence of leading manufacturers and established distribution channels strengthens overall market penetration across commercial and institutional users.
Major companies operating in the Global Laser Printer Market include Xerox Corporation, Canon Inc., HP Inc., Ricoh Company, Ltd., Brother Industries, Ltd., Kyocera Document Solutions, Konica Minolta, Inc., Lexmark, Fujifilm Business Innovation, Sharp Corporation, Lenovo, Pantum, Muratec / Murata Machinery, SATO America, Inc., Sindoh Co., Ltd., Primax Electronics, TECO Image Systems / TIS, TVS Electronics, ASTA, Xiaomi, and Ziguang Hantu. Companies operating in the laser printer market are focusing on multiple strategic initiatives to strengthen competitiveness and expand market reach. Manufacturers are investing in advanced printing technologies that enhance speed, efficiency, and output quality while reducing operational costs. Strong emphasis is being placed on developing secure printing solutions with enhanced encryption, authentication, and device-level protection features to address rising cybersecurity concerns. Businesses are also expanding their portfolios of multifunction devices to meet growing demand for integrated office solutions. Strategic partnerships with IT service providers and enterprise software companies are supporting the development of cloud-enabled and managed print ecosystems.
Table of Contents
Chapter 1 Methodology & Scope
- 1.1 Research approach
- 1.2 Quality Commitments
- 1.2.1 GMI AI policy & data integrity commitment
- 1.2.1.1 Source consistency protocol
- 1.2.1 GMI AI policy & data integrity commitment
- 1.3 Research Trail & Confidence Scoring
- 1.3.1 Research Trail Components
- 1.3.2 Scoring Components
- 1.4 Data Collection
- 1.4.1 Partial list of primary sources
- 1.5 Data mining sources
- 1.5.1 Paid sources
- 1.5.1.1 Sources, by region
- 1.5.1 Paid sources
- 1.6 Base estimates and calculations
- 1.6.1 Base year calculation for any one approach
- 1.7 Forecast model
- 1.7.1 Quantified market impact analysis
- 1.7.1.1 Mathematical impact of growth parameters on forecast
- 1.7.1 Quantified market impact analysis
- 1.8 Research transparency addendum
- 1.8.1 Source attribution framework
- 1.8.2 Quality assurance metrics
- 1.9 Our commitment to trust
Chapter 2 Executive Summary
- 2.1 Industry 360° synopsis
- 2.2 Key market trends
- 2.2.1 Regional
- 2.2.2 Type
- 2.2.3 Output Type
- 2.2.4 Connectivity
- 2.2.5 Print speed
- 2.2.6 Price
- 2.2.7 End Use
- 2.2.8 Distribution Channel
Chapter 3 Industry Insights
- 3.1 Industry ecosystem analysis
- 3.1.1 Supplier landscape
- 3.1.2 Profit margin
- 3.1.3 Value addition at each stage
- 3.1.4 Factor affecting the value chain
- 3.2 Industry impact forces
- 3.2.1 Growth drivers
- 3.2.1.1 Digitalization and multifunctionality
- 3.2.1.2 Growth in remote work
- 3.2.1.3 Institutional and government-oriented needs
- 3.2.2 Industry pitfalls & challenges
- 3.2.2.1 Increase in the use of digital documents
- 3.2.2.2 Environmental concerns and e-waste regulations
- 3.2.3 Opportunities
- 3.2.3.1 Emerging markets in Asia Pacific & Latin America
- 3.2.3.2 Sustainable & eco-friendly printer development
- 3.2.1 Growth drivers
- 3.3 Growth potential analysis
- 3.4 Regulatory framework
- 3.4.1 Standards & Certifications
- 3.4.2 Environmental Regulations (WEEE, RoHS, EPEAT)
- 3.4.3 Import/Export Regulations
- 3.4.4 Energy Star & Eco-Label Requirements
- 3.5 Major market trends and disruptions
- 3.6 Technology/innovation landscape
- 3.6.1 Current trends in swimwear
- 3.6.2 Emerging trends
- 3.7 Pricing Analysis (driven by primary research)
- 3.7.1 Historical price trend analysis (driven by primary research)
- 3.7.2 Pricing strategy by player type (premium / value / cost-plus) (driven by primary research)
- 3.8 Future market trends
- 3.9 Trade data analysis (driven by paid database) (HS Code-84433240)
- 3.9.1 Import/export volume & value trends (driven by primary research)
- 3.9.2 Key trade corridors & tariff impact (driven by primary research)
- 3.10 Impact of AI & Generative AI on the Market
- 3.10.1 AI-driven disruption of existing business models
- 3.10.2 Gen-AI use cases & adoption roadmap by segment
- 3.10.3 Risks, limitations & regulatory considerations
- 3.11 Porter’s analysis
- 3.12 PESTEL analysis
- 3.13 Distribution Infrastructure & Channel Penetration Landscape (Driven by Primary Research)
- 3.13.1 Channel Coverage by Region & Format (Modern vs. Traditional Trade) (Driven by Primary Research)
- 3.13.2 Last-Mile Infrastructure Gaps & Emerging Channel Shifts (Driven by Primary Research)
- 3.13.3 E-Commerce Penetration in Asia-Pacific Markets
Chapter 4 Competitive landscape, 2025
- 4.1 Introduction
- 4.2 Company market share analysis
- 4.2.1 By region
- 4.2.1.1 North America
- 4.2.1.2 Europe
- 4.2.1.3 Asia Pacific
- 4.2.1.4 Latin America
- 4.2.1.5 Middle East and Africa
- 4.2.1 By region
- 4.3 Company matrix analysis
- 4.4 Competitive analysis of major market players
- 4.5 Competitive positioning matrix
- 4.6 Key developments
- 4.6.1 Mergers & acquisitions
- 4.6.2 Partnerships & collaborations
- 4.6.3 New product launches
- 4.6.4 Expansion plans
Chapter 5 Market Estimates & Forecast, By Type, 2022 - 2035 (USD Billion, Million Units)
- 5.1 Key trends
- 5.2 Single function
- 5.3 Multi-function
Chapter 6 Market Estimates & Forecast, By Output Type, 2022 - 2035 (USD Billion, Million Units)
- 6.1 Key trends
- 6.2 Color laser
- 6.3 Black & white laser
Chapter 7 Market Estimates & Forecast, By Connectivity, 2022 - 2035 (USD Billion, Million Units)
- 7.1 Key trends
- 7.2 Wired
- 7.3 Wireless
Chapter 8 Market Estimates & Forecast, By Print speed, 2022 - 2035 (USD Billion, Million Units)
- 8.1 Key trends
- 8.2 Up to 30ppm
- 8.3 30 to 50 ppm
- 8.4 Above 50 ppm
Chapter 9 Market Estimates & Forecast, By Price, 2022 - 2035 (USD Billion, Million Units)
- 9.1 Key trends
- 9.2 Low
- 9.3 Medium
- 9.4 High
Chapter 10 Market Estimates & Forecast, By End Use, 2022 - 2035 (USD Billion, Million Units)
- 10.1 Key Trends
- 10.2 Individual
- 10.3 Commercial
- 10.3.1 Corporate
- 10.3.2 Education institutes
- 10.3.3 Media & publication houses
- 10.3.4 Printing centres & stationery
- 10.3.5 Others (healthcare, retail, etc.)
- 10.4 Government Agencies
- 10.5 Industrial
Chapter 11 Market Estimates & Forecast, By Distribution Channel, 2022 - 2035 (USD Billion, Million Units)
- 11.1 Key trends
- 11.2 Online
- 11.2.1 E commerce
- 11.2.2 Company websites
- 11.3 Offline
- 11.3.1 Supermarkets/hypermarket
- 11.3.2 Specialty retail stores
- 11.3.3 Others (independent retailer etc.)
Chapter 12 Market Estimates & Forecast, By Region, 2022 - 2035 (USD Billion, Million Units)
- 12.1 Key trends
- 12.2 North America
- 12.2.1 U.S.
- 12.2.2 Canada
- 12.3 Europe
- 12.3.1 Germany
- 12.3.2 UK
- 12.3.3 France
- 12.3.4 Spain
- 12.3.5 Italy
- 12.4 Asia Pacific
- 12.4.1 China
- 12.4.2 Japan
- 12.4.3 India
- 12.4.4 Australia
- 12.4.5 South Korea
- 12.5 Latin America
- 12.5.1 Brazil
- 12.5.2 Mexico
- 12.5.3 Argentina
- 12.6 MEA
- 12.6.1 South Africa
- 12.6.2 Saudi Arabia
- 12.6.3 UAE
Chapter 13 Company Profiles
- 13.1 Global Company
- 13.1.1 Brother Industries, Ltd.
- 13.1.2 Canon Inc.
- 13.1.3 Fujifilm Business Innovation
- 13.1.4 HP Inc.
- 13.1.5 Konica Minolta, Inc.
- 13.1.6 Kyocera Document Solutions
- 13.1.7 Pantum
- 13.1.8 Ricoh Company, Ltd.
- 13.1.9 Sharp Corporation
- 13.1.10 Xerox Corporation
- 13.2 Regional Company
- 13.2.1 Lexmark
- 13.2.2 Muratec / Murata Machinery
- 13.2.3 Primax Electronics
- 13.2.4 SATO America, Inc.
- 13.2.5 Sindoh Co., Ltd.
- 13.2.6 TECO Image Systems / TIS
- 13.3 Emerging Company
- 13.3.1 ASTA
- 13.3.2 Lenovo
- 13.3.3 TVS Electronics
- 13.3.4 Xiaomi
- 13.3.5 Ziguang Hantu
 雷射印表機市場:2026年至2032年全球預測(依功能、產品類型、列印速度類別、列印量、應用程式、分銷管道及最終用戶產業分類)
 雷射印表機市場規模、佔有率和成長分析(按印表機類型、雷射類型、連接方式、輸出類型、最終用途和地區分類)-2026-2033年產業預測
 全球A3和A4雷射列印自助終端市場規模、佔有率、趨勢和成長分析報告(2026-2034年)
 全球雷射印表機市場:按類型、連接方式、輸出類型、價格範圍、列印速度、最終用途、國家及地區分類-產業分析、市場規模、市場佔有率及2025-2032年未來預測
 雷射印表機市場 - 全球產業規模、佔有率、趨勢、機會、預測:按類型、雷射類型、地區和競爭對手分類,2021-2031年
 A4雷射印表機:全球市佔率和排名、總銷售量和需求預測(2025-2031年)雷射印表機:全球市場佔有率和排名、總收入和需求預測(2025-2031年)A3雷射印表機:全球市佔率和排名、總銷售量和需求預測(2025-2031年)2026 年至 2032 年雷射印表機市場類型、應用、組織規模和地區分佈
 全球雷射印表機市場(2025-2029)