


 |
市場調查報告書
商品編碼
2061364
對 2026 年至 2035 年水產養殖設備市場進行商業機會、成長要素、產業趨勢分析與預測。Aquaculture equipment Market Opportunity, Growth Drivers, Industry Trend Analysis, and Forecast 2026 - 2035 |
||||||
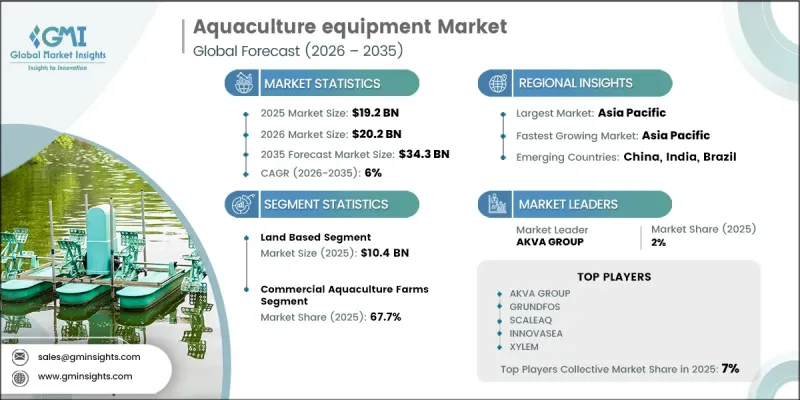
預計到 2025 年,全球水產養殖設備市場價值將達到 192 億美元,並預計以 6% 的複合年成長率成長,到 2035 年達到 343 億美元。
隨著全球水產品生產日益從野生捕撈轉向可控養殖環境,市場正穩步擴張。野生魚類資源面臨越來越大的壓力,人們對水產養殖作為可靠蛋白質來源(尤其是魚貝類)的需求也日益成長。這種結構性轉變促使人們更加依賴先進設備,以支持各種水產養殖系統中高效、擴充性和永續的養殖作業。水產養殖設備在提高生產力、動物健康管理和環境永續性發揮核心作用,該產業也在不斷發展。現代水產養殖系統整合了投餵方案、水質管理技術、曝氣系統、捕撈設備和監測工具,以確保日常運作的順利進行。這些解決方案廣泛應用於各種水產養殖形式,包括池塘養殖、水箱養殖、箱網養殖和循環水養殖設施。設備的進步已超越了基本的機械輔助,如今更著重於最佳化生產效率、降低營運風險和維持穩定的水生環境。人們對永續糧食生產和減少生態影響的日益關注,進一步推動了全球範圍內對技術先進的水產養殖系統的應用。
| 市場範圍 | |
|---|---|
| 開始年份 | 2025 |
| 預測期 | 2026-2035 |
| 上市時的市場規模 | 192億美元 |
| 預測市場規模 | 343億美元 |
| 複合年成長率 | 6% |
預計2025年,陸基水產養殖市場規模將達104億美元,持續維持市場主導地位。該領域的領先優勢源於其可控的營運環境,從而能夠更好地管理水質、投餵週期和魚類健康。與近海養殖相比,陸基養殖系統穩定性較高,受環境波動的影響較小。這不僅便於營運監控,還能幫助生產者在降低風險的同時維持穩定的產量。
到2025年,商業水產養殖將佔據67.7%的市場。該領域佔據市場主導地位,因為它構成了大規模水產品生產和供應鏈商業化的核心。這些養殖場在將水生生物養殖至上市規格方面發揮著至關重要的作用,也是該行業中最具經濟價值的部分。為了維持其大規模生產,需要持續使用先進的投餵系統、水處理設施、健康監測工具和捕撈技術,以確保整個生產週期的效率。
美國水產養殖設備市場佔據78.9%的市場佔有率,預計2025年市場規模將達到30億美元。美國市場的發展特徵是高度重視規範化和可控的水產養殖方式,優先考慮食品安全、環境保護和營運效率。生產者越來越依賴能夠確保穩定氧氣水平、清潔水質和高效廢棄物管理的系統。大規模商業水產養殖作業進一步凸顯了對使用壽命長、經久耐用、性能卓越的設備的需求。
目錄
第1章:調查方法和範圍
第2章執行摘要
第3章 行業洞察
- 產業生態系分析
- 供應商情況
- 利潤率
- 每個階段增加的價值
- 影響價值鏈的因素
- 影響產業的因素
- 促進因素
- 產業潛在風險與挑戰
- 機會
- 成長潛力分析
- 將產品類型轉換為設備需求的框架
- 水產養殖魚類物種簡介
- 物種與裝備的對應關係表
- 區域魚類物種組成對設備市場的影響
- 未來市場趨勢
- 技術與創新展望
- 最新科技趨勢
- 新興技術包括物聯網、人工智慧和自動化
- 智慧水產養殖及精密農業系統
- 循環水產養殖系統的進展
- 遠端監控和預測分析
- 價格趨勢
- 基於初步調查對過去價格趨勢的分析
- 按玩家類型分類的定價策略(包括高級定價、超值定價和成本加成定價模式)
- 區域價格波動及其主要原因
- 按設備類型分類的價格基準
- 監理情勢
- 監理框架
- 標準和合規要求
- 區域監理框架
- 北美地區的監管狀況,包括美國環保署 (EPA)、美國食品藥物管理局 (FDA) 和各州的相關法規。
- 歐盟水產養殖法規和歐洲監管情勢,包括 REACH 法規
- 亞太地區的監管情勢(包括各國的水產養殖政策)
- 拉丁美洲的監管狀況
- 中東和非洲的監管狀況
- 認證標準包括ASC、BAP和Global GAP。
- 環境排放和水質法規
- 波特的分析
- PESTLE分析
- 貿易數據分析
- 進出口量及進口額趨勢
- 主要貿易路線及關稅的影響
- 區域貿易平衡及淨進口與淨出口
- HS編碼分類及貿易資料的詳細程度
- 人工智慧和生成式人工智慧對市場的影響
- 利用人工智慧改造現有經營模式
- 針對特定領域的生成式人工智慧應用案例和實施藍圖
- 風險、限制和監管考量
- 人工智慧在預測性健康監測和疾病檢測的應用
- 自動最佳化飼餵和飼料轉換率
- 根據初步調查,產能和生產趨勢
- 根據初步調查,各地區和主要生產商的設備產能狀況
- 根據初步調查結果制定的運轉率和擴張計劃
- 製造地和區域生產基地
第4章 競爭情勢
- 介紹
- 企業市佔率分析
- 按地區
- 北美洲
- 歐洲
- 亞太地區
- 拉丁美洲
- 中東和非洲
- 按地區
- 企業矩陣分析
- 主要市場公司的競爭分析
- 競爭定位矩陣
- 主要進展
- 併購
- 夥伴關係和聯盟
- 新產品發布
- 業務拓展計劃
第5章 市場估算與預測:依設備類型分類,2022-2035年
- 水循環和輸送設備(泵浦)
- 離心式幫浦
- 潛水泵
- 專用泵浦
- 容積式泵
- 曝氣和供氧系統
- 空氣壓縮機
- 鼓風機
- 氧氣發生系統
- 曝氣配件
- 水處理和調節設備
- 混合裝置
- 生物治療
- 物理加工
- 化學和先進加工
- 飼養及營養系統
- 魚類處理及捕撈設備
- 監控系統
- 結構和圍護系統
- 其他專用設備
第6章 市場估算與預測,依設備類型分類:類別,2022-2035年
- 鮭科魚類
- 海魚
- 淡水魚
- 蝦子和甲殼類動物
- 蛤蜊
- 觀賞植物和其他特殊品種
第7章 市場估計與預測:依應用領域分類,2022-2035年
- 陸基
- 海基型
第8章 市場估算與預測:依最終用途分類,2022-2035年
- 商業養魚場
- 孵化場及水產養殖場
- 觀賞魚及水族相關產業
- 研究和教育機構
- 其他
第9章 市場估價與預測:依通路分類,2022-2035年
- 直銷
- 間接銷售
第10章 市場估價與預測:依地區分類,2022-2035年
- 北美洲
- 美國
- 加拿大
- 歐洲
- 德國
- 英國
- 法國
- 西班牙
- 義大利
- 亞太地區
- 中國
- 日本
- 印度
- 澳洲
- 韓國
- 拉丁美洲
- 巴西
- 墨西哥
- 阿根廷
- 中東和非洲
- 南非
- 沙烏地阿拉伯
- UAE
第11章:公司簡介
- 第一層級:全球性公司(7家)
- AKVA Group
- ScaleAQ
- Innovasea
- Xylem
- Grundfos
- Veolia
- Pentair AES
- 第二梯隊:區域領先企業(7家)
- Poseidon Ocean Systems
- VAKI
- Landia A/S
- ELDI
- IAS Products
- Pioneer Group
- CPI Equipment
- Tier 3:niche/specialists(7)
- AquaMaof
- Eruvaka
- Optimar
- AquaScan
- FFF Systems
- AQ1 Systems
- Optiras
The Global Aquaculture Equipment Market was valued at USD 19.2 billion in 2025 and is estimated to grow at a CAGR of 6% to reach USD 34.3 billion by 2035.
The market is witnessing steady expansion as global seafood production increasingly shifts from wild capture to controlled farming environments. Pressure on natural fish stocks has accelerated the need for aquaculture as a dependable source of protein supply, particularly for fish and shellfish. This structural transition is strengthening reliance on advanced equipment designed to support efficient, scalable, and sustainable aquaculture operations across diverse farming systems. The industry is also evolving as aquaculture equipment becomes central to improving productivity, animal health management, and environmental sustainability. Modern aquaculture systems integrate feeding solutions, water quality control technologies, aeration systems, harvesting equipment, and monitoring tools to ensure smooth day-to-day operations. These solutions are widely used across pond-based farming, tank systems, cage farming, and recirculating aquaculture setups. Equipment advancements have moved beyond basic mechanical support, now focusing on optimizing output efficiency, reducing operational risks, and maintaining stable aquatic environments. Increasing emphasis on sustainable food production and reduced ecological impact is further encouraging adoption of technologically advanced aquaculture systems worldwide.
| Market Scope | |
|---|---|
| Start Year | 2025 |
| Forecast Year | 2026-2035 |
| Start Value | $19.2 Billion |
| Forecast Value | $34.3 Billion |
| CAGR | 6% |
The land-based aquaculture accounted for USD 10.4 billion in 2025, maintaining a leading position in the market. This segment dominates due to its controlled operational environment, which enables better management of water quality, feeding cycles, and fish health conditions. Compared to offshore farming, land-based systems offer improved stability and reduced exposure to environmental disruptions. This makes operational monitoring easier while allowing producers to maintain consistent production output with lower risk exposure.
The commercial aquaculture farms segment held a 67.7% share in 2025. This segment dominates as it forms the core of large-scale seafood production and supply chain commercialization. These farms are responsible for raising aquatic species to market-ready size, making them the most economically significant part of the industry. Their large production scale requires continuous use of advanced feeding systems, water treatment equipment, health monitoring tools, and harvesting technologies to maintain efficiency throughout the production cycle.
U.S. Aquaculture Equipment Market held a 78.9% share, generating USD 3 billion in 2025. The country's market is shaped by a strong focus on regulated and controlled aquaculture practices that prioritize food safety, environmental protection, and operational efficiency. Producers increasingly rely on systems that ensure stable oxygen levels, clean water conditions, and efficient waste management. Large-scale commercial operations further emphasize the need for durable and high-performance equipment with extended service life.
Key companies operating in the Global Aquaculture Equipment Market include AKVA Group, ScaleAQ, Innovasea, Xylem, Grundfos, Veolia, Pentair AES, Poseidon Ocean Systems, VAKI, Landia A/S, Eruvaka, AquaMaof, Optimar, AquaScan, FFF Systems, AQ1 Systems, CPI Equipment, Pioneer Group, IAS Products, and ELDI. Companies in the aquaculture equipment market are increasingly focusing on automation and digital monitoring systems to improve operational efficiency and reduce manual intervention. Investments in smart water quality sensors, real-time tracking solutions, and AI-based feeding systems are helping optimize farm productivity. Manufacturers are also prioritizing energy-efficient and sustainable designs to align with environmental regulations and reduce operational costs. Strategic partnerships with aquaculture farms and seafood producers are strengthening distribution networks and market penetration. Additionally, companies are expanding R&D efforts to develop integrated recirculating systems and advanced filtration technologies that enhance production stability and fish health management while supporting scalable commercial operations.
Table of Contents
Chapter 1 Methodology and scope
- 1.1 Research approach
- 1.2 Quality Commitments
- 1.2.1 GMI AI policy & data integrity commitment
- 1.2.1.1 Source consistency protocol
- 1.2.1 GMI AI policy & data integrity commitment
- 1.3 Research Trail & Confidence Scoring
- 1.3.1 Research Trail Components
- 1.3.2 Scoring Components
- 1.4 Data Collection
- 1.4.1 Partial list of primary sources
- 1.5 Data mining sources
- 1.5.1 Paid sources
- 1.5.1.1 Sources, by region
- 1.5.1 Paid sources
- 1.6 Base estimates and calculations
- 1.6.1 Base year calculation for any one approach
- 1.7 Forecast model
- 1.7.1 Quantified market impact analysis
- 1.7.1.1 Mathematical impact of growth parameters on forecast
- 1.7.1 Quantified market impact analysis
- 1.8 Research transparency addendum
- 1.8.1 Source attribution framework
- 1.8.2 Quality assurance metrics
- 1.8.3 Our commitment to trust
Chapter 2 Executive summary
- 2.1 Industry 360° synopsis
- 2.2 Key market trends
- 2.2.1 By region
- 2.2.2 By equipment type
- 2.2.3 By application
- 2.2.4 By end use
- 2.2.5 By distribution channel
Chapter 3 Industry insights
- 3.1 Industry ecosystem analysis
- 3.1.1 Supplier landscape
- 3.1.2 Profit margin
- 3.1.3 Value addition at each stage
- 3.1.4 Factor affecting the value chain
- 3.2 Industry impact forces
- 3.2.1 Growth drivers
- 3.2.2 Industry pitfalls & challenges
- 3.2.3 Opportunities
- 3.3 Growth potential analysis
- 3.4 Species-to-Equipment Demand Translation Framework
- 3.4.1 Aquaculture species profile
- 3.4.2 Species-equipment crosswalk matrices
- 3.4.3 Regional species mix impact on equipment markets
- 3.5 Future market trends
- 3.6 Technology and innovation landscape
- 3.6.1 Current technological trends
- 3.6.2 Emerging technologies including IoT, AI, and automation
- 3.6.3 Smart aquaculture and precision farming systems
- 3.6.4 Recirculating aquaculture systems advancements
- 3.6.5 Remote monitoring and predictive analytics
- 3.7 Price trends
- 3.7.1 Historical price trend analysis driven by primary research
- 3.7.2 Pricing strategy by player type including premium, value, and cost-plus approaches
- 3.7.3 Regional price variation and key drivers
- 3.7.4 Equipment type price benchmarking
- 3.8 Regulatory landscape
- 3.8.1 Regulatory framework
- 3.8.2 Standards and compliance requirements
- 3.8.3 Regional regulatory frameworks
- 3.8.3.1 North America regulatory landscape including EPA, FDA, and state regulations
- 3.8.3.2 Europe regulatory landscape including EU aquaculture regulations and REACH
- 3.8.3.3 Asia Pacific regulatory landscape including national aquaculture policies
- 3.8.3.4 Latin America regulatory landscape
- 3.8.3.5 Middle East and Africa regulatory landscape
- 3.8.4 Certification standards including ASC, BAP, and Global GAP
- 3.8.5 Environmental discharge and water quality regulations
- 3.9 Porter’s analysis
- 3.10 PESTEL analysis
- 3.11 Trade data analysis (driven by paid database) (HS code: 8414.80/8421.21/8907.90/ others)
- 3.11.1 Import and export volume and value trends (driven by primary research)
- 3.11.2 Key trade corridors and tariff impact (driven by primary research)
- 3.11.3 Regional trade balance and net importers versus exporters
- 3.11.4 HS code classification and trade data granularity
- 3.12 Impact of AI and generative AI on the market
- 3.12.1 AI-driven disruption of existing business models
- 3.12.2 Generative AI use cases and adoption roadmap by segment
- 3.12.3 Risks, limitations, and regulatory considerations
- 3.12.4 AI in predictive health monitoring and disease detection
- 3.12.5 Automated feeding optimization and feed conversion efficiency
- 3.13 Capacity and production landscape driven by primary research
- 3.13.1 Installed capacity by region and key producer driven by primary research
- 3.13.2 Capacity utilization rates and expansion pipelines driven by primary research
- 3.13.3 Manufacturing footprint and regional production hubs
Chapter 4 Competitive landscape, 2025
- 4.1 Introduction
- 4.2 Company market share analysis
- 4.2.1 By region
- 4.2.1.1 North America
- 4.2.1.2 Europe
- 4.2.1.3 Asia Pacific
- 4.2.1.4 Latin America
- 4.2.1.5 Middle East & Africa
- 4.2.1 By region
- 4.3 Company matrix analysis
- 4.4 Competitive analysis of major market players
- 4.5 Competitive positioning matrix
- 4.6 Key developments
- 4.6.1 Mergers & acquisitions
- 4.6.2 Partnerships & collaborations
- 4.6.3 New product launches
- 4.6.4 Expansion plans
Chapter 5 Market Estimates & Forecast, By Equipment type, 2022 - 2035 ($Billion, Thousand Units)
- 5.1 Key trends
- 5.2 Water circulation & transfer equipment (pumps)
- 5.2.1 Centrifugal pumps
- 5.2.2 Submersible pumps
- 5.2.3 Specialized pumps
- 5.2.4 Positive displacement pumps
- 5.3 Aeration & oxygenation equipment
- 5.3.1 Air compressors
- 5.3.2 Air blowers
- 5.3.3 Oxygen generation systems
- 5.3.4 Aeration accessories
- 5.4 Water treatment & conditioning equipment
- 5.4.1 Mixing equipment
- 5.4.2 Biological treatment
- 5.4.3 Physical treatment
- 5.4.4 Chemical/advanced treatment
- 5.5 Feeding & nutrition systems
- 5.6 Fish handling & harvesting equipment
- 5.7 Monitoring & control systems
- 5.8 Structural & containment systems
- 5.9 Other specialized equipment
Chapter 6 Market Estimates & Forecast, Equipment type, By Species, 2022 - 2035 ($Billion, Thousand Units)
- 6.1 Key trends
- 6.2 Salmonids
- 6.3 Marine finfish
- 6.4 Freshwater finfish
- 6.5 Shrimp and crustaceans
- 6.6 Bivalve mollusks
- 6.7 Ornamental and other speciality species
Chapter 7 Market Estimates & Forecast, By Application, 2022 - 2035 ($Billion, Thousand Units)
- 7.1 Key trends
- 7.2 Land-based
- 7.3 Sea-based
Chapter 8 Market Estimates & Forecast, By End use, 2022 - 2035 ($Billion, Thousand Units)
- 8.1 Key trends
- 8.2 Commercial aquaculture farms
- 8.3 Hatcheries and nurseries
- 8.4 Ornamental fish and aquarium trade
- 8.5 Research and educational institutions
- 8.6 Others
Chapter 9 Market Estimates & Forecast, By Distribution Channel, 2022 - 2035 ($Billion, Thousand Units)
- 9.1 Key trends
- 9.2 Direct sales
- 9.3 Indirect sales
Chapter 10 Market Estimates & Forecast, By Region, 2022 - 2035 ($Billion, Million Units)
- 10.1 Key trends
- 10.2 North America
- 10.2.1 U.S.
- 10.2.2 Canada
- 10.3 Europe
- 10.3.1 Germany
- 10.3.2 UK
- 10.3.3 France
- 10.3.4 Spain
- 10.3.5 Italy
- 10.4 Asia Pacific
- 10.4.1 China
- 10.4.2 Japan
- 10.4.3 India
- 10.4.4 Australia
- 10.4.5 South Korea
- 10.5 Latin America
- 10.5.1 Brazil
- 10.5.2 Mexico
- 10.5.3 Argentina
- 10.6 MEA
- 10.6.1 South Africa
- 10.6.2 Saudi Arabia
- 10.6.3 UAE
Chapter 11 Company Profiles
- 11.1 Tier 1: global players (7)
- 11.1.1 AKVA Group
- 11.1.2 ScaleAQ
- 11.1.3 Innovasea
- 11.1.4 Xylem
- 11.1.5 Grundfos
- 11.1.6 Veolia
- 11.1.7 Pentair AES
- 11.2 Tier 2: regional champions (7)
- 11.2.1 Poseidon Ocean Systems
- 11.2.2 VAKI
- 11.2.3 Landia A/S
- 11.2.4 ELDI
- 11.2.5 IAS Products
- 11.2.6 Pioneer Group
- 11.2.7 CPI Equipment
- 11.3 Tier 3: niche/specialists (7)
- 11.3.1 AquaMaof
- 11.3.2 Eruvaka
- 11.3.3 Optimar
- 11.3.4 AquaScan
- 11.3.5 FFF Systems
- 11.3.6 AQ1 Systems
- 11.3.7 Optiras
 智慧水產養殖市場預測至2034年-按解決方案類型、組件、技術、應用、最終用戶和地區分類的全球分析
 2026年全球水產養殖過濾設備市場研究報告智慧農業除草機器人市場預測至2034年—全球機器人類型、組件、農場類型、銷售管道、最終用戶和區域分析永續水產養殖食品市場預測—按類型、養殖系統、形式、認證、最終用戶和地區分類的全球分析—2034年永續水產養殖技術市場預測至2034年:按組件、類型、技術、最終用戶和地區分類的全球分析
 鮭魚飼料市場:按類型、原料、應用和地區分類石斑魚市場趨勢:依品種、用途、捕撈方法及地區分類
 全球鹵蟲市場:市場規模、佔有率、趨勢和成長分析(2026-2034)
 水產養殖市場規模、佔有率和成長分析:按環境、魚類品種、地區和產業預測,2026-2033年水產養殖肥料市場規模、佔有率、成長及全球產業分析:按類型、應用和地區分類,並預測至2026-2034年