

 |
市場調查報告書
商品編碼
2061326
定向能武器與無人機設備市場:市場機會、成長促進因素、產業趨勢分析及未來預測(2026-2035)Directed Energy Counter-UAS Market Opportunity, Growth Drivers, Industry Trend Analysis, and Forecast 2026 - 2035 |
||||||
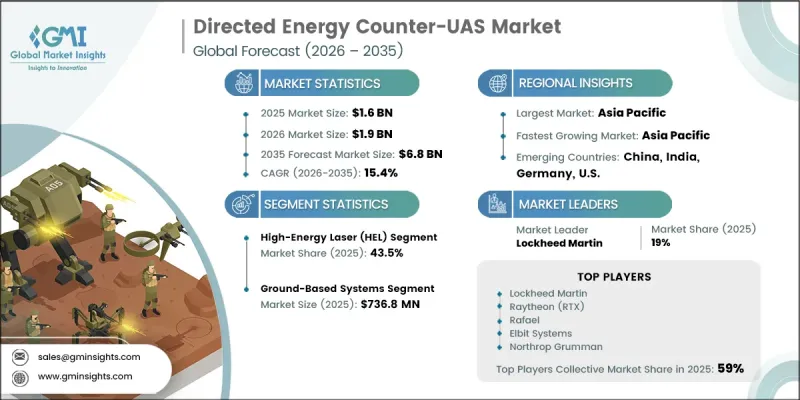
2025 年全球定向能與無人機設備市場價值 16 億美元,預計到 2035 年將達到 68 億美元,年複合成長率為 15.4%。
無人機和機群威脅的加劇和頻率的增加推動了市場成長,這些威脅給傳統防空系統帶來了巨大壓力。對經濟高效、擴充性且永續的攔截技術的需求日益成長,正在加速定向能解決方案在國防和安全領域的應用。不斷擴大的國防現代化努力以及保護關鍵基礎設施需求的增加,進一步促進了市場成長。雷射系統、電力電子和能量管理技術的持續進步,提高了系統的性能、可靠性和部署柔軟性。隨著各國軍隊和安全部隊尋求更快、更精確、更低成本的攔截方法,對非致命性防禦能力的日益重視也促進了定向能技術的更廣泛應用。自主無人機的能力以及電子彈性平台的演進,進一步加劇了全球國防領域對先進定向能對抗措施的需求。
| 市場範圍 | |
|---|---|
| 開始年份 | 2025 |
| 預測期 | 2026-2035 |
| 初始市場規模 | 16億美元 |
| 市場規模預測 | 68億美元 |
| 複合年成長率 | 15.4% |
預計2026年至2035年間,高功率微波(HPM)領域將以17.2%的複合年成長率成長。該領域的成長主要得益於其能夠同時應對來自多個無人機的威脅,使其在對抗集群攻擊方面極為有效。 HPM系統具備廣泛的非致命性干擾能力,在當今的威脅情勢下正變得日益重要。研發投入的不斷增加,以及對移動式和短程反無人機系統日益成長的需求,正進一步加速其在國防和安全領域的應用。
預計2025年,地面定向能系統市場規模將達到7.368億美元。這一佔據主導地位的市場佔有率主要得益於其在軍事設施、邊防安全區、關鍵基礎設施和城市防禦區域的廣泛部署。與移動平台相比,地面定向能系統具有諸多優勢,包括高功率容量、與現有雷達和指揮控制網路無縫整合以及更低的運作風險。其成本效益、擴充性和久經考驗的運作可靠性使其成為大規模、永久性反無人機系統部署的首選解決方案。
預計到2025年,北美定向能反無人機系統(UAS)設備市場將佔據31.4%的佔有率。該地區市場成長的促進因素包括:國內安全擔憂加劇、關鍵基礎設施附近無證無人機活動日益增多,以及對空域保護的日益重視。此外,全部區域軍事基地、邊境地區和高價值基礎設施的集中分佈也進一步推動了對先進非致命攔截系統的需求。
目錄
第1章:分析方法和範圍
第2章執行摘要
第3章業界考察
- 產業生態系分析
- 供應商情況
- 利潤率
- 成本結構
- 每個階段增加的價值
- 影響價值鏈的因素
- 中斷
- 影響產業的因素
- 促進因素
- 電動車的快速普及增加了對IGBT和SiC的需求。
- 工業自動化的發展正在推動電源模組的需求成長。
- 能源效率法規要求採用先進的電力電子技術。
- 資料中心的電源最佳化導致 MOSFET 功耗增加。
- 快速充電基礎設施的擴展正在推動對寬能隙半導體的需求。
- 產業潛在風險與挑戰
- SiC和GaN元件的製造成本高昂
- 供應鏈中對數量有限的晶圓供應商的依賴
- 市場機遇
- 在800V電動車平台中採用SiC
- 智慧電網的升級改造增加了對高功率分立元件的需求。
- 促進因素
- 成長潛力分析
- 監理情勢
- 波特五力分析
- PESTEL 分析
- 技術與創新展望
- 最新科技趨勢
- 新興技術
- 價格趨勢
- 按地區
- 依產品
- 定價策略
- 新興經營模式
- 合規要求
- 專利和智慧財產權分析
第4章 競爭情勢
- 介紹
- 公司市佔率分析
- 按地區
- 市場集中度分析
- 主要公司的競爭標竿分析
- 財務績效比較
- 收入
- 利潤率
- 研究與發展(R&D)
- 產品系列比較
- 產品線寬度
- 科技
- 創新
- 區域擴張比較
- 全球擴張分析
- 服務網路覆蓋
- 按地區分類的市場滲透率
- 競爭定位矩陣
- 領導者
- 挑戰者
- 追蹤者
- 小眾玩家
- 戰略展望矩陣
- 財務績效比較
- 主要趨勢
- 研究與發展(R&D)
- 夥伴關係和聯盟
- 技術進步
- 擴張與投資策略
- 數位轉型計劃
- 新興企業競爭公司和新創企業的發展趨勢
第5章 市場估算與預測:依技術類型分類(2022-2035 年)
- 高能量雷射(HEL)
- 固體雷射
- 光纖雷射
- 高功率微波(HPM)
- 窄頻功率微波
- 寬頻 HPM
- 新興技術
第6章 市場估算與預測:依平台類型分類(2022-2035 年)
- 陸基系統
- 行動/可攜式系統
- 固定式/落地式
- 海軍和海事系統
- 船上系統
- 海岸和港口防禦系統
- 機載系統
- 無人機搭載系統
- 飛機綜合系統
第7章 市場估計與預測:依產量區分(2022-2035 年)
- 低功率(小於10千瓦)
- 中功率(10-50千瓦)
- 高功率(>50千瓦)
第8章 市場估算與預測:依應用領域分類(2022-2035 年)
- 軍事/國防活動
- 基地防禦
- 在戰場上使用
- 策略性資產保護
- 邊境及周邊安全
- 關鍵基礎設施保護
- 飛機場
- 港口/海事
- 能源公用事業
- 政府設施
- 消費者和商業安全
- 公共活動和體育場館
- 企業和工業設施
第9章 市場估計與預測:按地區分類(2022-2035 年)
- 北美洲
- 美國
- 加拿大
- 歐洲
- 德國
- 英國
- 法國
- 西班牙
- 義大利
- 俄羅斯
- 亞太地區
- 中國
- 印度
- 日本
- 澳洲
- 韓國
- 拉丁美洲
- 巴西
- 墨西哥
- 阿根廷
- 中東和非洲
- 南非
- 沙烏地阿拉伯
- UAE
第10章:公司簡介
- 全球主要公司
- Lockheed Martin
- Raytheon(RTX)
- Rafael
- Elbit Systems
- Northrop Grumman
- 該地區的主要公司
- 北美洲
- Boeing
- L3Harris
- General Atomics
- Kratos
- 歐洲
- BAE Systems
- Leonardo
- Thales
- Rheinmetall
- QinetiQ
- 北美洲
- 小眾公司和顛覆者
- Epirus
The Global Directed Energy Counter-UAS Market was valued at USD 1.6 billion in 2025 and is estimated to grow at a CAGR of 15.4% to reach USD 6.8 billion by 2035.
The market growth is driven by the increasing intensity and frequency of drone-based and swarm-enabled aerial threats, which are placing significant pressure on conventional air defense systems. Rising demand for cost-efficient, scalable, and sustainable interception technologies is accelerating the adoption of directed energy solutions across defense and security applications. Expanding defense modernization initiatives, along with the growing need to secure critical infrastructure, are further supporting market expansion. Continuous advancements in laser systems, power electronics, and energy management technologies are enhancing system performance, reliability, and deployment flexibility. Increasing focus on non-kinetic defense capabilities is also contributing to broader adoption, as military and security forces seek faster, more precise, and lower-cost interception methods. The evolution of autonomous drone capabilities and electronically resilient platforms is further reinforcing the need for advanced directed energy countermeasures across global defense environments.
| Market Scope | |
|---|---|
| Start Year | 2025 |
| Forecast Year | 2026-2035 |
| Start Value | $1.6 Billion |
| Forecast Value | $6.8 Billion |
| CAGR | 15.4% |
The high-power microwave (HPM) segment is projected to grow at a CAGR of 17.2% during 2026-2035. Growth in this segment is driven by its ability to neutralize multiple unmanned aerial threats simultaneously, making it highly effective against swarm-based attacks. HPM systems provide wide-area, non-kinetic disruption capabilities that are increasingly relevant in modern threat environments. Rising investment in research and development, along with growing demand for mobile and short-range counter-drone systems, is further accelerating adoption across defense and security applications.
The ground-based systems segment reached USD 736.8 million in 2025. This dominance is attributed to its widespread deployment across military installations, border security zones, critical infrastructure sites, and urban defense areas. Ground-based directed energy systems offer strong operational advantages, including higher power capacity, seamless integration with existing radar and command-and-control networks, and reduced operational risk compared to mobile platforms. Their cost efficiency, scalability, and proven operational reliability make them the preferred solution for large-scale and permanent counter-UAS deployments.
North America Directed Energy Counter-UAS Market accounted for 31.4% share in 2025. The region's growth is driven by rising homeland security concerns, increasing incidents of unauthorized drone activity near sensitive installations, and heightened emphasis on airspace protection. A dense network of military bases, border regions, and high-value infrastructure assets is further supporting demand for advanced non-kinetic interception systems across the region.
Key companies operating in the Global Directed Energy Counter-UAS Market include Lockheed Martin, Raytheon (RTX), Northrop Grumman, Boeing, L3Harris, BAE Systems, Leonardo, Thales, Rheinmetall, General Atomics, Kratos, Rafael, Elbit Systems, Epirus, and QinetiQ. Companies in the directed energy counter-UAS market are focusing on advancing high-energy weapon technologies and strengthening system integration capabilities to expand their market presence. A key strategy involves heavy investment in laser systems, microwave technologies, and power optimization solutions to improve interception accuracy and operational range. Firms are prioritizing the development of modular and scalable platforms that can be deployed across fixed and mobile defense environments. Strategic partnerships with defense agencies are enabling faster testing, validation, and deployment of next-generation systems. Companies are also enhancing R&D efforts in thermal management, energy efficiency, and beam control technologies to improve reliability under operational stress. Expansion into multi-domain defense applications and integration with existing command-and-control systems is further strengthening adoption.
Table of Contents
Chapter 1 Methodology and Scope
- 1.1 Market scope and definition
- 1.2 Research design
- 1.2.1 Research approach
- 1.2.2 Data collection methods
- 1.3 Data mining sources
- 1.3.1 Global
- 1.3.2 Regional/Country
- 1.4 Base estimates and calculations
- 1.4.1 Base year calculation
- 1.4.2 Key trends for market estimation
- 1.5 Primary research and validation
- 1.5.1 Primary sources
- 1.6 Forecast model
- 1.7 Research assumptions and limitations
Chapter 2 Executive Summary
- 2.1 Industry 360° synopsis, 2022 - 2035
- 2.2 Key market trends
- 2.2.1 Technology type trends
- 2.2.2 Platform type trends
- 2.2.3 Power output trends
- 2.2.4 Application trends
- 2.2.5 Regional trends
- 2.3 TAM Analysis, 2026-2035
- 2.4 CXO perspectives: Strategic imperatives
Chapter 3 Industry Insights
- 3.1 Industry ecosystem analysis
- 3.1.1 Supplier Landscape
- 3.1.2 Profit Margin
- 3.1.3 Cost structure
- 3.1.4 Value addition at each stage
- 3.1.5 Factor affecting the value chain
- 3.1.6 Disruptions
- 3.2 Industry impact forces
- 3.2.1 Growth drivers
- 3.2.1.1 Rapid EV adoption increasing IGBT and SiC demand
- 3.2.1.2 Industrial automation growth raising demand for power modules
- 3.2.1.3 Energy efficiency regulations mandating advanced power electronics
- 3.2.1.4 Data center power optimization increasing MOSFET consumption
- 3.2.1.5 Fast-charging infrastructure expansion boosting wide-bandgap semiconductors
- 3.2.2 Industry pitfalls and challenges
- 3.2.2.1 High manufacturing cost of SiC and GaN devices
- 3.2.2.2 Supply chain dependence on limited wafer suppliers
- 3.2.3 Market opportunities
- 3.2.3.1 Adoption of SiC in 800V electric vehicle platforms
- 3.2.3.2 Smart grid upgrades increasing demand for high-power discrete devices
- 3.2.1 Growth drivers
- 3.3 Growth potential analysis
- 3.4 Regulatory landscape
- 3.4.1 North America
- 3.4.2 Europe
- 3.4.3 Asia Pacific
- 3.4.4 Latin America
- 3.4.5 Middle East & Africa
- 3.5 Porter's analysis
- 3.6 PESTEL analysis
- 3.7 Technology and Innovation landscape
- 3.7.1 Current technological trends
- 3.7.2 Emerging technologies
- 3.8 Price trends
- 3.8.1 By region
- 3.8.2 By product
- 3.9 Pricing Strategies
- 3.10 Emerging Business Models
- 3.11 Compliance Requirements
- 3.12 Patent and IP analysis
Chapter 4 Competitive Landscape, 2025
- 4.1 Introduction
- 4.2 Company market share analysis
- 4.2.1 By region
- 4.2.1.1 North America
- 4.2.1.2 Europe
- 4.2.1.3 Asia Pacific
- 4.2.1.4 Latin America
- 4.2.1.5 Middle East & Africa
- 4.2.2 Market concentration analysis
- 4.2.1 By region
- 4.3 Competitive benchmarking of key players
- 4.3.1 Financial performance comparison
- 4.3.1.1 Revenue
- 4.3.1.2 Profit margin
- 4.3.1.3 R&D
- 4.3.2 Product portfolio comparison
- 4.3.2.1 Product range breadth
- 4.3.2.2 Technology
- 4.3.2.3 Innovation
- 4.3.3 Geographic presence comparison
- 4.3.3.1 Global footprint analysis
- 4.3.3.2 Service network coverage
- 4.3.3.3 Market penetration by region
- 4.3.4 Competitive positioning matrix
- 4.3.4.1 Leaders
- 4.3.4.2 Challengers
- 4.3.4.3 Followers
- 4.3.4.4 Niche players
- 4.3.5 Strategic outlook matrix
- 4.3.1 Financial performance comparison
- 4.4 Key developments
- 4.4.1 Mergers and acquisitions
- 4.4.2 Partnerships and collaborations
- 4.4.3 Technological advancements
- 4.4.4 Expansion and investment strategies
- 4.4.5 Digital transformation initiatives
- 4.5 Emerging/ startup competitors landscape
Chapter 5 Market Estimates and Forecast, By Technology Type, 2022 - 2035 (USD Million)
- 5.1 Key trends
- 5.2 High-energy laser (HEL)
- 5.2.1 Solid-state lasers
- 5.2.2 Fiber Lasers
- 5.3 High-power microwave (HPM)
- 5.3.1 Narrow-band HPM
- 5.3.2 Wide-band HPM
- 5.4 Emerging technologies
Chapter 6 Market Estimates and Forecast, By Platform Type, 2022 - 2035 (USD Million)
- 6.1 Key trends
- 6.2 Ground-based systems
- 6.2.1 Mobile/transportable systems
- 6.2.2 Fixed installations
- 6.3 Naval/maritime systems
- 6.3.1 Ship-mounted systems
- 6.3.2 Coastal/port defense systems
- 6.4 Airborne systems
- 6.4.1 UAV-mounted systems
- 6.4.2 Aircraft-integrated system
Chapter 7 Market Estimates and Forecast, By Power Output, 2022 - 2035 (USD Million)
- 7.1 Key trends
- 7.2 Low power (<10 kW)
- 7.3 Medium power (10-50 kW)
- 7.4 High power (>50 kW)
Chapter 8 Market Estimates and Forecast, By Application, 2022 - 2035 (USD Million)
- 8.1 Key trends
- 8.2 Military & Defense Operations
- 8.2.1 Base Defense
- 8.2.2 Battlefield Use
- 8.2.3 Strategic Asset Protection
- 8.3 Border & Perimeter Security
- 8.4 Critical Infrastructure Protection
- 8.4.1 Airports
- 8.4.2 Ports & Maritime
- 8.4.3 Energy & Utilities
- 8.4.4 Government Facilities
- 8.5 Civil & Commercial Security
- 8.5.1 Public Events & Stadiums
- 8.5.2 Corporate & Industrial Sites
Chapter 9 Market Estimates and Forecast, By Region, 2022 - 2035 (USD Million)
- 9.1 Key trends
- 9.2 North America
- 9.2.1 U.S.
- 9.2.2 Canada
- 9.3 Europe
- 9.3.1 Germany
- 9.3.2 UK
- 9.3.3 France
- 9.3.4 Spain
- 9.3.5 Italy
- 9.3.6 Russia
- 9.4 Asia Pacific
- 9.4.1 China
- 9.4.2 India
- 9.4.3 Japan
- 9.4.4 Australia
- 9.4.5 South Korea
- 9.5 Latin America
- 9.5.1 Brazil
- 9.5.2 Mexico
- 9.5.3 Argentina
- 9.6 Middle East and Africa
- 9.6.1 South Africa
- 9.6.2 Saudi Arabia
- 9.6.3 UAE
Chapter 10 Company Profiles
- 10.1 Global Key Players
- 10.1.1 Lockheed Martin
- 10.1.2 Raytheon (RTX)
- 10.1.3 Rafael
- 10.1.4 Elbit Systems
- 10.1.5 Northrop Grumman
- 10.2 Regional key players
- 10.2.1 North America
- 10.2.1.1 Boeing
- 10.2.1.2 L3Harris
- 10.2.1.3 General Atomics
- 10.2.1.4 Kratos
- 10.2.2 Europe
- 10.2.2.1 BAE Systems
- 10.2.2.2 Leonardo
- 10.2.2.3 Thales
- 10.2.2.4 Rheinmetall
- 10.2.2.5 QinetiQ
- 10.2.1 North America
- 10.3 Niche Players/Disruptors
- 10.3.1 Epirus


