

 |
市場調查報告書
商品編碼
2045857
2026 年至 2035 年二手電子產品的市場機會、成長要素、產業趨勢與預測。Second-hand Electronic Products Market Opportunity, Growth Drivers, Industry Trend Analysis, and Forecast 2026 - 2035 |
||||||
2025年全球二手電子產品市場價值1,395億美元,預計2035年將以7.2%的複合年成長率成長至2,869億美元。
推動該行業成長的因素包括消費者日益增強的環境永續性意識以及減少全球電子廢棄物的迫切需求。二手電子產品的日益普及與循環經濟的原則高度契合,促進了產品的再利用和生命週期的延長。此外,價格優勢仍然是成長要素,因為二手電子產品能夠以更低的價格提供先進技術,使其成為注重預算的消費者的理想選擇。政府推行的鼓勵電子產品回收、再利用和負責任處置的措施也進一步促進了市場擴張。數位市場的擴展和二手交易生態系統的完善,使得消費者能夠更便利、更可靠、更透明地買賣二手電子產品。隨著環保意識的增強和經濟效益的提升,已開發市場和新興市場對二手電子產品的需求持續成長,推動市場走上永續的長期成長軌道。
| 市場範圍 | |
|---|---|
| 開始年份 | 2025 |
| 預測期 | 2026-2035 |
| 上市時的市場規模 | 1395億美元 |
| 預測金額 | 2869億美元 |
| 複合年成長率 | 7.2% |
預計到2025年,智慧型手機和平板電腦市場規模將達到857億美元,並在2035年之前以7.5%的複合年成長率成長。由於消費者對成本績效行動裝置的強勁需求以及翻新智慧型手機日益普及,該市場持續保持主導地位。品質認證流程的改進和檢驗的二手設備供應量的增加也增強了消費者的信心。此外,數位轉售管道的擴張使得消費者更容易獲得價格實惠的行動設備,進一步推動了該細分市場的成長。
預計2026年至2035年間,線上分銷通路將以7.6%的複合年成長率成長。這一領域的成長主要得益於網路普及率的提高以及透過數位平台購買翻新電子產品的便利性。消費者,尤其是年輕一代,對線上交易的偏好日益增強,進一步加速了線上管道的普及。專注於二手電子產品的電器平台也提高了產品供應量,增強了價格透明度,並擴大了市場准入範圍。
美國二手電子產品市場佔據84%的市場佔有率,預計2025年市場規模將達到447億美元。推動美國市場成長的主要因素是消費者對永續性和翻新電子產品帶來的成本降低的高度關注。高普及率的數位技術和先進的電子商務基礎設施持續推動著市場的廣泛滲透。加州、德克薩斯州和紐約州等主要州的大規模消費群體,加上強勁的技術普及趨勢和成熟的二手交易生態系統,進一步促進了市場的強勁需求。
目錄
第1章:調查方法和範圍
第2章執行摘要
第3章 行業洞察
- 產業生態系分析
- 供應商情況
- 利潤率
- 每個階段增加的價值
- 影響價值鏈的因素
- 中斷
- 影響產業的因素
- 促進因素
- 產業潛在風險與挑戰
- 機會
- 成長潛力分析
- 未來市場趨勢
- 技術與創新展望
- 最新科技趨勢
- 新興技術
- 波特五力分析
- PESTLE分析
- 價格趨勢
- 對過去價格趨勢的分析
- 定價策略:按業務類型分類
- 監理框架
- 標準和認證
- 環境法規
- 出口和進口限制
- 貿易數據分析
- 進出口量及進口額趨勢
- 主要貿易路線及關稅的影響
- 人工智慧和生成式人工智慧對市場的影響
- 人工智慧正在改變傳統的經營模式。
- 按客戶群分類的生成式人工智慧用例和部署藍圖
- 風險、限制和監管考量
- 人工智慧驅動的智慧家庭生態系統的整合
- 目前分銷基礎設施和通路滲透情況
- 按地區與業態(現代零售與傳統零售)分類的通路覆蓋率
- 缺乏最後一公里基礎設施和不斷變化的管道
- 消費行為分析
- 購買模式
- 偏好分析
- 不同地區的消費行為差異
- 電子商務對購買決策的影響
第4章 競爭情勢
- 介紹
- 企業市佔率分析
- 企業矩陣分析
- 主要市場公司的競爭分析
- 競爭定位矩陣
- 主要進展
- 併購
- 夥伴關係和聯盟
- 新產品發布
- 業務拓展計劃
第5章 市場估算與預測:依產品類型分類,2022-2035年
- 智慧型手機和平板電腦
- 電腦和筆記型電腦
- 電視機和視訊設備
- 家用電器
- 相機和鏡頭
- 印表機和顯示器
- 其他(智慧型手錶和穿戴式裝置等)
第6章 市場估價與預測:依維修類型分類,2022-2035年
- 經認證的翻新產品
- 賣家提供的翻新商品
- 已開啟
- 二手
第7章 市場估計與預測:依最終用戶分類,2022-2035年
- 個人消費者
- 企業和商業採購商
- 公司/企業
- 中小企業
- 經銷商和零售商
- 教育機構
第8章 市場估算與預測:依通路分類,2022-2035年
- 線上
- 電子商務
- 企業網站
- 離線
- 翻新產品直營店
- 專業零售店
- 其他(例如,電子產品量販店)
第9章 市場估計與預測:依地區分類,2022-2035年
- 北美洲
- 美國
- 加拿大
- 歐洲
- 德國
- 英國
- 法國
- 西班牙
- 義大利
- 荷蘭
- 亞太地區
- 中國
- 日本
- 印度
- 澳洲
- 韓國
- 拉丁美洲
- 巴西
- 墨西哥
- 阿根廷
- 中東和非洲
- 南非
- 沙烏地阿拉伯
- UAE
第10章:公司簡介
- 全球主要公司
- Amazon Renewed
- Apple Certified Refurbished
- Back Market
- Dell Refurbished(Dell Outlet)
- HP Renew
- Lenovo Outlet
- Samsung Certified Re-Newed
- 當地公司
- 2ndgear
- Cashify
- CEX(Complete Entertainment eXchange)
- Orchard
- reBuy
- Recommerce Group
- Swappa
- 新興企業和專業公司
- AT&T Certified Restored
- Loop Mobile
- Newegg Refreshed
- OWC(Other World Computing)
- Raylo
- Reboxed
- Renewd
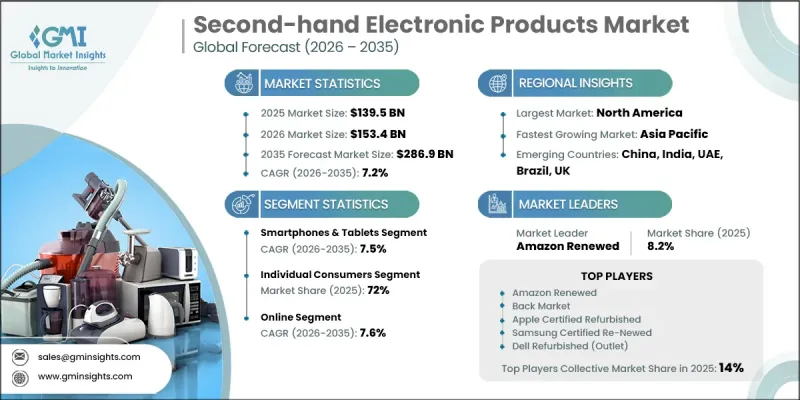
The Global Second-Hand Electronic Products Market was valued at USD 139.5 billion in 2025 and is estimated to grow at a CAGR of 7.2% to reach USD 286.9 billion by 2035.
Growth in this industry is driven by increasing consumer awareness of environmental sustainability and the urgent need to reduce electronic waste worldwide. The rising adoption of pre-owned electronic devices aligns strongly with circular economy principles, encouraging reuse and extending product lifecycles. In addition, affordability remains a major growth driver, as second-hand electronics provide access to advanced technology at significantly lower prices, making them attractive for budget-conscious consumers. Government initiatives promoting recycling, reuse, and responsible disposal of electronic products are further supporting market expansion. Expanding digital marketplaces and improved resale ecosystems are also making it easier for consumers to buy and sell used electronics with greater trust and transparency. Growing environmental consciousness, combined with financial practicality, continues to strengthen demand across both developed and emerging economies, positioning the market for sustained long-term growth.
| Market Scope | |
|---|---|
| Start Year | 2025 |
| Forecast Year | 2026-2035 |
| Start Value | $139.5 Billion |
| Forecast Value | $286.9 Billion |
| CAGR | 7.2% |
The smartphones and tablets segment accounted for USD 85.7 billion in 2025 and is projected to grow at a CAGR of 7.5% through 2035. This segment remains dominant due to strong consumer preference for cost-effective mobile devices and increasing acceptance of refurbished smartphones. Improvements in quality certification processes and the availability of verified pre-owned devices have strengthened buyer confidence. The expansion of digital resale channels has also made it easier for consumers to access a wide range of affordable mobile devices, further supporting segment growth.
The online distribution channel is expected to grow at a CAGR of 7.6% from 2026 to 2035. Growth in this segment is supported by rising internet penetration and the convenience of purchasing refurbished electronics through digital platforms. Increasing consumer preference for online transactions, particularly among younger demographics, is further accelerating adoption. The growing specialization of e-commerce platforms focused exclusively on pre-owned electronics is also enhancing product availability, improving price transparency, and strengthening overall market accessibility.
United States Second-Hand Electronic Products Market held an 84% share, generating USD 44.7 billion in 2025. Market growth in the country is supported by strong consumer awareness regarding sustainability and cost savings associated with refurbished electronics. High levels of digital adoption and advanced e-commerce infrastructure continue to facilitate widespread market penetration. Large consumer populations in key states such as California, Texas, and New York further contribute to strong demand, supported by robust technology adoption trends and established resale ecosystems.
Major companies operating in the Global Second-Hand Electronic Products Market include Amazon Renewed, Apple Certified Refurbished, Back Market, Dell Technologies (Dell Refurbished/Dell Outlet), HP Inc. (HP Renew), Lenovo (Lenovo Outlet), Samsung Electronics (Samsung Certified Re-Newed), Cashify, CEX, Swappa, Recommerce Group, Newegg (Refreshed segment), and other regional and niche players operating across resale and refurbishment ecosystems. Companies in the second-hand electronic products market are increasingly focusing on strengthening refurbishment capabilities and expanding certified pre-owned programs to build consumer trust and ensure product reliability. Leading players are investing in advanced testing, grading, and quality assurance systems to standardize device conditions and improve transparency in resale transactions. Many firms are expanding digital marketplace platforms and enhancing user experience through seamless buying, selling, and exchange processes. Strategic partnerships with logistics providers are improving reverse supply chain efficiency and enabling faster product turnaround cycles. Companies are also adopting sustainability-focused branding strategies to align with environmental goals and attract eco-conscious consumers.
Table of Contents
Chapter 1 Methodology and scope
- 1.1 Research approach
- 1.2 Quality Commitments
- 1.2.1 GMI AI policy & data integrity commitment
- 1.2.1.1 Source consistency protocol
- 1.2.1 GMI AI policy & data integrity commitment
- 1.3 Research Trail & Confidence Scoring
- 1.3.1 Research Trail Components
- 1.3.2 Scoring Components
- 1.4 Data Collection
- 1.4.1 Partial list of primary sources
- 1.5 Data mining sources
- 1.5.1 Paid sources
- 1.5.1.1 Sources, by region
- 1.5.1 Paid sources
- 1.6 Base estimates and calculations
- 1.6.1 Base year calculation for any one approach
- 1.7 Forecast model
- 1.7.1 Quantified market impact analysis
- 1.7.1.1 Mathematical impact of growth parameters on forecast
- 1.7.1 Quantified market impact analysis
- 1.8 Research transparency addendum
- 1.8.1 Source attribution framework
- 1.8.2 Quality assurance metrics
- 1.8.3 Our commitment to trust
Chapter 2 Executive summary
- 2.1 Industry 360° synopsis
- 2.2 Key market trends
- 2.2.1 Regional
- 2.2.2 Product Type
- 2.2.3 Refurbishment Type
- 2.2.4 End User
- 2.2.5 Distribution Channel
Chapter 3 Industry insights
- 3.1 Industry ecosystem analysis
- 3.1.1 Supplier landscape
- 3.1.2 Profit margin
- 3.1.3 Value addition at each stage
- 3.1.4 Factor affecting the value chain
- 3.1.5 Disruptions
- 3.2 Industry impact forces
- 3.2.1 Growth drivers
- 3.2.2 Industry pitfalls & challenges
- 3.2.3 Opportunities
- 3.3 Growth potential analysis
- 3.4 Future market trends
- 3.5 Technology and innovation landscape
- 3.5.1 Current technological trends
- 3.5.2 Emerging technologies
- 3.6 Porter's five forces analysis
- 3.7 PESTEL analysis
- 3.8 Price trends
- 3.8.1 Historical price trend analysis
- 3.8.2 Pricing strategy by player type
- 3.9 Regulatory framework
- 3.9.1 Standards and certifications
- 3.9.2 Environmental regulations
- 3.9.3 Import export regulations
- 3.10 Trade data analysis (HS Code:8528)
- 3.10.1 Import/export volume & value trends
- 3.10.2 Key trade corridors & tariff impact
- 3.11 Impact of AI & generative ai on the market
- 3.11.1 AI-driven disruption of traditional business models
- 3.11.2 GenAI use cases & adoption roadmap by customer segment
- 3.11.3 Risks, limitations & regulatory considerations
- 3.11.4 AI-enabled smart home ecosystem integration
- 3.12 Distribution infrastructure & channel penetration landscape
- 3.12.1 Channel coverage by region & format (modern vs. Traditional trade)
- 3.12.2 Last-mile infrastructure gaps & emerging channel shifts
- 3.13 Consumer behavior analysis
- 3.13.1 Purchasing patterns
- 3.13.2 Preference analysis
- 3.13.3 Regional variations in consumer behavior
- 3.13.4 Impact of e-commerce on buying decisions
Chapter 4 Competitive landscape, 2025
- 4.1 Introduction
- 4.2 Company market share analysis
- 4.2.1 North America
- 4.2.2 Europe
- 4.2.3 Asia Pacific
- 4.2.4 Latin America
- 4.2.5 MEA
- 4.3 Company matrix analysis
- 4.4 Competitive analysis of major market players
- 4.5 Competitive positioning matrix
- 4.6 Key developments
- 4.6.1 Mergers & acquisitions
- 4.6.2 Partnerships & collaborations
- 4.6.3 New product launches
- 4.6.4 Expansion plans
Chapter 5 Market Estimates & Forecast, By Product Type, 2022 - 2035 ($Billion, Million Units)
- 5.1 Key trends
- 5.2 Smartphones & tablets
- 5.3 Computers & laptops
- 5.4 TVs & audio-video devices
- 5.5 Home appliances
- 5.6 Cameras & lenses
- 5.7 Printers & monitors
- 5.8 Others (smartwatches & wearables etc.)
Chapter 6 Market Estimates & Forecast, By Refurbishment Type, 2022 - 2035 ($Billion, Million Units)
- 6.1 Key trends
- 6.2 Certified refurbished
- 6.3 Seller refurbished
- 6.4 Open box
- 6.5 Pre-owned
Chapter 7 Market Estimates & Forecast, By End User, 2022 - 2035 ($Billion, Million Units)
- 7.1 Key trends
- 7.2 Individual consumers
- 7.3 Commercial/business buyers
- 7.3.1 Enterprises & corporations
- 7.3.2 Small & medium businesses (SMBs)
- 7.3.3 Resellers & retailers
- 7.3.4 Educational institutions
Chapter 8 Market Estimates & Forecast, By Distribution Channel, 2022 - 2035 ($Billion, Million Units)
- 8.1 Key trends
- 8.2 Online
- 8.2.1 E-commerce
- 8.2.2 Company websites
- 8.3 Offline
- 8.3.1 Refurbished direct outlets
- 8.3.2 Specialty retail stores
- 8.3.3 Others (electronics shops etc.)
Chapter 9 Market Estimates & Forecast, By Region, 2022 - 2035 ($Billion, Million Units)
- 9.1 Key trends
- 9.2 North America
- 9.2.1 U.S.
- 9.2.2 Canada
- 9.3 Europe
- 9.3.1 Germany
- 9.3.2 UK
- 9.3.3 France
- 9.3.4 Spain
- 9.3.5 Italy
- 9.3.6 Netherlands
- 9.4 Asia Pacific
- 9.4.1 China
- 9.4.2 Japan
- 9.4.3 India
- 9.4.4 Australia
- 9.4.5 South Korea
- 9.5 Latin America
- 9.5.1 Brazil
- 9.5.2 Mexico
- 9.5.3 Argentina
- 9.6 MEA
- 9.6.1 South Africa
- 9.6.2 Saudi Arabia
- 9.6.3 UAE
Chapter 10 Company Profiles
- 10.1 Global Key Players
- 10.1.1 Amazon Renewed
- 10.1.2 Apple Certified Refurbished
- 10.1.3 Back Market
- 10.1.4 Dell Refurbished (Dell Outlet)
- 10.1.5 HP Renew
- 10.1.6 Lenovo Outlet
- 10.1.7 Samsung Certified Re-Newed
- 10.2 Regional Players
- 10.2.1 2ndgear
- 10.2.2 Cashify
- 10.2.3 CEX (Complete Entertainment eXchange)
- 10.2.4 Orchard
- 10.2.5 reBuy
- 10.2.6 Recommerce Group
- 10.2.7 Swappa
- 10.3 Emerging/Niche Specialists
- 10.3.1 AT&T Certified Restored
- 10.3.2 Loop Mobile
- 10.3.3 Newegg Refreshed
- 10.3.4 OWC (Other World Computing)
- 10.3.5 Raylo
- 10.3.6 Reboxed
- 10.3.7 Renewd


