


 |
市場調查報告書
商品編碼
2045832
支撐劑市場機會、成長要素、產業趨勢分析及2026-2035年預測。Proppants Market Opportunity, Growth Drivers, Industry Trend Analysis, and Forecast 2026 - 2035 |
||||||
2025年全球丙烷市場價值為105億美元,預計到2035年將以7.4%的複合年成長率成長至204億美元。
全球水力壓裂活動的增加,尤其是在傳統型油氣主要產區,並持續推動對丙烷的強勁需求。丙烷在維持壓裂井的導流能力和提高油氣開採效率方面發揮著至關重要的作用。持續的技術創新正在推動開發出強度更高、導流性更強的丙烷材料,這些材料能夠承受嚴苛的作業環境,從而進一步提升產品性能。全球能源消耗的成長以及對提高生產效率的日益重視也在加速市場擴張。然而,該行業仍面臨與水力壓裂作業相關的環境問題和嚴格法律規範帶來的挑戰。對用水量、潛在地下水污染和誘發地震活動的擔憂,促使一些地區監管機構實施了更嚴格的作業標準和限制。這些法規增加了市場參與企業的合規成本,並限制了企業在環境敏感地區的業務擴張機會。因此,製造商正日益致力於開發更清潔、更永續的丙烷解決方案,以滿足不斷變化的環境標準,同時支援高效的能源開採作業。
| 市場範圍 | |
|---|---|
| 開始年份 | 2025 |
| 預測期 | 2026-2035 |
| 上市時的市場規模 | 105億美元 |
| 預測市場規模 | 204億美元 |
| 複合年成長率 | 7.4% |
預計到2025年,壓裂砂市佔率將達到55%,並在2035年之前以7.3%的複合年成長率成長。頁岩砂憑藉其成本效益高、供應充足以及適用於頁岩地層大規模水力壓裂作業等優勢,持續保持市場主導地位。開採作業、加工技術和供應鏈物流的不斷改進,進一步鞏固了壓裂砂的市場地位。其支持大量傳統型油氣開採的能力,持續推動整個產業的廣泛應用。
預計到2025年,20/40目規格的壓裂材料將佔據38.8%的市場佔有率,並在2026年至2035年間以7.3%的複合年成長率成長。由於其在強度、滲透性和大規模水力壓裂作業中的操作效率方面表現出色,該目數規格的壓裂材料正日益受到石油和天然氣行業的青睞。營運商尋求在高壓條件下提高生產性能和增強壓裂孔導流能力,因此對這種材料的需求持續成長。可靠的輸送特性和有效維持壓裂孔開口的能力進一步推動了20/40目丙烷壓裂材料在整體能源開採應用中的廣泛應用。
預計到2025年,北美丙烷市佔率將達到38.7%,並繼續崛起為全球最重要的區域市場之一。該地區市場成長的驅動力主要來自廣泛的傳統型油氣探勘活動以及先進水力壓裂技術的積極應用。高效的供應鏈基礎設施、壓裂砂品質的提升以及運輸和物流運營的進步,進一步鞏固了北美丙烷行業的地位。持續投資於能源生產和開採效率的提升,將為該地區市場的長期成長提供支持。
目錄
第1章:調查方法和範圍
第2章執行摘要
第3章 行業洞察
- 產業生態系分析
- 供應商情況
- 利潤率
- 每個階段增加的價值
- 影響價值鏈的因素
- 中斷
- 影響產業的因素
- 促進因素
- 水力壓裂活動增加
- 技術進步
- 人們對天然氣的關注度正在提高。
- 產業潛在風險與挑戰
- 環境問題和監管挑戰
- 石油和天然氣價格的波動正在影響鑽探活動。
- 市場機遇
- 新興市場頁岩氣開發的擴張
- 輕質高導電性丙烷的開發
- 促進因素
- 成長潛力分析
- 監理情勢
- 北美洲
- 歐洲
- 亞太地區
- 拉丁美洲
- 中東和非洲
- 波特的分析
- PESTLE分析
- 價格趨勢
- 按地區
- 按類型
- 未來市場趨勢
- 技術與創新展望
- 最新科技趨勢
- 新興技術
- 專利趨勢
- 貿易統計
- 主要進口國
- 主要出口國
- 永續性和環境方面
- 永續計劃
- 減少廢棄物策略
- 生產中的能源效率
- 具有環保意識的舉措
- 考慮碳足跡
第4章 競爭情勢
- 介紹
- 企業市佔率分析
- 按地區
- 北美洲
- 歐洲
- 亞太地區
- LATAM
- 中東和非洲
- 按地區
- 企業矩陣分析
- 主要市場公司的競爭分析
- 競爭定位矩陣
- 主要進展
- 併購
- 夥伴關係和聯盟
- 新產品發布
- 業務拓展計劃
第5章 市場估計與預測:依類型分類,2022-2035年
- 壓裂砂
- 樹脂塗層丙烷
- 陶瓷丙烷
第6章 市場估計與預測:依網目尺寸分類,2022-2035年
- 20/40目
- 30/50目
- 40/70目
- 其他(細、粗)
第7章 市場估計與預測:依應用領域分類,2022-2035年
- 頁岩氣
- 緻密氣
- 煤炭層氣
- 其他(包括緻密油、深層天然氣等)
第8章 市場估算與預測:依陶瓷類型分類,2022-2035年
- 高強度陶瓷丙烷
- 中等強度陶瓷丙烷
- 輕質陶瓷丙烷
- 其他
第9章 市場估計與預測:依地區分類,2022-2035年
- 北美洲
- 美國
- 加拿大
- 歐洲
- 德國
- 英國
- 法國
- 西班牙
- 義大利
- 其他歐洲國家
- 亞太地區
- 中國
- 印度
- 日本
- 澳洲
- 韓國
- 其他亞太國家
- 拉丁美洲
- 巴西
- 墨西哥
- 阿根廷
- 其他拉丁美洲國家
- 中東和非洲
- 沙烏地阿拉伯
- 南非
- UAE
- 其他中東和非洲國家
第10章:公司簡介
- CARBO Ceramics Inc.
- US Silica Holdings Inc.
- Covia Holdings LLC
- Saint-Gobain Proppants
- Hexion Inc.
- Badger Mining Corporation
- Hi-Crush Inc.
- China GengSheng Minerals, Inc.
- ChangQing Proppant
- Emerge Energy Services LP(Superior Silica Sands)
- Preferred Sands LLC
- CoorsTek Inc.
- Atlas Sand Company, LLC
- Fores LTD
- Xinmi Wanli Industry Development Co., Ltd.
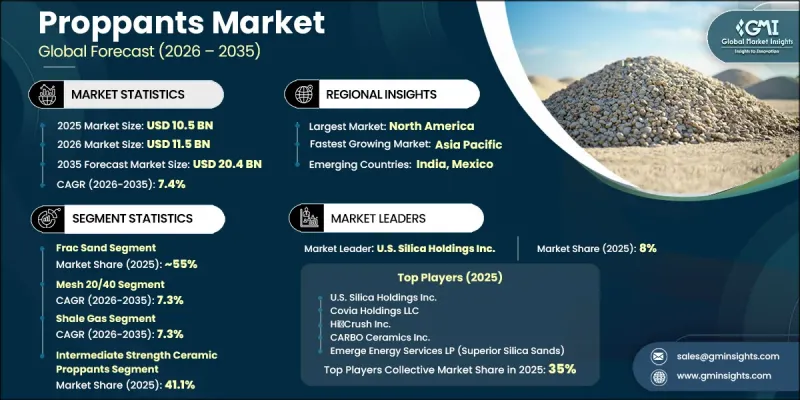
The Global Proppants Market was valued at USD 10.5 billion in 2025 and is estimated to grow at a CAGR of 7.4% to reach USD 20.4 billion by 2035.
Rising hydraulic fracturing activities worldwide, particularly across major unconventional oil and gas producing regions, continue to drive strong demand for proppants. These materials play a critical role in maintaining fracture conductivity and improving hydrocarbon recovery efficiency during extraction operations. Continuous technological advancements are further enhancing product performance through the development of stronger and higher-conductivity proppant materials capable of supporting demanding operational environments. Growing global energy consumption and increasing focus on maximizing production efficiency are also accelerating market expansion. At the same time, industry continues to face challenges associated with environmental concerns and strict regulatory oversight related to hydraulic fracturing operations. Concerns surrounding water consumption, potential groundwater contamination, and induced seismic activity have led regulatory authorities in several regions to introduce tighter operational standards and restrictions. These regulations are increasing compliance costs for market participants and limiting expansion opportunities in environmentally sensitive areas. As a result, manufacturers are placing greater emphasis on developing cleaner, more sustainable proppant solutions that align with evolving environmental standards while supporting efficient energy extraction operations.
| Market Scope | |
|---|---|
| Start Year | 2025 |
| Forecast Year | 2026-2035 |
| Start Value | $10.5 Billion |
| Forecast Value | $20.4 Billion |
| CAGR | 7.4% |
The frac sand segment accounted for a 55% share in 2025 and is expected to grow at a CAGR of 7.3% through 2035. The segment continues to maintain a dominant position due to its cost-effectiveness, widespread availability, and suitability for large-scale hydraulic fracturing operations across shale formations. Ongoing improvements in mining operations, processing technologies, and supply chain logistics have further strengthened the market position of frac sand. Its ability to support high-volume unconventional oil and gas extraction activities continues to drive strong adoption across the industry.
The mesh 20/40 category held a 38.8% share in 2025, and is forecast to grow at a CAGR of 7.3% between 2026 and 2035. This mesh size has become widely preferred across the oil and gas industry because it offers an effective balance between strength, permeability, and operational efficiency during high-volume hydraulic fracturing activities. The material continues to gain strong demand among operators seeking improved production performance and enhanced fracture conductivity under high-pressure conditions. Reliable transport characteristics and the ability to maintain fracture openings effectively further support the widespread adoption of mesh 20/40 proppants across energy extraction applications.
North America Proppants Market held a 38.7% share in 2025 and continues to emerge as one of the most significant regional markets worldwide. Market growth across the region is supported by extensive unconventional oil and gas exploration activities and strong adoption of advanced hydraulic fracturing technologies. Efficient supply chain infrastructure, continuous improvements in frac sand quality, and advancements in transportation and logistics operations are further strengthening the North America proppants industry. Ongoing investments in energy production and extraction efficiency continue to support long-term regional market growth.
Major companies operating in the Global Proppants Market include CARBO Ceramics Inc., U.S. Silica Holdings Inc., Covia Holdings LLC, Saint Gobain Proppants, Hexion Inc., Badger Mining Corporation, Hi Crush Inc., China GengSheng Minerals, Inc., ChangQing Proppant, Emerge Energy Services LP (Superior Silica Sands), Preferred Sands LLC, CoorsTek Inc., Atlas Sand Company, LLC, Fores LTD, and Xinmi Wanli Industry Development Co., Ltd. Companies operating in the proppants market are implementing several strategic initiatives to strengthen market share and improve competitive positioning across global energy industries. Leading manufacturers are investing in advanced product development focused on improving proppant strength, conductivity, and operational durability to support high-efficiency hydraulic fracturing applications. Many companies are also expanding mining and processing capacities to meet rising demand from unconventional oil and gas projects. Strategic partnerships with energy producers and logistics providers are helping businesses optimize supply chain efficiency and reduce transportation costs. In addition, market participants are focusing on environmentally sustainable solutions by developing cleaner production methods and eco-friendly proppant materials that comply with evolving environmental regulations.
Table of Contents
Chapter 1 Methodology & Scope
- 1.1 Market scope and definition
- 1.2 Research design
- 1.2.1 Research approach
- 1.2.2 Data collection methods
- 1.3 Data mining sources
- 1.3.1 Global
- 1.3.2 Regional/Country
- 1.4 Base estimates and calculations
- 1.4.1 Base year calculation
- 1.4.2 Key trends for market estimation
- 1.5 Primary research and validation
- 1.5.1 Primary sources
- 1.6 Forecast model
- 1.7 Research assumptions and limitations
Chapter 2 Executive Summary
- 2.1 Industry 360° synopsis
- 2.2 Key market trends
- 2.2.1 Regional
- 2.2.2 Type
- 2.2.3 Mesh Size
- 2.2.4 Application
- 2.2.5 Ceramic
- 2.3 TAM Analysis, 2026-2035
- 2.4 CXO perspectives: Strategic imperatives
- 2.4.1 Executive decision points
- 2.4.2 Critical success factors
- 2.5 Future Outlook and Strategic Recommendations
Chapter 3 Industry Insights
- 3.1 Industry ecosystem analysis
- 3.1.1 Supplier landscape
- 3.1.2 Profit margin
- 3.1.3 Value addition at each stage
- 3.1.4 Factor affecting the value chain
- 3.1.5 Disruptions
- 3.2 Industry impact forces
- 3.2.1 Growth drivers
- 3.2.1.1 Increased hydraulic fracturing activities
- 3.2.1.2 Technological advancements
- 3.2.1.3 Rising focus on natural gas
- 3.2.2 Industry pitfalls and challenges
- 3.2.2.1 Environmental concerns and regulatory challenges
- 3.2.2.2 Volatile oil & gas prices impacting drilling activity
- 3.2.3 Market opportunities
- 3.2.3.1 Expansion of shale gas development in emerging markets
- 3.2.3.2 Development of lightweight & ultra conductive proppants
- 3.2.1 Growth drivers
- 3.3 Growth potential analysis
- 3.4 Regulatory landscape
- 3.4.1 North America
- 3.4.2 Europe
- 3.4.3 Asia Pacific
- 3.4.4 Latin America
- 3.4.5 Middle East & Africa
- 3.5 Porter's analysis
- 3.6 PESTEL analysis
- 3.7 Price trends
- 3.7.1 By region
- 3.7.2 By type
- 3.8 Future market trends
- 3.9 Technology and Innovation landscape
- 3.9.1 Current technological trends
- 3.9.2 Emerging technologies
- 3.10 Patent Landscape
- 3.11 Trade statistics (HS code)
- 3.11.1 Major importing countries
- 3.11.2 Major exporting countries
- 3.12 Sustainability and environmental aspects
- 3.12.1 Sustainable practices
- 3.12.2 Waste reduction strategies
- 3.12.3 Energy efficiency in production
- 3.12.4 Eco-friendly initiatives
- 3.13 Carbon footprint consideration
Chapter 4 Competitive Landscape, 2025
- 4.1 Introduction
- 4.2 Company market share analysis
- 4.2.1 By region
- 4.2.1.1 North America
- 4.2.1.2 Europe
- 4.2.1.3 Asia Pacific
- 4.2.1.4 LATAM
- 4.2.1.5 MEA
- 4.2.1 By region
- 4.3 Company matrix analysis
- 4.4 Competitive analysis of major market players
- 4.5 Competitive positioning matrix
- 4.6 Key developments
- 4.6.1 Mergers & acquisitions
- 4.6.2 Partnerships & collaborations
- 4.6.3 New Product Launches
- 4.6.4 Expansion Plans
Chapter 5 Market Estimates and Forecast, By Type, 2022-2035 (USD Billion) (Kilo Tons)
- 5.1 Key trends
- 5.2 Frac Sand
- 5.3 Resin-Coated Proppants
- 5.4 Ceramic Proppants
Chapter 6 Market Estimates and Forecast, By Mesh Size, 2022-2035 (USD Billion) (Kilo Tons)
- 6.1 Key trends
- 6.2 Mesh 20/40
- 6.3 Mesh 30/50
- 6.4 Mesh 40/70
- 6.5 Others (Fine Mesh, Coarse Mesh)
Chapter 7 Market Estimates and Forecast, By Application, 2022-2035 (USD Billion) (Kilo Tons)
- 7.1 Key trends
- 7.2 Shale Gas
- 7.3 Tight Gas
- 7.4 Coalbed Methane
- 7.5 Others (including tight oil, deep gas etc)
Chapter 8 Market Estimates and Forecast, By Ceramic, 2022-2035 (USD Billion) (Kilo Tons)
- 8.1 Key trends
- 8.2 High Strength Ceramic Proppants
- 8.3 Intermediate Strength Ceramic Proppants
- 8.4 Light Weight Ceramic Proppants
- 8.5 Others
Chapter 9 Market Estimates and Forecast, By Region, 2022-2035 (USD Billion) (Kilo Tons)
- 9.1 Key trends
- 9.2 North America
- 9.2.1 U.S.
- 9.2.2 Canada
- 9.3 Europe
- 9.3.1 Germany
- 9.3.2 UK
- 9.3.3 France
- 9.3.4 Spain
- 9.3.5 Italy
- 9.3.6 Rest of Europe
- 9.4 Asia Pacific
- 9.4.1 China
- 9.4.2 India
- 9.4.3 Japan
- 9.4.4 Australia
- 9.4.5 South Korea
- 9.4.6 Rest of Asia Pacific
- 9.5 Latin America
- 9.5.1 Brazil
- 9.5.2 Mexico
- 9.5.3 Argentina
- 9.5.4 Rest of Latin America
- 9.6 Middle East and Africa
- 9.6.1 Saudi Arabia
- 9.6.2 South Africa
- 9.6.3 UAE
- 9.6.4 Rest of Middle East and Africa
Chapter 10 Company Profiles
- 10.1 CARBO Ceramics Inc.
- 10.2 U.S. Silica Holdings Inc.
- 10.3 Covia Holdings LLC
- 10.4 Saint-Gobain Proppants
- 10.5 Hexion Inc.
- 10.6 Badger Mining Corporation
- 10.7 Hi-Crush Inc.
- 10.8 China GengSheng Minerals, Inc.
- 10.9 ChangQing Proppant
- 10.10 Emerge Energy Services LP (Superior Silica Sands)
- 10.11 Preferred Sands LLC
- 10.12 CoorsTek Inc.
- 10.13 Atlas Sand Company, LLC
- 10.14 Fores LTD
- 10.15 Xinmi Wanli Industry Development Co., Ltd.
 支撐劑市場報告:按產品類型、應用和地區分類(2026-2034 年)刺激材料市場報告:按類型、技術、應用和地區分類(2026-2034 年)
 支撐劑市場:2026-2032年全球市場預測(依支撐劑類型、塗層類型、粒徑、應用和最終用戶產業分類)
 全球支撐劑市場規模、佔有率、趨勢和成長分析報告(2026-2034年)
 支撐劑市場-全球產業規模、佔有率、趨勢、機會、預測:按類型、應用、地區和競爭格局分類,2021-2031年
 支撐劑市場規模、佔有率和成長分析(按類型、應用、最終用途產業和地區分類)-2026-2033年產業預測
 2025-2029年全球支撐劑市場
 北美支撐劑:市場佔有率分析、產業趨勢、成長預測(2025-2030)支撐劑 -市場佔有率分析、產業趨勢與統計、成長預測(2025-2030)
 支撐劑市場規模、佔有率、趨勢分析報告:按類型、應用、地區、細分市場預測,2024-2030