


 |
市場調查報告書
商品編碼
2045808
泵浦市場機會、成長要素、產業趨勢分析及2026-2035年預測。Pump Market Opportunity, Growth Drivers, Industry Trend Analysis, and Forecast 2026 - 2035 |
||||||
2025年全球泵浦市場價值為576億美元,預計2035年將達到925億美元,年複合成長率為4.9%。
隨著各行業和政府日益重視提高水資源永續性和資源管理水平,對用水和污水基礎設施的投資不斷增加,顯著推動了市場成長。泵浦在供水、污水處理、海水淡化和工業流體管理等應用中繼續發揮至關重要的作用。開發中國家快速的都市化和工業擴張進一步提升了各產業對先進泵浦系統的需求。石油天然氣、化學、發電和製造業等行業高度依賴泵浦進行流體輸送、冷卻、加熱和製程操作。此外,工業現代化、對節能系統投資的增加以及基礎設施建設也為市場的長期成長提供了支撐。促進永續技術和節能的監管措施也推動了高性能、高運作效率泵系統的應用。智慧泵系統、自動化和預測性維護解決方案的技術進步進一步加速了產品在全球工業和市政應用中的普及。
| 市場範圍 | |
|---|---|
| 開始年份 | 2025 |
| 預測期 | 2026-2035 |
| 初始市場規模 | 576億美元 |
| 預計金額 | 925億美元 |
| 複合年成長率 | 4.9% |
隨著企業日益重視提升流體管理營運整體的效率、可靠性和永續性,泵浦產業正經歷穩定轉型。日益嚴峻的水資源短缺和環境保護問題,正推動公共和私營部門對先進水處理基礎設施進行大量投資,從而持續推動對泵浦系統的需求。同時,新興經濟體的工業化進程不斷促進能源、製造和化學加工設施對泵浦的應用。政府加大投資以增強國內製造業能力、降低進口依賴,也為市場擴張做出了貢獻。此外,節能馬達技術和數位化監控系統的不斷進步,使操作人員能夠在降低能耗和維護成本的同時,最佳化運作性能。
預計到2025年,離心式幫浦市場規模將達到405億美元,並在2035年之前以5.2%的複合年成長率成長。用水和污水處理、石油天然氣和化工等行業的強勁需求持續推動全球離心式幫浦的成長。工業基礎設施的擴張和大規模水資源管理系統的日益普及是推動市場成長的主要因素。此外,節能泵技術的進步和新興經濟體工業發展的加速也進一步促進了該領域的成長。
預計到2025年,電動幫浦市佔率將達到75.2%,並在2026年至2035年間以5.3%的複合年成長率成長。工業化和城市發展推動了對具備可靠性、能源效率和運作柔軟性的電動幫浦的強勁需求。這些系統廣泛應用於各個工業領域,在這些領域,高效的流體處理解決方案對於維持運作性能至關重要,例如水處理、石油天然氣、化學和工業流程。
預計到2025年,美國泵浦市場將佔據77%的市場佔有率,市場規模將達到97億美元。美國市場的成長主要得益於強勁的工業活動和不斷擴大的基礎設施舉措。在這個製造業中心,汽車、化學和食品加工產業持續推動對工業泵浦的需求。此外,能源基礎設施和水資源管理系統投資的增加也推動了多個終端用戶產業對先進泵浦技術的應用。
目錄
第1章:調查方法和範圍
第2章執行摘要
第3章:行業洞察
- 工業生態系分析
- OEM整合商和系統供應商
- 製造商
- 每個階段增加的價值
- 影響價值鏈的因素
- 影響產業的因素
- 促進因素
- 產業潛在風險與挑戰
- 市場機遇
- 供應鏈分析
- 關鍵零件(馬達、密封件、控制系統)的採購
- 製造和組裝基地
- 客製化泵浦的前置作業時間
- 供應鏈風險和依賴性
- 北美和歐洲的回流趨勢
- 成長潛力分析
- 2025年價格分析
- 對過去價格趨勢的分析
- 定價策略:按業務類型分類
- 監理情勢
- 全球法規結構概述
- 北美法規環境
- FDA對醫用和製藥用泵浦的要求
- 美國環保署排放氣體與能源效率標準
- 符合ASME鍋爐及壓力容器標準
- UL 和 CSA 認證要求
- 歐洲法規環境
- 歐盟醫療設備法規(MDR 2017/745)
- ATEX關於爆炸性環境條件的指令
- 機械指令 2006/42/EC
- CE標誌及其符合性保證途徑
- 新的監管趨勢
- 能源效率法規(歐盟生態設計標準、美國能源部標準)
- 資料中心永續性法規
- 波特的分析
- PESTLE分析
- 技術與創新展望
- 最新科技趨勢
- 新技術
- 未來市場趨勢
- 貿易數據分析
- 進出口量及進口額趨勢
- 主要貿易路線及關稅的影響
- 按技術類型和產品類型的貿易趨勢
- 人工智慧和生成式人工智慧對市場的影響
- 利用人工智慧改造現有經營模式
- 基於細分市場的生成式人工智慧的應用案例和部署藍圖
- 風險、限制和監管考量
- 目前分銷基礎設施和通路滲透情況
- 以區域業態分類的通路覆蓋率(現代零售與傳統零售)
- 缺乏最後一公里基礎設施和不斷變化的管道
第4章 競爭情勢
- 介紹
- 企業市佔率分析
- 企業矩陣分析
- 主要市場公司的競爭分析
- 競爭定位矩陣
- 併購
- 夥伴關係和聯盟
- 新產品發布
- 業務拓展計劃
第5章 市場估算與預測:依泵浦類型分類,2022-2035年
- 離心式幫浦
- 單級離心式幫浦
- 多級離心式幫浦
- 分離式泵浦
- 其他(離心式幫浦等)
- 容積式泵
- 旋轉式容積泵
- 齒輪泵浦
- 螺旋泵
- 葉片泵
- LOBE泵
- 其他(例如,連續腔泵等)
- 往復式容積泵
- 活塞泵
- 柱塞泵
- 其他(隔膜泵等)
- 旋轉式容積泵
- 專用泵浦
- 真空幫浦
- 乾式真空幫浦
- 液封真空幫浦
- 其他(轉葉真空幫浦等)
- 低溫泵
- 蠕動幫浦
- 再生式渦輪泵
- 其他(噴射幫浦等)
- 真空幫浦
第6章 市場估算與預測:依動力來源,2022-2035年
- 電動幫浦
- 引擎驅動幫浦
- 柴油引擎驅動
- 由天然氣燃氣引擎驅動
- 氣壓和液壓驅動泵
- 其他(太陽能水泵等)
第7章 市場估計與預測:依最終用戶產業分類,2022-2035年
- 資料中心
- 半導體製造
- 暖通空調(溫度控制部分)
- 醫療保健
- 飲食
- 石油和天然氣
- 水和污水處理
- 其他(發電等)
第8章 市場估算與預測:依通路分類,2022-2035年
- 直銷
- 間接銷售
第9章 市場估計與預測:依地區分類,2022-2035年
- 北美洲
- 美國
- 加拿大
- 歐洲
- 德國
- 英國
- 法國
- 西班牙
- 義大利
- 荷蘭
- 亞太地區
- 中國
- 日本
- 印度
- 澳洲
- 韓國
- 拉丁美洲
- 巴西
- 墨西哥
- 阿根廷
- 中東和非洲
- 南非
- 沙烏地阿拉伯
- 阿拉伯聯合大公國
第10章:公司簡介
- 全球主要公司
- Alfa Laval
- Ebara
- Flowserve
- Grundfos
- IDEX
- Ingersoll Rand
- KSB Group
- 當地公司
- Kirloskar Brothers
- Pentair
- Sulzer
- Torishima Pump
- Weir
- Wilo
- Xylem
- 新興企業和專業公司
- Caprari
- Leo Group
- Patterson Pump
- Ruhrpumpen
- Sundyne
- Tapflo
- Verder
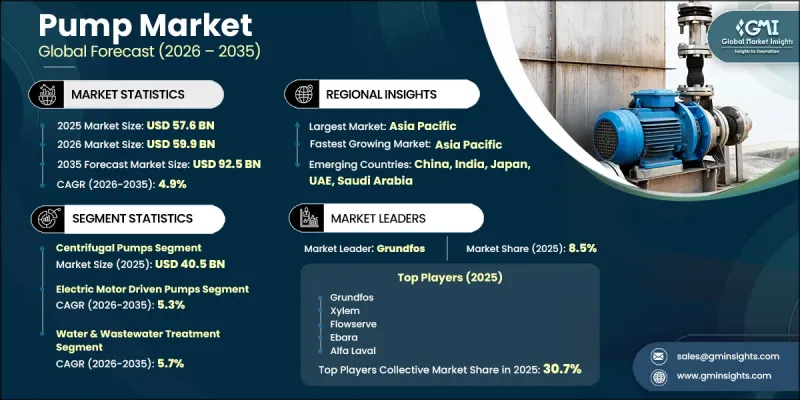
The Global Pump Market was valued at USD 57.6 billion in 2025 and is estimated to grow at a CAGR of 4.9% to reach USD 92.5 billion by 2035.
Rising investments in water and wastewater treatment infrastructure are significantly contributing to market growth as industries and governments focus on improving water sustainability and resource management. Pumps continue to play a vital role in applications involving water distribution, sewage handling, desalination, and industrial fluid management. Rapid urbanization and accelerating industrial expansion across developing economies are further increasing demand for advanced pumping systems across multiple industries. Sectors including oil and gas, chemicals, power generation, and manufacturing rely heavily on pumps for fluid transfer, cooling, heating, and process operations. In addition, growing investments in industrial modernization, energy-efficient systems, and infrastructure development are supporting long-term market expansion. Regulatory initiatives promoting sustainable technologies and energy conservation are also encouraging the adoption of high-performance pump systems with improved operational efficiency. Technological advancements in smart pumping systems, automation, and predictive maintenance solutions are further enhancing product adoption across industrial and municipal applications worldwide.
| Market Scope | |
|---|---|
| Start Year | 2025 |
| Forecast Year | 2026-2035 |
| Start Value | $57.6 Billion |
| Forecast Value | $92.5 Billion |
| CAGR | 4.9% |
The pump industry is witnessing a steady transformation as companies increasingly focus on improving efficiency, reliability, and sustainability across fluid management operations. Growing concerns related to water scarcity and environmental protection are encouraging both public and private organizations to invest heavily in advanced water treatment infrastructure, creating sustained demand for pumping systems. At the same time, industrialization across emerging economies continues to support the adoption of pumps in energy, manufacturing, and chemical processing facilities. Rising government investments aimed at strengthening domestic manufacturing capabilities and reducing import dependence are also contributing to market expansion. Additionally, ongoing advancements in energy-efficient motor technologies and digital monitoring systems are helping operators optimize operational performance while reducing energy consumption and maintenance costs.
The centrifugal pumps segment generated USD 40.5 billion in 2025 and is expected to witness a CAGR of 5.2% throughout 2035. Strong demand from industries such as water and wastewater treatment, oil and gas, and chemical processing continues to support the growth of centrifugal pumps globally. Expanding industrial infrastructure and increasing deployment of large-scale water management systems are major factors driving adoption. In addition, advancements in energy-efficient pump technologies and rising industrial development across emerging economies are further accelerating segment expansion.
The electric motor-driven pumps segment held 75.2% share in 2025 and is projected to grow at a CAGR of 5.3% from 2026 to 2035. Increasing industrialization and urban development are supporting a strong demand for electric motor-driven pumps due to their reliability, energy efficiency, and operational flexibility. These systems are widely utilized across industries, including water treatment, oil and gas, chemicals, and industrial processing, where efficient fluid handling solutions are essential for maintaining operational performance.
United States Pump Market accounted for 77% share, generating USD 9.7 billion in 2025. Market growth across the country is supported by strong industrial activity and expanding infrastructure development initiatives. Manufacturing-intensive regions continue to drive demand for industrial pumps across automotive, chemical, and food processing sectors. In addition, increasing investments in energy infrastructure and water management systems are contributing to higher adoption of advanced pump technologies across multiple end-use industries.
Major companies operating in the Global Pump Industry include Alfa Laval, Ebara, Flowserve, Grundfos, IDEX, Ingersoll Rand, KSB Group, Kirloskar Brothers, Pentair, Sulzer, Torishima Pump, Weir, Wilo, Xylem, Caprari, Leo Group, Patterson Pump, Ruhrpumpen, Sundyne, Tapflo, and Verder. Companies operating in the pump market are focusing on technological innovation, energy efficiency, and strategic expansion initiatives to strengthen their competitive position and increase market share. Leading manufacturers are investing heavily in research and development to introduce smart pumping systems equipped with digital monitoring, automation, and predictive maintenance capabilities. Many players are also prioritizing the development of energy-efficient products to comply with evolving environmental regulations and sustainability goals. Strategic partnerships, acquisitions, and regional expansions are helping companies strengthen distribution networks and improve customer reach across industrial and municipal sectors. In addition, businesses are enhancing aftermarket services, maintenance support, and customized fluid management solutions to build long-term customer relationships.
Table of Contents
Chapter 1 Methodology and scope
- 1.1 Research approach
- 1.2 Quality Commitments
- 1.2.1 GMI AI policy & data integrity commitment
- 1.2.1.1 Source consistency protocol
- 1.2.1 GMI AI policy & data integrity commitment
- 1.3 Research Trail & Confidence Scoring
- 1.3.1 Research Trail Components
- 1.3.2 Scoring Components
- 1.4 Data Collection
- 1.4.1 Partial list of primary sources
- 1.5 Data mining sources
- 1.5.1 Paid sources
- 1.5.1.1 Sources, by region
- 1.5.1 Paid sources
- 1.6 Base estimates and calculations
- 1.6.1 Base year calculation for any one approach
- 1.7 Forecast model
- 1.7.1 Quantified market impact analysis
- 1.7.1.1 Mathematical impact of growth parameters on forecast
- 1.7.1 Quantified market impact analysis
- 1.8 Research transparency addendum
- 1.8.1 Source attribution framework
- 1.8.2 Quality assurance metrics
- 1.8.3 Our commitment to trust
Chapter 2 Executive summary
- 2.1 Industry 360° synopsis
- 2.2 Key market trends
- 2.2.1 Regional
- 2.2.2 Pump type
- 2.2.3 Power source
- 2.2.4 End use industry
- 2.2.5 Distribution channel
Chapter 3 Industry insights
- 3.1 Industry ecosystem analysis
- 3.1.1 OEM integrators and system providers
- 3.1.2 Manufacturers
- 3.1.3 Value addition at each stage
- 3.1.4 Factor affecting the value chain
- 3.2 Industry impact forces
- 3.2.1 Growth drivers
- 3.2.2 Industry pitfalls & challenges
- 3.2.3 Market opportunities
- 3.3 Supply chain analysis
- 3.3.1 Critical component sourcing (motors, seals, control systems)
- 3.3.2 Manufacturing and assembly locations
- 3.3.3 Lead times for engineered specialty pumps
- 3.3.4 Supply chain risks and dependencies
- 3.3.5 Reshoring trends in North America and Europe
- 3.4 Growth potential analysis
- 3.5 Pricing analysis, 2025 (driven by primary research)
- 3.5.1 Historical price trend analysis
- 3.5.2 Pricing strategy by player type
- 3.6 Regulatory landscape
- 3.6.1 Global Regulatory Framework Overview
- 3.6.2 North America Regulatory Environment
- 3.6.2.1 FDA requirements for medical and pharmaceutical pumps
- 3.6.2.2 EPA emissions and energy efficiency standards
- 3.6.2.3 ASME Boiler & Pressure Vessel Code compliance
- 3.6.2.4 UL and CSA certification requirements
- 3.6.3 Europe Regulatory Environment
- 3.6.3.1 EU Medical Device Regulation (MDR 2017/745)
- 3.6.3.2 ATEX directives for explosive atmospheres
- 3.6.3.3 Machinery Directive 2006/42/EC
- 3.6.3.4 CE marking and compliance pathways
- 3.6.4 Emerging Regulatory Trends
- 3.6.4.1 Energy efficiency mandates (EU Ecodesign, US DOE standards)
- 3.6.4.2 Data center sustainability regulations
- 3.7 Porter's analysis
- 3.8 PESTEL analysis
- 3.9 Technological and innovation landscape
- 3.9.1 Current technological trends
- 3.9.2 Emerging technologies
- 3.10 Future market trends
- 3.11 Trade data analysis (driven by paid data base) (HS Code: 8413)
- 3.11.1 Import/export volume & value trends
- 3.11.2 Key trade corridors & tariff impact
- 3.11.3 Trade flow by technology type & product category
- 3.12 Impact of AI & generative ai on the market
- 3.12.1 AI-driven disruption of existing business models
- 3.12.2 GenAI use cases & adoption roadmap by segment
- 3.12.3 Risks, limitations & regulatory considerations
- 3.13 Distribution infrastructure & channel penetration landscape (driven by primary research)
- 3.13.1 Channel coverage by region & format (modern vs. traditional trade)
- 3.13.2 Last-mile infrastructure gaps & emerging channel shifts
Chapter 4 Competitive landscape, 2025
- 4.1 Introduction
- 4.2 Company market share analysis
- 4.2.1 North America
- 4.2.2 Europe
- 4.2.3 Asia Pacific
- 4.2.4 Latin America
- 4.2.5 MEA
- 4.3 Company matrix analysis
- 4.4 Competitive analysis of major market players
- 4.5 Competitive positioning matrix
- 4.6 Key developments
- 4.6.1 Mergers & acquisitions
- 4.6.2 Partnerships & collaborations
- 4.6.3 New product launches
- 4.6.4 Expansion plans
Chapter 5 Market Estimates & Forecast, By Pump Type, 2022 - 2035 ($Billion, Thousand Units)
- 5.1 Key trends
- 5.2 Centrifugal pumps
- 5.2.1 Single-stage centrifugal pumps
- 5.2.2 Multi-stage centrifugal pumps
- 5.2.3 Split case pumps
- 5.2.4 Others (sealless centrifugal pumps etc.)
- 5.3 Positive displacement pumps
- 5.3.1 Rotary positive displacement pumps
- 5.3.1.1 Gear pumps
- 5.3.1.2 Screw pumps
- 5.3.1.3 Vane pumps
- 5.3.1.4 Lobe pumps
- 5.3.1.5 Others (progressive cavity pumps etc.)
- 5.3.2 Reciprocating positive displacement pumps
- 5.3.2.1 Piston pumps
- 5.3.2.2 Plunger pumps
- 5.3.2.3 Others (diaphragm pumps etc.)
- 5.3.1 Rotary positive displacement pumps
- 5.4 Specialty pump
- 5.4.1 Vacuum pumps
- 5.4.1.1 Dry vacuum pumps
- 5.4.1.2 Liquid ring vacuum pumps
- 5.4.1.3 Others (rotary vane vacuum pumps etc.)
- 5.4.2 Cryogenic pumps
- 5.4.3 Peristaltic pumps
- 5.4.4 Regenerative turbine pumps
- 5.4.5 Others (jet pumps etc.)
- 5.4.1 Vacuum pumps
Chapter 6 Market Estimates & Forecast, By Power Source, 2022 - 2035 ($Billion, Thousand Units)
- 6.1 Key trends
- 6.2 Electric motor driven pumps
- 6.3 Engine driven pumps
- 6.3.1 Diesel engine driven
- 6.3.2 Natural gas engine driven
- 6.4 Pneumatic & hydraulic driven pumps
- 6.5 Others (solar powered pumps etc.)
Chapter 7 Market Estimates & Forecast, By End User Industry, 2022 - 2035 ($Billion, Thousand Units)
- 7.1 Key trends
- 7.2 Data centers
- 7.3 Semiconductor manufacturing
- 7.4 HVAC (temperature control sector)
- 7.5 Medical & healthcare
- 7.6 Food & beverages
- 7.7 Oil & gas
- 7.8 Water & wastewater treatment
- 7.9 Others (power generation etc.)
Chapter 8 Market Estimates & Forecast, By Distribution Channel, 2022 - 2035 ($Billion, Thousand Units)
- 8.1 Key trends
- 8.2 Direct sales
- 8.3 Indirect sales
Chapter 9 Market Estimates & Forecast, By Region, 2022 - 2035 ($Billion, Thousand Units)
- 9.1 Key trends
- 9.2 North America
- 9.2.1 U.S.
- 9.2.2 Canada
- 9.3 Europe
- 9.3.1 Germany
- 9.3.2 UK
- 9.3.3 France
- 9.3.4 Spain
- 9.3.5 Italy
- 9.3.6 Netherlands
- 9.4 Asia Pacific
- 9.4.1 China
- 9.4.2 Japan
- 9.4.3 India
- 9.4.4 Australia
- 9.4.5 South Korea
- 9.5 Latin America
- 9.5.1 Brazil
- 9.5.2 Mexico
- 9.5.3 Argentina
- 9.6 MEA
- 9.6.1 South Africa
- 9.6.2 Saudi Arabia
- 9.6.3 UAE
Chapter 10 Company Profiles
- 10.1 Global Key Players
- 10.1.1 Alfa Laval
- 10.1.2 Ebara
- 10.1.3 Flowserve
- 10.1.4 Grundfos
- 10.1.5 IDEX
- 10.1.6 Ingersoll Rand
- 10.1.7 KSB Group
- 10.2 Regional Players
- 10.2.1 Kirloskar Brothers
- 10.2.2 Pentair
- 10.2.3 Sulzer
- 10.2.4 Torishima Pump
- 10.2.5 Weir
- 10.2.6 Wilo
- 10.2.7 Xylem
- 10.3 Emerging/Niche Specialists
- 10.3.1 Caprari
- 10.3.2 Leo Group
- 10.3.3 Patterson Pump
- 10.3.4 Ruhrpumpen
- 10.3.5 Sundyne
- 10.3.6 Tapflo
- 10.3.7 Verder
 ATEX幫浦市場 - 全球產業規模、佔有率、趨勢、機會、預測:按類型、最終用戶產業、地區和競爭格局分類,2021-2031年
 固態廢棄物處理用防堵塞幫浦市場預測至2034年-按類型、材質、最終用戶和地區分類的全球分析工業氣動幫浦市場預測至2034年-按產品、類型、材質、應用、最終用戶和地區分類的全球分析
 農業泵浦市場:2026-2032年全球市場預測(按泵浦類型、驅動系統、額定功率、材質、應用、最終用戶和分銷管道分類)地熱流體幫浦市場:2026年至2032年全球市場預測(按泵浦類型、能源來源、部署模式、輸出、材質、應用和最終用戶分類)
 液冷泵市場規模、佔有率和趨勢分析報告:按產品、電源、最終用途、應用、地區和細分市場分類 - 預測,2026-2033年
 全球商用建築幫浦市場(2024-2030 年)2025-2026年全球柴油幫浦市場固態處理用潛水泵市場:2026年至2032年全球預測(按泵類型、額定功率、安裝方式、驅動系統、排出口尺寸、材質、葉輪類型、級數、應用和最終用戶分類)植入式渦流幫浦市場:依產品類型、額定功率、材料類型、技術、密封類型、流量、應用、最終用戶、通路分類,全球預測(2026-2032)