

 |
市場調查報告書
商品編碼
2045767
掌上型遊戲機市場機會、成長要素、產業趨勢分析及2026-2035年預測。Gaming Handheld Market Opportunity, Growth Drivers, Industry Trend Analysis, and Forecast 2026 - 2035 |
||||||
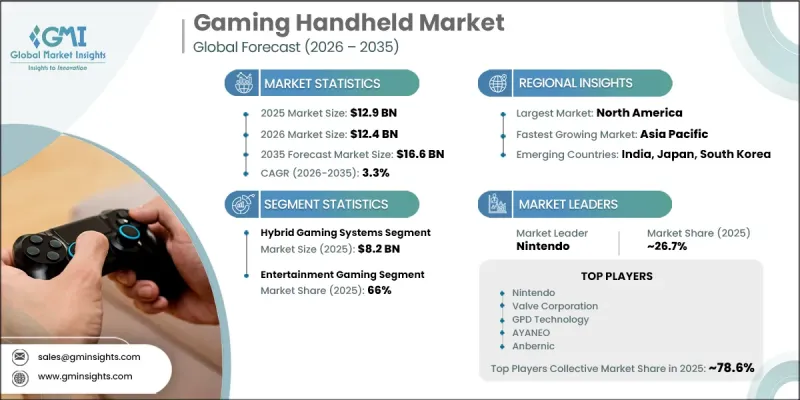
全球掌上型遊戲機市場預計到 2025 年將達到 129 億美元,並以 3.3% 的複合年成長率成長,到 2035 年將達到 166 億美元。
攜帶式遊戲產業的整體成長主要得益於消費者對兼具便利性和柔軟性的攜帶式遊戲體驗日益成長的偏好。參與企業正積極尋求開發緊湊型遊戲設備,使用戶能夠在旅行、通勤或進行日常活動時享受娛樂,而無需受限於固定的遊戲環境。掌上型遊戲機憑藉其便攜性、易用性以及能夠提供涵蓋眾多遊戲的沉浸式遊戲體驗而持續受到歡迎。處理器效能、圖形處理能力、電池續航時間和顯示品質的不斷提升顯著改善了整體使用者體驗。製造商不斷推出輕巧的遊戲設備,這些設備擁有靈敏的操控和增強的視覺效果,以吸引更廣泛的消費群體。此外,雲端遊戲基礎設施和互聯遊戲生態系統的快速發展也加速了掌上型遊戲機市場的需求。與數位遊戲平台和訂閱服務的整合提高了內容的可及性,並增強了用戶參與度。掌上遊戲機也越來越相容於互聯生態系統和基於網路的遊戲環境。全球對電子競技文化和串流媒體娛樂日益成長的興趣進一步推動了高效能掌上型遊戲機在全球的普及。
| 市場範圍 | |
|---|---|
| 開始年份 | 2025 |
| 預測期 | 2026-2035 |
| 上市時的市場規模 | 129億美元 |
| 預計金額 | 166億美元 |
| 複合年成長率 | 3.3% |
預計到2025年,混合型遊戲主機市場規模將達到82億美元。該市場持續佔據主導,是因為這類設備不僅能作為掌上遊戲機使用,連接外部顯示器後還能作為家用遊戲主機使用,從而提供極大的柔軟性。這種雙重功能提升了便利性,並改善了使用者在各種環境下的遊戲體驗。混合型遊戲系統兼具便攜性和先進的遊戲功能,吸引了從休閒參與企業到專業玩家等各類消費者。消費者對多功能遊戲產品的興趣日益濃厚,以及能夠在攜帶式和大螢幕遊戲體驗之間無縫切換的需求,正持續推動著全球市場對混合型遊戲系統的需求。
預計到2025年,娛樂遊戲市佔率將達到66%,並在2026年至2035年間維持1.8%的複合年成長率。攜帶式遊戲設備在休閒娛樂、遊戲娛樂和身臨其境型數位娛樂體驗方面的持續普及,將繼續推動該細分市場的成長。消費者越來越傾向於隨時隨地暢玩遊戲的攜帶式遊戲平台,這使得以娛樂為中心的遊戲成為市場上的主要應用領域。該細分市場涵蓋了多種遊戲形式,旨在吸引不同人群和遊戲偏好。預計在整個預測期內,攜帶式娛樂技術的日益普及以及對便捷遊戲體驗不斷成長的需求將持續推動娛樂遊戲細分市場的成長。
美國掌上型遊戲機市場預計到2025年將達到39億美元,並在2026年至2035年間以2.4%的複合年成長率成長。美國市場強大的領先地位得益於高度發展的遊戲生態系統以及消費者對高階掌上型遊戲機日益成長的需求。這種成長主要源自於消費者對高效能掌上型遊戲機的興趣日益濃厚,這些遊戲機能夠提供先進的遊戲體驗,並具備無縫連接多個遊戲環境的功能。在美國,擁有卓越圖形效能、更佳便攜性和與整合生態系統相容性的掌上型遊戲機持續受到消費者的青睞。兼具便攜性和增強遊戲功能的多功能遊戲系統的需求預計將繼續成為美國掌上型遊戲機行業成長的主要驅動力。
目錄
第1章:調查方法和範圍
第2章執行摘要
第3章:行業洞察
- 工業生態系分析
- 供應商情況
- 利潤率
- 每個階段增加的價值
- 影響價值鏈的因素
- 影響產業的因素
- 促進因素
- 攜帶式和行動遊戲體驗越來越受歡迎。
- 擴展高效能遊戲生態系統和雲端遊戲服務
- 全球遊戲社群的不斷壯大以及電子競技的影響因素
- 潛在風險和挑戰
- 智慧型手機和平板電腦作為遊戲的替代品,帶來了激烈的競爭。
- 高階掌上型遊戲機價格昂貴
- 機會
- 訂閱式雲端遊戲平台的成長
- 對混合型和模組化遊戲設備的需求不斷成長
- 促進因素
- 成長潛力分析
- 未來市場趨勢
- 技術與創新展望
- 最新科技趨勢
- 新技術
- 監理情勢
- 標準和合規要求
- 區域監理框架
- 認證標準
- 波特的分析
- PESTLE分析
- 貿易數據分析
- 2019-2024年進出口數量及價值趨勢
- 主要貿易路線及關稅的影響
- HS編碼分類與貿易流量圖
- 跨境電子商務的發展趨勢
- 人工智慧和生成式人工智慧對市場的影響
- 利用人工智慧改造現有經營模式
- 基於細分市場的生成式人工智慧的應用案例和部署藍圖
- 人工智慧驅動的遊戲開發與最佳化
- 人工智慧驅動的個人化遊戲體驗
- 人工智慧驅動的績效管理
- 用於語音控制的自然語言處理
- 用於眼動追蹤和生物識別控制的電腦視覺
- 風險、限制和監管考量
- AI硬體整合趨勢(NPU、邊緣AI晶片)
- 目前分銷基礎設施和通路滲透情況
- 以區域業態(現代零售與傳統零售)分類的通路覆蓋率
- 缺乏最後一公里基礎設施和不斷變化的管道
- 電子商務平台的區域滲透率
- 零售業重組及貨架空間趨勢
第4章 競爭情勢
- 介紹
- 企業市佔率分析
- 按地區
- 企業矩陣分析
- 主要市場公司的競爭分析
- 競爭定位矩陣
- 併購
- 夥伴關係和聯盟
- 新產品發布
- 業務拓展計劃
第5章 市場估算與預測:依產品類型分類,2022-2035年
- 專用掌上型遊戲機
- 混合型遊戲機
- 攜帶式遊戲電腦
- 安卓遊戲手持終端機
第6章 市場估計與預測:依類型分類,2022-2035年
- 傳統手持式
- 蛤殼
- 滑桿
- 模組化的
- 折疊式
第7章 市場估計與預測:依技術分類,2022-2035年
- 僅觸摸
- 物理控制
- 混合觸控與物理
- 運動控制
- 語音控制
- 眼動追蹤與生物識別
第8章 市場估計與預測:依年齡層別分類,2022-2035年
- 嬰兒
- 青年
- 成人
第9章 市場估價與預測:依顯示器尺寸分類,2022-2035年
- 小螢幕設備(3-5吋)
- 中等尺寸螢幕設備(5-7吋)
- 大螢幕設備(7-9吋)
- 超大螢幕裝置(9吋或更大)
第10章 市場估價與預測:依價格區間分類,2022-2035年
- 低的
- 中等的
- 高的
第11章 市場估計與預測:依應用領域分類,2022-2035年
- 娛樂遊戲
- 專業和競技遊戲
- 教育遊戲應用
- 雲端遊戲和串流遊戲
第12章 市場估計與預測:依通路分類,2022-2035年
- 離線
- 線上
第13章 市場估計與預測:依地區分類,2022-2035年
- 北美洲
- 美國
- 加拿大
- 歐洲
- 德國
- 英國
- 法國
- 義大利
- 西班牙
- 亞太地區
- 中國
- 印度
- 日本
- 韓國
- 澳洲
- 拉丁美洲
- 巴西
- 墨西哥
- 阿根廷
- 中東和非洲
- 沙烏地阿拉伯
- 阿拉伯聯合大公國
- 南非
第14章:公司簡介
- 全球主要公司
- Nintendo
- Valve Corporation
- Sony Interactive Entertainment
- ASUS
- Lenovo
- MSI
- AYN
- 該地區的領先企業
- Anbernic
- GPD Technology
- OneXPlayer
- AYANEO
- Retroid
- Powkiddy
- Atari
- 新興企業和專業公司
- Razer
- Logitech
- Panic
- AYN Thor
- Miyoo
- ZOTAC
- Trimui
The Global Gaming Handheld Market was valued at USD 12.9 billion in 2025 and is estimated to grow at a CAGR of 3.3% to reach USD 16.6 billion by 2035.
Growth across the handheld gaming industry is fueled by the increasing consumer preference for portable gaming experiences that offer convenience and flexibility. Players are actively seeking compact gaming devices that support entertainment while traveling, commuting, or engaging in daily activities without depending on fixed gaming setups. Handheld gaming consoles continue to gain traction due to their portability, accessibility, and ability to deliver engaging gameplay experiences across a broad selection of titles. Continuous advancements in processor performance, graphics capabilities, battery life, and display quality are significantly improving the overall user experience. Manufacturers are increasingly introducing lightweight gaming devices equipped with responsive controls and enhanced visual performance to attract a wider consumer base. In addition, the rapid expansion of cloud gaming infrastructure and connected gaming ecosystems is accelerating demand within the gaming handheld market. Integration with digital gaming platforms and subscription-based services is improving content accessibility and enhancing user engagement. Portable gaming systems are also becoming more compatible with connected ecosystems and network-based gaming environments. Rising global interest in competitive gaming culture and streaming entertainment is further supporting the adoption of high-performance handheld gaming devices worldwide.
| Market Scope | |
|---|---|
| Start Year | 2025 |
| Forecast Year | 2026-2035 |
| Start Value | $12.9 Billion |
| Forecast Value | $16.6 Billion |
| CAGR | 3.3% |
In 2025, the hybrid gaming systems segment accounted for USD 8.2 billion. The segment continues to dominate because these devices provide the flexibility to function as portable gaming systems and as home-based gaming consoles when connected to external displays. This dual-purpose functionality enhances convenience and improves the overall gaming experience for users across different environments. Hybrid gaming systems attract a broad range of consumers, including both casual players and performance-focused gamers, due to their ability to combine mobility with advanced gaming capabilities. Growing consumer interest in versatile gaming products and seamless transitions between portable and larger-screen gaming experiences is driving continued demand for hybrid gaming systems across global markets.
The entertainment gaming segment held a 66% share in 2025 and is expected to register a CAGR of 1.8% from 2026 to 2035. Strong adoption of handheld gaming devices for leisure activities, recreational gaming, and immersive digital entertainment experiences continues to support segment growth. Consumers increasingly favor portable gaming platforms that allow uninterrupted gameplay across different locations, making entertainment-focused gaming the leading application area within the market. The segment includes a broad variety of gaming formats designed to appeal to diverse demographics and gaming preferences. Rising engagement with portable entertainment technologies and growing demand for accessible gaming experiences are expected to sustain the expansion of the entertainment gaming segment throughout the forecast period.
U.S. Gaming Handheld Market captured USD 3.9 billion in 2025 and is anticipated to grow at a CAGR of 2.4% from 2026 to 2035. Strong market leadership in the United States is supported by a highly developed gaming ecosystem and rising consumer demand for premium portable gaming devices. Growth is being driven by increasing interest in high-performance handheld consoles that provide advanced gaming experiences and seamless connectivity across multiple gaming environments. Portable gaming devices offering strong graphics performance, improved mobility, and integrated ecosystem compatibility continue to witness rising adoption among consumers in the country. Demand for multifunctional gaming systems that combine portability with enhanced gameplay capabilities is expected to remain a major factor supporting the growth of the U.S. gaming handheld industry.
Major companies operating in the Global Gaming Handheld Market include Nintendo, Valve Corporation, Sony Interactive Entertainment, ASUS, Lenovo, MSI, and AYN. Additional regional participants active in the market include Anbernic, GPD Technology, OneXPlayer, AYANEO, Retroid, Powkiddy, and Atari. Emerging and specialized companies contributing to industry competition include Razer, Logitech, Panic, AYN Thor, Miyoo, ZOTAC, and Trimui. Companies competing in the Global Gaming Handheld Market are adopting multiple strategies to strengthen their market position and improve long-term competitiveness. Leading manufacturers are focusing on continuous product innovation by developing lightweight handheld consoles with advanced graphics, enhanced battery performance, and improved processing capabilities. Many businesses are investing in cloud gaming integration and cross-platform compatibility to expand user engagement and improve accessibility across gaming ecosystems. Strategic partnerships with gaming platform providers and software developers are also helping companies broaden their content offerings and strengthen brand visibility. In addition, market participants are expanding distribution networks and increasing investments in research and development activities to accelerate product launches.
Table of Contents
Chapter 1 Methodology & Scope
- 1.1 Market scope and definition
- 1.2 Research design
- 1.2.1 Research approach
- 1.2.2 Data collection methods
- 1.3 Data mining sources
- 1.3.1 Global
- 1.3.2 Regional/Country
- 1.4 Base estimates and calculations
- 1.4.1 Base year calculation
- 1.4.2 Key trends for market estimation
- 1.5 Primary research and validation
- 1.5.1 Primary sources
- 1.6 Forecast model
- 1.7 Research assumptions and limitations
Chapter 2 Executive Summary
- 2.1 Industry 360° synopsis
- 2.2 Key market trends
- 2.2.1 Regional
- 2.2.2 Product Type
- 2.2.3 Form
- 2.2.4 Technology
- 2.2.5 Age Group
- 2.2.6 Display Size
- 2.2.7 Price Range
- 2.2.8 Application
- 2.2.9 Distribution channel
Chapter 3 Industry Insights
- 3.1 Industry ecosystem analysis
- 3.1.1 Supplier landscape
- 3.1.2 Profit margin
- 3.1.3 Value addition at each stage
- 3.1.4 Factor affecting the value chain
- 3.2 Industry impact forces
- 3.2.1 Growth drivers
- 3.2.1.1 Rising popularity of portable and on-the-go gaming experiences
- 3.2.1.2 Expansion of high-performance gaming ecosystems and cloud gaming services
- 3.2.1.3 Growing gaming community and esports influence globally
- 3.2.2 Pitfalls & Challenges
- 3.2.2.1 High competition from smartphones and tablets as gaming alternatives
- 3.2.2.2 High product pricing for premium handheld gaming devices
- 3.2.3 Opportunities
- 3.2.3.1 Growth of subscription-based cloud gaming platforms
- 3.2.3.2 Rising demand for hybrid and modular gaming devices
- 3.2.1 Growth drivers
- 3.3 Growth potential analysis
- 3.4 Future market trends
- 3.5 Technology and innovation landscape
- 3.5.1 Current technological trends
- 3.5.2 Emerging technologies
- 3.6 Regulatory landscape
- 3.6.1 Standards and compliance requirements
- 3.6.2 Regional regulatory frameworks
- 3.6.3 Certification standards
- 3.7 Porter's analysis
- 3.8 PESTEL analysis
- 3.8.1 Pricing analysis (driven by primary research)
- 3.8.1.1 Historical price trend analysis (2019-2024) (driven by primary research)
- 3.8.1.2 Pricing strategy by player type (premium / value / cost-plus) (driven by primary research)
- 3.8.1.3 Regional price variations and purchasing power parity
- 3.8.1.4 Component cost dynamics and BOM analysis
- 3.8.1.5 Price elasticity of demand by segment
- 3.8.2 Trade data analysis (HS code- 9504.50) (driven by paid data base)
- 3.8.2.1 Import/export volume and value trends (2019-2024) (driven by paid data base)
- 3.8.2.2 Key trade corridors and tariff impact (driven by paid data base)
- 3.8.2.3 HS code classification and trade flow mapping
- 3.8.2.4 Cross-border e-commerce dynamics
- 3.8.3 Impact of AI and generative AI on the market
- 3.8.3.1 AI-driven disruption of existing business models
- 3.8.3.2 GenAI use cases and adoption roadmap by segment
- 3.8.3.3 AI-powered game development and optimization
- 3.8.3.4 Personalized gaming experiences via AI
- 3.8.3.5 AI-enhanced performance management
- 3.8.3.6 Natural language processing for voice control
- 3.8.3.7 Computer vision for eye tracking and biometric controls
- 3.8.3.8 Risks, limitations and regulatory considerations
- 3.8.3.9 AI hardware integration trends (NPUs, edge AI chips)
- 3.8.4 Distribution infrastructure and channel penetration landscape (driven by primary research)
- 3.8.4.1 Channel coverage by region and format (modern vs. traditional trade) (driven by primary research)
- 3.8.4.2 Last-mile infrastructure gaps and emerging channel shifts (driven by primary research)
- 3.8.4.3 E-commerce platform penetration by geography
- 3.8.4.4 Retailer consolidation and shelf space dynamics
- 3.8.1 Pricing analysis (driven by primary research)
Chapter 4 Competitive Landscape, 2025
- 4.1 Introduction
- 4.2 Company market share analysis
- 4.2.1 By Region
- 4.2.1.1 North America
- 4.2.1.2 Europe
- 4.2.1.3 Asia Pacific
- 4.2.1.4 Latin America
- 4.2.1.5 Middle East & Africa
- 4.2.1 By Region
- 4.3 Company matrix analysis
- 4.4 Competitive analysis of major market players
- 4.5 Competitive positioning matrix
- 4.6 Key developments
- 4.6.1 Mergers & acquisitions
- 4.6.2 Partnerships & collaborations
- 4.6.3 New product launches
- 4.6.4 Expansion plans
Chapter 5 Market Estimates & Forecast, By Product Type, 2022 - 2035, (USD Billion) (Thousand Units)
- 5.1 Key trends
- 5.2 Dedicated handheld gaming consoles
- 5.3 Hybrid gaming systems
- 5.4 Handheld gaming pcs
- 5.5 Android gaming handhelds
Chapter 6 Market Estimates & Forecast, By Form, 2022 - 2035, (USD Billion) (Thousand Units)
- 6.1 Key trends
- 6.2 Traditional handheld
- 6.3 Clamshell
- 6.4 Slider
- 6.5 Modular
- 6.6 Foldable
Chapter 7 Market Estimates & Forecast, By Technology, 2022 - 2035, (USD Billion) (Thousand Units)
- 7.1 Key trends
- 7.2 Touch only
- 7.3 Physical controls
- 7.4 Hybrid touch & physical
- 7.5 Motion control
- 7.6 Voice control
- 7.7 Eye tracking & biometric
Chapter 8 Market Estimates & Forecast, By Age Group, 2022 - 2035, (USD Billion) (Thousand Units)
- 8.1 Key trends
- 8.2 Children
- 8.3 Teenagers
- 8.4 Adults
Chapter 9 Market Estimates & Forecast, By Display Size, 2022 - 2035, (USD Billion) (Thousand Units)
- 9.1 Key trends
- 9.2 Small screen devices (3-5 inches)
- 9.3 Medium screen devices (5-7 inches)
- 9.4 Large screen devices (7-9 inches)
- 9.5 Extra-large screen devices (9+ inches)
Chapter 10 Market Estimates & Forecast, By Price Range, 2022 - 2035, (USD Billion) (Thousand Units)
- 10.1 Key trends
- 10.2 Low
- 10.3 Medium
- 10.4 High
Chapter 11 Market Estimates & Forecast, By Application, 2022 - 2035, (USD Billion) (Thousand Units)
- 11.1 Key trends
- 11.2 Entertainment gaming
- 11.3 Professional & competitive gaming
- 11.4 Educational gaming applications
- 11.5 Cloud & streaming gaming
Chapter 12 Market Estimates & Forecast, By Distribution Channel, 2022 - 2035, (USD Billion) (Thousand Units)
- 12.1 Key trends
- 12.2 Offline
- 12.3 Online
Chapter 13 Market Estimates & Forecast, By Region, 2022 - 2035, (USD Billion) (Thousand Units)
- 13.1 Key trends
- 13.2 North America
- 13.2.1 U.S.
- 13.2.2 Canada
- 13.3 Europe
- 13.3.1 Germany
- 13.3.2 UK
- 13.3.3 France
- 13.3.4 Italy
- 13.3.5 Spain
- 13.4 Asia Pacific
- 13.4.1 China
- 13.4.2 India
- 13.4.3 Japan
- 13.4.4 South Korea
- 13.4.5 Australia
- 13.5 Latin America
- 13.5.1 Brazil
- 13.5.2 Mexico
- 13.5.3 Argentina
- 13.6 MEA
- 13.6.1 Saudi Arabia
- 13.6.2 UAE
- 13.6.3 South Africa
Chapter 14 Company Profiles
- 14.1 Top Global Players
- 14.1.1 Nintendo
- 14.1.2 Valve Corporation
- 14.1.3 Sony Interactive Entertainment
- 14.1.4 ASUS
- 14.1.5 Lenovo
- 14.1.6 MSI
- 14.1.7 AYN
- 14.2 Regional Champions
- 14.2.1 Anbernic
- 14.2.2 GPD Technology
- 14.2.3 OneXPlayer
- 14.2.4 AYANEO
- 14.2.5 Retroid
- 14.2.6 Powkiddy
- 14.2.7 Atari
- 14.3 Emerging & Specialized Players
- 14.3.1 Razer
- 14.3.2 Logitech
- 14.3.3 Panic
- 14.3.4 AYN Thor
- 14.3.5 Miyoo
- 14.3.6 ZOTAC
- 14.3.7 Trimui
 Web3遊戲市場規模、佔有率和成長分析:按類型、平台、獲利模式、最終用戶和地區分類-2026-2033年產業預測
 全球遊戲市場規模、佔有率、趨勢和成長分析報告(2026-2034)
 2026-2030年全球遊戲市場
 射擊遊戲市場:按產品、設備類型、最終用戶和地區分類
 遊戲市場:2026-2032年全球市場預測(依平台、經營模式、類型、設備類型及通路分類)
 自我調整遊戲市場預測至2034年:按產品類型、組件、應用、最終用戶和地區分類的全球分析乙女遊戲市場:依遊戲類型、平台、獲利模式、故事主題、年齡層、發行管道和支付方式分類-2026-2032年全球預測
 遊戲市場規模、佔有率、趨勢和預測:按設備類型、平台、收入類型、類型、年齡層和地區分類,2026-2034 年
 視覺小說市場規模、佔有率和成長分析:按遊戲類型、內容主題、分發管道、獲利模式、最終用戶和地區分類——2026-2033年產業預測全球遊戲應用市場規模、佔有率、趨勢及成長分析報告(2026-2034)