

 |
市場調查報告書
商品編碼
2045764
遊戲機市場機會、成長要素、產業趨勢分析及2026-2035年預測。Game Consoles Market Opportunity, Growth Drivers, Industry Trend Analysis, and Forecast 2026 - 2035 |
||||||
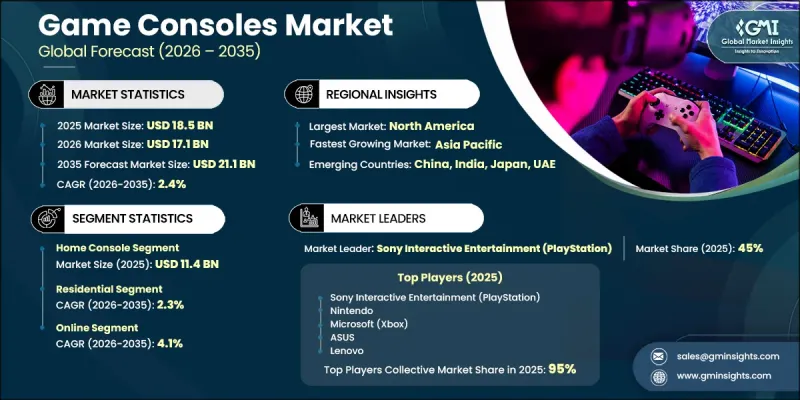
2025 年全球遊戲機市場價值 185 億美元,預計到 2035 年將達到 211 億美元,年複合成長率為 2.4%。
遊戲主機產業的成長主要得益於消費者對身臨其境型娛樂體驗日益成長的需求以及線上多人遊戲生態系統的日益普及。訂閱制遊戲服務的興起也正在改變消費者的參與模式,並支撐著市場的長期擴張。遊戲主機硬體的技術進步,包括圖形效能的提升、處理能力的增強以及與虛擬實境(VR)和擴增實境(AR)等身臨其境型技術的兼容性,進一步提升了產品的吸引力。這些創新正在擴大消費者群體,從休閒玩家到競技玩家。可支配收入的成長,尤其是在新興市場,也促進了遊戲主機的普及,因為消費者增加了在娛樂和數位休閒的支出。此外,遊戲主機與智慧家庭生態系統和連網娛樂設備的融合,進一步強化了其作為娛樂中心樞紐的地位。電子競技參與度的提高、網際網路普及率的提升以及數位遊戲社群影響力的不斷增強,都進一步推動了全球市場的穩定需求。
| 市場範圍 | |
|---|---|
| 開始年份 | 2025 |
| 預測期 | 2026-2035 |
| 上市時的市場規模 | 185億美元 |
| 預計金額 | 211億美元 |
| 複合年成長率 | 2.4% |
遊戲主機產業也正經歷穩定成長,這得益於不斷發展的數位發行模式和雲端遊戲生態系統的擴張。消費者越來越傾向於使用連網遊戲環境,以便無縫存取海量遊戲庫和線上互動功能。遊戲內容、硬體效能和訂閱服務的持續創新,支撐著全球用戶的持續參與和重複使用。
預計到2025年,家用遊戲機市場規模將達到114億美元,並在2035年之前以2.6%的複合年成長率成長。由於遊戲技術的進步以及消費者對高品質遊戲體驗日益成長的期望,家用遊戲機的需求持續成長。超高清(UHD)支援、虛擬實境(VR)功能和更強大的處理能力等功能的提升,鞏固了家用遊戲機作為首選遊戲平台的地位。此外,獨佔遊戲和線上多人遊戲功能的日益普及,也進一步推動了家用遊戲機的持續成長。
預計2026年至2035年間,線上零售市場將以4.1%的複合年成長率成長。數位商務平台的擴張以及消費者對便利購物方式日益成長的需求是推動該市場成長的主要因素。線上管道為消費者提供種類繁多的遊戲機、極具競爭力的價格以及便捷的宅配服務,使其成為極具吸引力的購買選擇。此外,數位零售平台提供的促銷折扣、捆綁銷售和季節性促銷活動也進一步促進了遊戲機市場的線上銷售。
預計到2025年,美國遊戲主機市場將佔據89%的市場佔有率,市場規模將達到54億美元。美國遊戲主機市場的擴張主要得益於消費者對沉浸式遊戲體驗的強勁需求以及先進遊戲技術的快速發展。較高的可支配收入水準和完善的數位基礎設施持續推動次世代遊戲主機的普及。競技遊戲和電子競技的日益普及也促進了市場的持續成長。此外,全球主要廠商的參與以及主機硬體的不斷創新,包括圖形性能的提升、處理能力的增強以及虛擬實境(VR)功能的整合,都進一步推動了美國市場的發展。
目錄
第1章:調查方法和範圍
第2章執行摘要
第3章 行業洞察
- 產業生態系分析
- 供應商情況
- 利潤率
- 每個階段增加的價值
- 影響價值鏈的因素
- 中斷
- 影響產業的因素
- 促進因素
- 產業潛在風險與挑戰
- 機會
- 成長潛力分析
- 未來市場趨勢
- 技術與創新展望
- 圖形處理和射線追蹤技術
- 雲端遊戲整合
- 虛擬實境(VR)與擴增實境(AR)功能
- 向下相容和跨平台遊戲
- 固態硬碟(SSD)技術的演變
- 價格分析
- 對過去價格趨勢的分析
- 定價策略:按業務類型分類
- 監理框架
- 區域內容分級系統(ESRB、PEGI、CERO)
- 有關資料隱私和兒童保護的法規
- 進出口關稅和貿易政策
- 數位版權管理和許可
- 貿易數據分析
- 進出口量及進口額趨勢
- 主要貿易路線及關稅的影響
- 人工智慧和生成式人工智慧對市場的影響
- 人工智慧正在改變傳統的經營模式。
- 按客戶群分類的生成式人工智慧用例和部署藍圖
- 風險、限制和監管考量
- 人工智慧驅動的智慧家庭生態系統的整合
- 波特五力分析
- PESTLE分析
- 消費行為分析
- 購買模式
- 偏好分析
- 不同地區的消費行為差異
- 電子商務對購買決策的影響
第4章 競爭情勢
- 介紹
- 企業市佔率分析
- 企業矩陣分析
- 主要市場公司的競爭分析
- 競爭定位矩陣
- 主要進展
- 併購
- 夥伴關係和聯盟
- 新產品發布
- 業務拓展計劃
第5章 市場估價與預測:依主機類型分類,2022-2035年
- 家用遊戲機
- 掌上型遊戲機
- 混合主機
- 專用主機
第6章 市場估計與預測:依應用領域分類,2022-2035年
- 網路遊戲
- 離線遊戲
第7章 市場估計與預測:依價格區間分類,2022-2035年
- 價格低廉(200 美元以下)
- 中價位(200-499 美元)
- 高價位(超過500美元)
第8章 市場估算與預測:依最終使用者分類,2022-2035年
- 住宅
- 商業的
- 遊戲玩家咖啡館
- 電競場
- 飯店和娛樂
第9章 市場估價與預測:依通路分類,2022-2035年
- 線上
- 電子商務
- 企業網站
- 離線
- 超級市場/大賣場
- 專業零售店
- 其他(例如獨立經營零售商店)
第10章 市場估價與預測:依地區分類,2022-2035年
- 北美洲
- 美國
- 加拿大
- 歐洲
- 德國
- 英國
- 法國
- 西班牙
- 義大利
- 荷蘭
- 亞太地區
- 中國
- 日本
- 印度
- 澳洲
- 韓國
- 拉丁美洲
- 巴西
- 墨西哥
- 阿根廷
- 中東和非洲
- 南非
- 沙烏地阿拉伯
- UAE
第11章:公司簡介
- 全球主要公司
- ASUS
- Lenovo
- Microsoft(Xbox)
- MSI
- Nintendo
- Sony Interactive Entertainment(PlayStation)
- Valve Corporation
- 當地公司
- Anbernic
- Ayn Technology
- Evercade(Blaze)
- Hyperkin
- Miyoo
- OneXPlayer
- SNK Corporation
- 新興企業和專業公司
- Arduboy
- Datafrog
- Panic Inc.
- Polymega
- Retro-Bit Gaming
- Supretro
- Thumby
The Global Game Consoles Market was valued at USD 18.5 billion in 2025 and is estimated to grow at a CAGR of 2.4% to reach USD 21.1 billion by 2035.
Growth in the game consoles industry is driven by increasing demand for immersive entertainment experiences and the rising popularity of online multiplayer gaming ecosystems. The shift toward subscription-based gaming services is also reshaping consumer engagement patterns and supporting long-term market expansion. Technological advancements in console hardware, including improved graphics performance, faster processing capabilities, and compatibility with immersive technologies such as virtual reality and augmented reality, are further strengthening product appeal. These innovations are broadening the consumer base to include both casual users and competitive gaming enthusiasts. Rising disposable incomes, particularly in emerging economies, are also contributing to higher adoption of gaming consoles as consumers allocate more spending toward entertainment and digital leisure. Additionally, integration of gaming consoles with smart home ecosystems and connected entertainment devices is enhancing their role as central entertainment hubs. Expanding e-sports participation, increasing internet penetration, and the growing influence of digital gaming communities are further reinforcing steady demand across global markets.
| Market Scope | |
|---|---|
| Start Year | 2025 |
| Forecast Year | 2026-2035 |
| Start Value | $18.5 Billion |
| Forecast Value | $21.1 Billion |
| CAGR | 2.4% |
The game consoles industry is also experiencing consistent growth due to the evolution of digital distribution models and cloud-based gaming ecosystems. Consumers are increasingly shifting toward connected gaming environments that provide seamless access to large game libraries and online interaction features. Continuous innovation in gaming content, hardware performance, and subscription-driven services is supporting sustained engagement and repeat usage across global user bases.
In 2025, the home console segment generated USD 11.4 billion and is projected to grow at a CAGR of 2.6% through 2035. Demand for home consoles continues to rise due to improvements in gaming technology and increasing consumer expectations for high-quality gaming experiences. Enhanced capabilities such as ultra-high-definition resolution support, virtual reality compatibility, and advanced processing performance have strengthened the position of home consoles as the preferred gaming platform. In addition, the rising popularity of exclusive game titles and online multiplayer functionalities is further driving sustained adoption of home-based gaming systems.
The online distribution segment is expected to grow at a CAGR of 4.1% from 2026 to 2035. Expansion of digital commerce platforms and increasing consumer preference for convenient purchasing methods are key factors driving growth in this segment. Online channels offer consumers a wide variety of gaming consoles, competitive pricing, and convenient home delivery services, making them an attractive purchasing option. In addition, promotional discounts, bundled offers, and seasonal deals available through digital retail platforms are further encouraging online sales growth within the game consoles market.
United States Game Consoles Market accounted for 89% share in 2025, generating USD 5.4 billion. Market expansion in the country is driven by strong demand for immersive gaming experiences and the rapid development of advanced gaming technologies. High disposable income levels, coupled with a well-established digital infrastructure, continue to support widespread adoption of next-generation gaming consoles. The increasing popularity of competitive gaming and e-sports is also contributing to sustained market growth. The presence of leading global gaming companies and continuous innovation in console hardware, including enhanced graphics capabilities, improved processing power, and virtual reality integration, further strengthens market development in the United States.
Major companies operating in the Global Game Consoles Market include Microsoft, Sony Interactive Entertainment, Nintendo, Valve Corporation, ASUS, Lenovo, MSI, SNK Corporation, Anbernic, Ayn Technology, Evercade, Hyperkin, Miyoo, OneXPlayer, Arduboy, Datafrog, Panic Inc., Polymega, Retro-Bit Gaming, Supretro, and Thumby. Companies operating in the game consoles market are adopting a range of strategic initiatives to strengthen market presence and enhance competitiveness. Manufacturers are heavily investing in hardware innovation, focusing on improved graphics performance, faster processing units, and integration of immersive technologies such as virtual reality and augmented reality. Subscription-based gaming ecosystems and digital content platforms are expanded to increase recurring revenue streams and improve user retention. Firms are also strengthening exclusive game development partnerships to differentiate their platforms and build strong brand loyalty. Expansion of cloud gaming services and cross-platform compatibility is further enhancing accessibility and user engagement. In addition, companies are leveraging strategic collaborations with e-sports organizations and gaming communities to boost brand visibility.
Table of Contents
Chapter 1 Methodology and scope
- 1.1 Research approach
- 1.2 Quality Commitments
- 1.2.1 GMI AI policy & data integrity commitment
- 1.2.1.1 Source consistency protocol
- 1.2.1 GMI AI policy & data integrity commitment
- 1.3 Research Trail & Confidence Scoring
- 1.3.1 Research Trail Components
- 1.3.2 Scoring Components
- 1.4 Data Collection
- 1.4.1 Partial list of primary sources
- 1.5 Data mining sources
- 1.5.1 Paid sources
- 1.5.1.1 Sources, by region
- 1.5.1 Paid sources
- 1.6 Base estimates and calculations
- 1.6.1 Base year calculation for any one approach
- 1.7 Forecast model
- 1.7.1 Quantified market impact analysis
- 1.7.1.1 Mathematical impact of growth parameters on forecast
- 1.7.1 Quantified market impact analysis
- 1.8 Research transparency addendum
- 1.8.1 Source attribution framework
- 1.8.2 Quality assurance metrics
- 1.8.3 Our commitment to trust
Chapter 2 Executive summary
- 2.1 Industry 360° synopsis
- 2.2 Key market trends
- 2.2.1 Regional
- 2.2.2 Console type
- 2.2.3 Application
- 2.2.4 Price range
- 2.2.5 End users
- 2.2.6 Distribution channel
Chapter 3 Industry insights
- 3.1 Industry ecosystem analysis
- 3.1.1 Supplier landscape
- 3.1.2 Profit margin
- 3.1.3 Value addition at each stage
- 3.1.4 Factor affecting the value chain
- 3.1.5 Disruptions
- 3.2 Industry impact forces
- 3.2.1 Growth drivers
- 3.2.2 Industry pitfalls & challenges
- 3.2.3 Opportunities
- 3.3 Growth potential analysis
- 3.4 Future market trends
- 3.5 Technology and innovation landscape
- 3.5.1 Graphics processing & ray tracing technology
- 3.5.2 Cloud gaming integration
- 3.5.3 Virtual reality & augmented reality capabilities
- 3.5.4 Backward compatibility & cross-platform play
- 3.5.5 Solid-State Drive (SSD) technology evolution
- 3.6 Pricing Analysis
- 3.6.1 Historical price trend analysis
- 3.6.2 Pricing strategy by player type
- 3.7 Regulatory framework
- 3.7.1 Regional Content Rating Systems (ESRB, PEGI, CERO)
- 3.7.2 Data Privacy & Child Protection Regulations
- 3.7.3 Import/Export Tariffs & Trade Policies
- 3.7.4 Digital Rights Management & Licensing
- 3.8 Trade Data Analysis (HS Code: 95045000)
- 3.8.1 Import/export volume & value trends
- 3.8.2 Key trade corridors & tariff impact
- 3.9 Impact of AI & generative ai on the market
- 3.9.1 AI-driven disruption of traditional business models
- 3.9.2 GenAI use cases & adoption roadmap by customer segment
- 3.9.3 Risks, limitations & regulatory considerations
- 3.9.4 AI-enabled smart home ecosystem integration
- 3.10 Porter's five forces analysis
- 3.11 PESTEL analysis
- 3.12 Consumer behavior analysis
- 3.12.1 Purchasing patterns
- 3.12.2 Preference analysis
- 3.12.3 Regional variations in consumer behavior
- 3.12.4 Impact of e-commerce on buying decisions
Chapter 4 Competitive landscape, 2025
- 4.1 Introduction
- 4.2 Company market share analysis
- 4.2.1 North America
- 4.2.2 Europe
- 4.2.3 Asia Pacific
- 4.2.4 Latin America
- 4.2.5 MEA
- 4.3 Company matrix analysis
- 4.4 Competitive analysis of major market players
- 4.5 Competitive positioning matrix
- 4.6 Key developments
- 4.6.1 Mergers & acquisitions
- 4.6.2 Partnerships & collaborations
- 4.6.3 New product launches
- 4.6.4 Expansion plans
Chapter 5 Market Estimates & Forecast, By Console Type, 2022 - 2035 ($Billion, Thousand Units)
- 5.1 Key trends
- 5.2 Home console
- 5.3 Handheld console
- 5.4 Hybrid console
- 5.5 Dedicated console
Chapter 6 Market Estimates & Forecast, By Application, 2022 - 2035 ($Billion, Thousand Units)
- 6.1 Key trends
- 6.2 Online gaming
- 6.3 Offline gaming
Chapter 7 Market Estimates & Forecast, By Price Range, 2022 - 2035 ($Billion, Thousand Units)
- 7.1 Key trends
- 7.2 Low (below USD 200)
- 7.3 Medium (USD 200 - USD 499)
- 7.4 High (USD 500 & above)
Chapter 8 Market Estimates & Forecast, By End Users, 2022 - 2035 ($Billion, Thousand Units)
- 8.1 Key trends
- 8.2 Residential
- 8.3 Commercial
- 8.3.1 Gaming cafes
- 8.3.2 Esports arenas
- 8.3.3 Hospitality & entertainment
Chapter 9 Market Estimates & Forecast, By Distribution Channel, 2022 - 2035 ($Billion, Thousand Units)
- 9.1 Key trends
- 9.2 Online
- 9.2.1 E-commerce
- 9.2.2 Company websites
- 9.3 Offline
- 9.3.1 Supermarkets/hypermarket
- 9.3.2 Specialty retail stores
- 9.3.3 Others (independent retailer etc.)
Chapter 10 Market Estimates & Forecast, By Region, 2022 - 2035 ($Billion, Thousand Units)
- 10.1 Key trends
- 10.2 North America
- 10.2.1 U.S.
- 10.2.2 Canada
- 10.3 Europe
- 10.3.1 Germany
- 10.3.2 UK
- 10.3.3 France
- 10.3.4 Spain
- 10.3.5 Italy
- 10.3.6 Netherlands
- 10.4 Asia Pacific
- 10.4.1 China
- 10.4.2 Japan
- 10.4.3 India
- 10.4.4 Australia
- 10.4.5 South Korea
- 10.5 Latin America
- 10.5.1 Brazil
- 10.5.2 Mexico
- 10.5.3 Argentina
- 10.6 MEA
- 10.6.1 South Africa
- 10.6.2 Saudi Arabia
- 10.6.3 UAE
Chapter 11 Company Profiles
- 11.1 Global Key Players
- 11.1.1 ASUS
- 11.1.2 Lenovo
- 11.1.3 Microsoft (Xbox)
- 11.1.4 MSI
- 11.1.5 Nintendo
- 11.1.6 Sony Interactive Entertainment (PlayStation)
- 11.1.7 Valve Corporation
- 11.2 Regional Players
- 11.2.1 Anbernic
- 11.2.2 Ayn Technology
- 11.2.3 Evercade (Blaze)
- 11.2.4 Hyperkin
- 11.2.5 Miyoo
- 11.2.6 OneXPlayer
- 11.2.7 SNK Corporation
- 11.3 Emerging/Niche Specialists
- 11.3.1 Arduboy
- 11.3.2 Datafrog
- 11.3.3 Panic Inc.
- 11.3.4 Polymega
- 11.3.5 Retro-Bit Gaming
- 11.3.6 Supretro
- 11.3.7 Thumby
 連網遊戲機市場:按產品類型和地區分類
 電視遊戲機市場按產品類型、代數、價格範圍、連接方式、儲存容量、解析度支援、媒體格式、控制器類型和分銷管道分類-2026-2032年全球預測
 全球遊戲機市場
 2025-2035年全球掌上型遊戲機市場