

 |
市場調查報告書
商品編碼
2045751
綠色甲醇市場機會、成長要素、產業趨勢分析及2026-2035年預測。Green Methanol Market Opportunity, Growth Drivers, Industry Trend Analysis, and Forecast 2026 - 2035 |
||||||
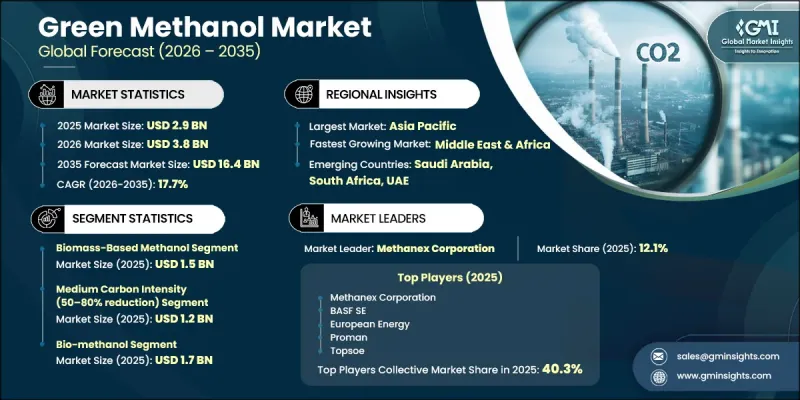
全球綠色甲醇市場預計到 2025 年價值 29 億美元,預計到 2035 年將以 17.7% 的複合年成長率成長至 164 億美元。
綠色甲醇採用低碳可再生原料生產,而非傳統的石化燃料衍生原料。其關鍵生產流程包括利用可再生能源電解、結合捕獲的二氧化碳以及生質能氣化技術。這些方法在減少排放的同時,也支持轉型為永續化學品的生產。由於其作為燃料、能源載體和化學原料的多功能性,綠色甲醇作為更清潔的替代品正受到廣泛關注。它與現有基礎設施的兼容性使得各行業無需進行重大營運變更即可採用,從而提高了其在交通運輸、發電和製造業等領域的應用價值。隨著各組織機構追求減排目標、應對排放嚴格的環境法規以及向循環和可再生供應鏈轉型,綠色甲醇的需求持續成長。眾多產業都在尋求永續解決方案,對綠色甲醇的興趣日益濃厚。可再生能源的可用性、碳捕獲技術的進步以及生質能生產系統的經濟可行性是推動市場擴張的主要因素。
| 市場範圍 | |
|---|---|
| 開始年份 | 2025 |
| 預測期 | 2026-2035 |
| 上市時的市場規模 | 29億美元 |
| 預計金額 | 164億美元 |
| 複合年成長率 | 17.7% |
2025年,生質能衍生甲醇市場規模將達15億美元。作為一種可再生原料,生質能甲醇因其支持循環生產模式而日益受到業界的關注。此外,碳捕獲技術的進步使得利用捕獲的排放氣體生產合成甲醇成為可能,促進了工業碳排放的再利用。同時,再生能源的廣泛應用也提高了人們對甲醇生產中電解制氫路線的興趣,推動了相關技術的持續進步。
預計到2025年,生物甲醇市場規模將達到17億美元,反映出該產業對廢棄物處理和生質能衍生可再生原料的濃厚興趣。隨著可再生能源獲取管道的改善,電解甲醇技術正在蓬勃發展,使得結合氫電解和碳捕獲的生產成為可能。市場參與企業也正在探索混合生產通路和替代加工技術,以適應當地的資源條件。這種靈活的方式正在拓寬技術範圍,並為相關人員創造新的成長機會。
預計北美綠色甲醇市場規模將從2025年的3.092億美元成長到2035年的17億美元。該地區各行業正優先考慮可再生化學解決方案以減少排放,同時也評估替代原料。美國推出的能源扶持政策,以及工業和化學領域對低碳合成燃料日益成長的需求,正在推動市場成長。
目錄
第1章:調查方法和範圍
第2章執行摘要
第3章:行業洞察
- 工業生態系分析
- 供應商情況
- 利潤率
- 每個階段增加的價值
- 影響價值鏈的因素
- 中斷
- 影響產業的因素
- 促進因素
- 人們對低碳燃料的興趣日益濃厚
- 擴大可再生能源的使用
- 工業脫碳問題日益受到關注
- 潛在風險和挑戰
- 高昂的生產成本和推出成本
- 供應基礎設施大規模短缺
- 機會
- 融入化學製造程序
- 透過碳捕獲技術實現業務擴張
- 促進因素
- 成長潛力分析
- 監理情勢
- 北美洲
- 歐洲
- 亞太地區
- 拉丁美洲
- 中東和非洲
- 波特的分析
- PESTLE分析
- 價格趨勢
- 按地區
- 按原料
- 未來市場趨勢
- 技術與創新展望
- 最新科技趨勢
- 新技術
- 專利趨勢
- 貿易統計
- 主要進口國
- 主要出口國
- 永續性和環境方面
- 永續發展計劃
- 減少廢棄物策略
- 生產中的能源效率
- 環保舉措
- 考慮碳足跡
第4章 競爭情勢
- 介紹
- 企業市佔率分析
- 按地區
- 北美洲
- 歐洲
- 亞太地區
- 拉丁美洲
- 中東和非洲
- 按地區
- 企業矩陣分析
- 主要市場公司的競爭分析
- 競爭定位矩陣
- 併購
- 夥伴關係和聯盟
- 新產品發布
- 業務拓展計劃
第5章 市場估算與預測:依原料分類,2022-2035年
- 生質能衍生甲醇
- 農業廢棄物
- 林業殘餘物
- 都市固態廢棄物
- 其他
- 甲醇源自二氧化碳排放
- 工業二氧化碳捕集
- 直接從大氣中回收
- 其他
- 源自綠色氫的甲醇
- 電解制氫
- 其他可再生氫源
第6章 市場估算與預測:依碳排放強度分類,2022-2035年
- 低碳強度(減少 50% 或更少)
- 中等碳強度(減碳50-80%)
- 高碳強度(減碳80%以上)
- 碳負排放
第7章 市場估算與預測:依產品與最終用途分類,2022-2035年
- 生物甲醇
- 透過製造程序
- 氣化技術
- 發酵技術
- 其他
- 按最終用途
- 汽車和交通運輸
- 船用燃料
- 汽車燃料
- 航空燃料
- 化工
- 甲醛的產生
- 乙酸生產
- 甲醇制烯烴(MTO)
- 其他化學用途
- 汽車和交通運輸
- 電力
- 其他
- 透過製造程序
- 乙醇
- 透過製造程序
- 電力製甲醇
- 二氧化碳加氫
- 其他
- 按最終用途
- 汽車和交通運輸
- 船用燃料
- 汽車燃料
- 航空燃料
- 化工
- 甲醛的產生
- 乙酸生產
- 甲醇制烯烴(MTO)
- 其他化學用途
- 汽車和交通運輸
- 電力
- 其他
- 透過製造程序
- 其他
- 按最終用途
- 汽車和交通運輸
- 船用燃料
- 汽車燃料
- 航空燃料
- 化工
- 甲醛的產生
- 乙酸生產
- 甲醇制烯烴(MTO)
- 其他化學用途
- 汽車和交通運輸
- 電力
- 其他
- 按最終用途
第8章 市場估計與預測:依地區分類,2022-2035年
- 北美洲
- 美國
- 加拿大
- 歐洲
- 德國
- 英國
- 法國
- 西班牙
- 義大利
- 其他歐洲國家
- 亞太地區
- 中國
- 印度
- 日本
- 澳洲
- 韓國
- 其他亞太國家
- 拉丁美洲
- 巴西
- 墨西哥
- 阿根廷
- 其他拉丁美洲國家
- 中東和非洲
- 沙烏地阿拉伯
- 南非
- 阿拉伯聯合大公國
- 其他中東和非洲國家
第9章:公司簡介
- Methanex Corporation
- Topsoe
- BASF SE
- Sodra
- Proman
- Alberta-Pacific Forest Industries Inc.
- KAPSOM plc
- Avaada
- European Energy
- HIF GLOBAL
- Perpetual Next
- Clariant AG
- Avina Inc.
- C1 Green Chemicals AG
- HaiQI Inc.
- Singapore Methanol
- Toyo Engineering Corporation
- Enerkem
The Global Green Methanol Market was valued at USD 2.9 billion in 2025 and is estimated to grow at a CAGR of 17.7% to reach USD 16.4 billion by 2035.
Green methanol is produced using low-carbon and renewable inputs rather than conventional fossil-based sources. Production pathways primarily involve generating hydrogen via renewable-powered electrolysis and combining it with captured carbon dioxide, along with biomass gasification techniques. These approaches lower emissions while supporting the shift toward sustainable chemical production. The material is gaining traction as a cleaner substitute due to its versatility as a fuel, energy carrier, and chemical input. Its compatibility with existing infrastructure allows industries to adopt it without major operational changes, increasing its usability across transportation, power generation, and manufacturing. Demand continues to rise as organizations pursue emission reduction goals, respond to tightening environmental regulations, and transition toward circular and renewable supply chains. Interest is accelerating across multiple industries seeking sustainable solutions. Market expansion is influenced by renewable energy availability, advancements in carbon capture technologies, and the economic feasibility of biomass-based production systems.
| Market Scope | |
|---|---|
| Start Year | 2025 |
| Forecast Year | 2026-2035 |
| Start Value | $2.9 Billion |
| Forecast Value | $16.4 Billion |
| CAGR | 17.7% |
The biomass-derived methanol segment accounted for USD 1.5 billion in 2025. Industrial players are increasingly exploring this option as a renewable feedstock to support circular production models. Advancements in carbon capture technologies are also enabling the development of methanol synthesized from captured emissions, promoting the reuse of industrial carbon outputs. At the same time, the growing deployment of renewable electricity is driving interest in electrolysis-based hydrogen routes for methanol production, supporting continued technological progress.
The bio-methanol segment reached USD 1.7 billion in 2025, reflecting strong industry attention toward renewable feedstocks derived from waste streams and biomass. E-methanol is advancing alongside improved access to renewable energy, enabling production through hydrogen electrolysis combined with carbon capture. Market participants are also examining hybrid production pathways and alternative processing techniques to suit regional resource availability. These flexible approaches are broadening the technological landscape and unlocking new growth opportunities for stakeholders.
North America Green Methanol Market is anticipated to grow from USD 309.2 million in 2025 to USD 1.7 billion by 2035. Industries across the region are prioritizing renewable chemical solutions to reduce emissions while evaluating alternative feedstocks. Supportive energy policies in the United States, along with growing interest in low-carbon synthetic fuels for industrial and chemical applications, are driving market momentum.
Key players in the Global Green Methanol Market include Methanex Corporation, Topsoe, BASF SE, Sodra, Proman, Alberta-Pacific Forest Industries Inc., KAPSOM plc, Avaada, European Energy, HIF GLOBAL, Perpetual Next, Clariant AG, Avina Inc., C1 Green Chemicals AG, HaiQI Inc., Singapore Methanol, Toyo Engineering Corporation, and Enerkem. Companies operating in the green methanol market are focusing on expanding production capacity through investments in renewable energy integration and advanced processing technologies. Strategic partnerships and collaborations are being formed to strengthen supply chains and accelerate technology deployment. Many players are prioritizing research and development to improve efficiency in electrolysis and carbon capture processes. Geographic expansion into regions with abundant renewable resources is another key approach. Firms are also securing long-term agreements with industrial end users to ensure stable demand. Additionally, companies are diversifying feedstock sources, including biomass and captured carbon, to enhance flexibility and reduce dependency on a single production route. These combined strategies are helping businesses reinforce their competitive positioning and drive market growth.
Table of Contents
Chapter 1 Methodology & Scope
- 1.1 Market scope and definition
- 1.2 Research design
- 1.2.1 Research approach
- 1.2.2 Data collection methods
- 1.3 Data mining sources
- 1.3.1 Global
- 1.3.2 Regional/Country
- 1.4 Base estimates and calculations
- 1.4.1 Base year calculation
- 1.4.2 Key trends for market estimation
- 1.5 Primary research and validation
- 1.5.1 Primary sources
- 1.6 Forecast model
- 1.7 Research assumptions and limitations
Chapter 2 Executive Summary
- 2.1 Industry 360° synopsis
- 2.2 Key market trends
- 2.2.1 Feedstock
- 2.2.2 Carbon Intensity
- 2.2.3 Product by End Use
- 2.2.4 Regional
- 2.3 TAM Analysis, 2026-2035
- 2.4 CXO perspectives: Strategic imperatives
- 2.5 Future outlook and strategic recommendations
Chapter 3 Industry Insights
- 3.1 Industry ecosystem analysis
- 3.1.1 Supplier landscape
- 3.1.2 Profit margin
- 3.1.3 Value addition at each stage
- 3.1.4 Factor affecting the value chain
- 3.1.5 Disruptions
- 3.2 Industry impact forces
- 3.2.1 Growth drivers
- 3.2.1.1 Rising interest in low-carbon fuels
- 3.2.1.2 Expanding renewable energy availability
- 3.2.1.3 Increased focus on industrial decarbonization
- 3.2.2 Pitfalls/challenge
- 3.2.2.1 High production and setup costs
- 3.2.2.2 Limited large-scale supply infrastructure
- 3.2.3 Opportunities
- 3.2.3.1 Integration into chemical manufacturing pathways
- 3.2.3.2 Expansion through carbon capture technologies
- 3.2.1 Growth drivers
- 3.3 Growth potential analysis
- 3.4 Regulatory landscape
- 3.4.1 North America
- 3.4.2 Europe
- 3.4.3 Asia Pacific
- 3.4.4 Latin America
- 3.4.5 Middle East & Africa
- 3.5 Porter's analysis
- 3.6 PESTEL analysis
- 3.7 Price trends
- 3.7.1 By region
- 3.7.2 By feedstock
- 3.8 Future market trends
- 3.9 Technology and innovation landscape
- 3.9.1 Current technological trends
- 3.9.2 Emerging technologies
- 3.10 Patent landscape
- 3.11 Trade statistics (HS code)
- 3.11.1 Major importing countries
- 3.11.2 Major exporting countries
- 3.12 Sustainability and environmental aspects
- 3.12.1 Sustainable practices
- 3.12.2 Waste reduction strategies
- 3.12.3 Energy efficiency in production
- 3.12.4 Eco-friendly initiatives
- 3.13 Carbon footprint consideration
Chapter 4 Competitive Landscape, 2025
- 4.1 Introduction
- 4.2 Company market share analysis
- 4.2.1 By region
- 4.2.1.1 North America
- 4.2.1.2 Europe
- 4.2.1.3 Asia Pacific
- 4.2.1.4 LATAM
- 4.2.1.5 MEA
- 4.2.1 By region
- 4.3 Company matrix analysis
- 4.4 Competitive analysis of major market players
- 4.5 Competitive positioning matrix
- 4.6 Key developments
- 4.6.1 Mergers & acquisitions
- 4.6.2 Partnerships & collaborations
- 4.6.3 New product launches
- 4.6.4 Expansion plans
Chapter 5 Market Estimates and Forecast, By Feedstock, 2022-2035 (USD Billion) (Kilo Tons)
- 5.1 Key trends
- 5.2 Biomass-based methanol
- 5.2.1 Agricultural waste
- 5.2.2 Forestry residues
- 5.2.3 Municipal solid waste
- 5.2.4 Others
- 5.3 CO2 emissions-based methanol
- 5.3.1 Industrial CO2 Capture
- 5.3.2 Direct air capture
- 5.3.3 Others
- 5.4 Green hydrogen-based methanol
- 5.4.1 Electrolysis-derived hydrogen
- 5.4.2 Other renewable hydrogen sources
Chapter 6 Market Estimates and Forecast, By Carbon Intensity, 2022-2035 (USD Billion) (Kilo Tons)
- 6.1 Key trends
- 6.2 Low carbon intensity (<50% reduction)
- 6.3 Medium carbon intensity (50-80% reduction)
- 6.4 High carbon intensity (>80% reduction)
- 6.5 Carbon negative
Chapter 7 Market Estimates and Forecast, By Product by End Use, 2022-2035 (USD Billion) (Kilo Tons)
- 7.1 Key trends
- 7.2 Bio-methanol
- 7.2.1 By production process
- 7.2.1.1 Gasification technology
- 7.2.1.2 Fermentation technology
- 7.2.1.3 Others
- 7.2.2 By end use
- 7.2.2.1 Automotive & transportation
- 7.2.2.1.1 Marine fuel
- 7.2.2.1.2 Automotive fuel
- 7.2.2.1.3 Aviation fuel
- 7.2.2.2 Chemical industry
- 7.2.2.2.1 Formaldehyde production
- 7.2.2.2.2 Acetic acid production
- 7.2.2.2.3 Methanol-to-olefins (MTO)
- 7.2.2.2.4 Other Chemical End Uses
- 7.2.2.1 Automotive & transportation
- 7.2.3 Power
- 7.2.4 Others
- 7.2.1 By production process
- 7.3 E-methanol
- 7.3.1 By production process
- 7.3.1.1 Power-to-methanol
- 7.3.1.2 CO2 hydrogenation
- 7.3.1.3 Others
- 7.3.2 By end use
- 7.3.2.1 Automotive & transportation
- 7.3.2.1.1 Marine fuel
- 7.3.2.1.2 Automotive fuel
- 7.3.2.1.3 Aviation fuel
- 7.3.2.2 Chemical industry
- 7.3.2.2.1 Formaldehyde production
- 7.3.2.2.2 Acetic acid production
- 7.3.2.2.3 Methanol-to-olefins (MTO)
- 7.3.2.2.4 Other chemical end uses
- 7.3.2.1 Automotive & transportation
- 7.3.3 Power
- 7.3.4 Others
- 7.3.1 By production process
- 7.4 Others
- 7.4.1 By end use
- 7.4.1.1 Automotive & transportation
- 7.4.1.1.1 Marine fuel
- 7.4.1.1.2 Automotive fuel
- 7.4.1.1.3 Aviation fuel
- 7.4.1.2 Chemical industry
- 7.4.1.2.1 Formaldehyde production
- 7.4.1.2.2 Acetic acid production
- 7.4.1.2.3 Methanol-to-olefins (MTO)
- 7.4.1.2.4 Other chemical end uses
- 7.4.1.1 Automotive & transportation
- 7.4.2 Power
- 7.4.3 Others
- 7.4.1 By end use
Chapter 8 Market Estimates and Forecast, By Region, 2022-2035 (USD Billion) (Kilo Tons)
- 8.1 Key trends
- 8.2 North America
- 8.2.1 U.S.
- 8.2.2 Canada
- 8.3 Europe
- 8.3.1 Germany
- 8.3.2 UK
- 8.3.3 France
- 8.3.4 Spain
- 8.3.5 Italy
- 8.3.6 Rest of Europe
- 8.4 Asia Pacific
- 8.4.1 China
- 8.4.2 India
- 8.4.3 Japan
- 8.4.4 Australia
- 8.4.5 South Korea
- 8.4.6 Rest of Asia Pacific
- 8.5 Latin America
- 8.5.1 Brazil
- 8.5.2 Mexico
- 8.5.3 Argentina
- 8.5.4 Rest of Latin America
- 8.6 Middle East and Africa
- 8.6.1 Saudi Arabia
- 8.6.2 South Africa
- 8.6.3 UAE
- 8.6.4 Rest of Middle East and Africa
Chapter 9 Company Profiles
- 9.1 Methanex Corporation
- 9.2 Topsoe
- 9.3 BASF SE
- 9.4 Sodra
- 9.5 Proman
- 9.6 Alberta-Pacific Forest Industries Inc.
- 9.7 KAPSOM plc
- 9.8 Avaada
- 9.9 European Energy
- 9.10 HIF GLOBAL
- 9.11 Perpetual Next
- 9.12 Clariant AG
- 9.13 Avina Inc.
- 9.14 C1 Green Chemicals AG
- 9.15 HaiQI Inc.
- 9.16 Singapore Methanol
- 9.17 Toyo Engineering Corporation
- 9.18 Enerkem
 綠色甲醇市場:按來源類型、甲醇類型、衍生物類型、應用和地區分類:產業趨勢與全球市場預測(至2035年)
 綠色甲醇市場預測至2034年-全球分析(依來源、甲醇類型、生產技術、衍生物、應用、最終用戶及地區分類)
 綠色甲醇市場:按類型、原料類型、應用、終端用戶產業和分銷管道分類-2026-2032年全球市場預測
 2026年全球綠色甲醇市場報告
 2026-2030年全球綠色甲醇市場
 綠色甲醇市場規模、佔有率和成長分析(按原料類型、甲醇類型、應用和地區分類)-2026-2033年產業預測
 綠色甲醇市場-全球產業規模、佔有率、趨勢、機會及預測,依原料、類型、應用、地區及競爭狀況細分,2020-2030 年
 綠色甲醇市場分析及預測(至2034年):類型、產品、技術、應用、最終用戶、組件、流程、部署、安裝類型、設備
 全球綠色甲醇市場(按原始材料、衍生物、應用和地區分類)- 2030 年預測
 綠色甲醇市場 - 全球和區域分析:按最終用途行業、按應用、按甲醇類型、按區域 - 分析和預測(2025-2034 年)