


 |
市場調查報告書
商品編碼
2045743
消防市場機會、成長要素、產業趨勢分析及2026-2035年預測。Fire Suppression Market Opportunity, Growth Drivers, Industry Trend Analysis, and Forecast 2026 - 2035 |
||||||

2025年全球消防系統市場價值為262億美元,預計2035年將以7.1%的複合年成長率成長至509億美元。
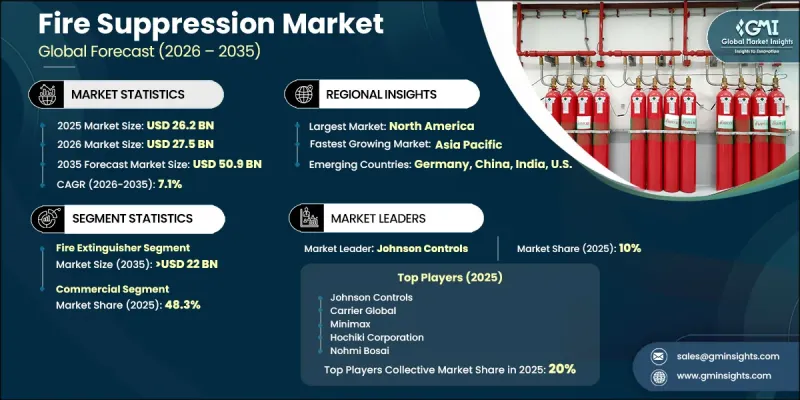
市場成長的驅動力源自於人們對住宅、商業和工業環境中消防安全的日益關注,在這些環境中,保護生命、財產和基礎設施是重中之重。消防系統被廣泛部署,透過噴灌、水霧、燃氣系統、泡沫系統和手持式滅火器等技術來偵測、控制和消除火災風險。該行業正從傳統的消防工具轉向整合解決方案,這些解決方案融合了探測、監控和自動化滅火功能。更嚴格的法規和建築安全標準正在加速傳統系統向先進消防技術的更新和升級。城市基礎設施、工業設施和高密度商業空間的擴張也進一步增強了對可靠消防系統的需求。人們對職場安全的日益重視、保險公司主導的合規要求以及對智慧建築技術投資的增加,也促進了市場的持續成長。此外,已開發國家和新興國家消防基礎設施的現代化正在推動長期應用趨勢。互聯系統和建築自動化平台的整合進一步提高了回應效率和系統可靠性,使消防解決方案成為現代基礎設施建設中不可或缺的組成部分。
| 市場範圍 | |
|---|---|
| 開始年份 | 2025 |
| 預測期 | 2026-2035 |
| 上市時的市場規模 | 262億美元 |
| 預測金額 | 509億美元 |
| 複合年成長率 | 7.1% |
預計到2035年,滅火器市場規模將達到220億美元,主要得益於其作為早期滅火工具的重要角色。該市場涵蓋攜帶式滅火器、輪式工業滅火器以及使用潔淨氣體、二氧化碳和乾粉滅火劑的固定式滅火系統。這些設備被廣泛用作緊急滅火設備,並與自動化滅火系統配合使用,在火勢蔓延前迅速將其撲滅。監管標準和建築安全要求持續推動產品在各種終端使用環境中的應用,確保了預測期內市場需求的穩定成長。
預計到2025年,商業用途領域將佔據48.3%的市場佔有率,並將在2035年之前以6.6%的複合年成長率成長。該領域的需求成長主要受商業建築快速發展、現有建築維修以及日益嚴格的消防設備合規要求所驅動。此外,對業務永續營運計劃、保險合規和居住者安全的日益重視也進一步推動了該領域的應用。同時,智慧建築技術的整合實現了消防系統與自動化設施管理平台之間的無縫協調,從而提高了整體安全效率。
預計到2025年,美國消防系統市場規模將達到75億美元,這主要得益於安全法規的嚴格執行和公眾對消防系統的廣泛認知。商業房地產基礎設施的持續發展,包括辦公大樓、零售空間、酒店項目和綜合用途建築,正在推動市場成長。製造業、物流業和能源產業的擴張也增加了對專為高風險環境設計的專用消防系統的需求。此外,先進建築規範的日益普及和安全基礎設施的不斷升級,也進一步支撐了市場的長期成長。
目錄
第1章:調查方法和範圍
第2章執行摘要
第3章 行業洞察
- 產業生態系分析
- 原物料供應及採購分析
- 生產能力評估
- 供應鏈韌性與風險因素
- 配電網路分析
- 影響產業的因素
- 促進因素
- 產業潛在風險與挑戰
- 監理情勢
- 成長潛力分析
- 波特的分析
- PESTLE分析
- 滅火系統成本結構分析
- 價格分析
- 依產品
- 按地區
- 貿易數據分析
- 進出口額趨勢
- 主要貿易路線及關稅的影響
- 人工智慧和生成式人工智慧對產業的影響(核心解決方案)
- 利用人工智慧最佳化生產
- 預測性維護和故障檢測
- 新機會和趨勢
- 數位化和物聯網整合
- 未開發市場和應用領域的成長
- 投資分析及未來展望
第4章 競爭情勢
- 介紹
- 企業市佔率分析:按地區分類
- 北美洲
- 歐洲
- 亞太地區
- 中東和非洲
- 拉丁美洲
- 競爭定位矩陣
- 主要進展
- 併購
- 夥伴關係和聯盟
- 新產品發布
- 業務拓展計劃及資金籌措
第5章 市場規模及預測:依產品分類,2022-2035年
- 滅火器
- 按產能
- <5
- 5~15
- >15
- 化學物質
- 乾粉滅火劑
- 泡沫滅火器
- 二氧化碳
- 其他
- 按產能
- 噴灌
第6章 市場規模與預測:依最終用途分類,2022-2035年
- 住宅
- 商業的
- 教育機構
- 衛生保健
- 零售
- 辦公室
- 物流/運輸
- 飯店業
- 其他
- 產業
第7章 市場規模及預測:依地區分類,2022-2035年
- 北美洲
- 美國
- 加拿大
- 歐洲
- 德國
- 法國
- 英國
- 義大利
- 西班牙
- 俄羅斯
- 亞太地區
- 中國
- 日本
- 韓國
- 印度
- 澳洲
- 中東和非洲
- 沙烏地阿拉伯
- UAE
- 南非
- 拉丁美洲
- 巴西
- 阿根廷
第8章:公司簡介
- Amerex Corporation
- API Group
- Ansul
- Britannia Fire
- Carrier Global
- Ceasefire Industries
- Feuerschutz Jockel
- Flamex
- Halma
- Hochiki Corporation
- Honeywell
- Johnson Controls(Tyco)
- JL Industries
- Kidde
- Kanex Fire
- Minimax
- Nohmi Bosai
- Robert Bosch
- Siemens
- Safex Fire Services
- United Technologies Corporation
The Global Fire Suppression Market was valued at USD 26.2 billion in 2025 and is estimated to grow at a CAGR of 7.1% to reach USD 50.9 billion by 2035.
Growth in this market is influenced by the increasing focus on fire safety across residential, commercial, and industrial environments, where protecting lives, assets, and infrastructure remains a top priority. Fire suppression systems are widely deployed to detect, control, and eliminate fire risks through technologies such as sprinklers, water mist, gas-based suppression, foam-based systems, and handheld extinguishers. The industry is evolving beyond traditional firefighting tools toward integrated solutions that combine detection, monitoring, and automated suppression capabilities. Rising regulatory enforcement and strict building safety codes are accelerating the replacement and upgrading of legacy systems with advanced fire protection technologies. Expanding urban infrastructure, industrial facilities, and high-density commercial spaces are further strengthening demand for reliable suppression systems. Increasing awareness about workplace safety, insurance-driven compliance requirements, and growing investments in smart building technologies are also contributing to sustained market expansion. Additionally, modernization of fire safety infrastructure across developed and emerging economies is reinforcing long-term adoption trends. The integration of connected systems with building automation platforms is further improving response efficiency and system reliability, making fire suppression solutions an essential component of modern infrastructure development.
| Market Scope | |
|---|---|
| Start Year | 2025 |
| Forecast Year | 2026-2035 |
| Start Value | $26.2 Billion |
| Forecast Value | $50.9 Billion |
| CAGR | 7.1% |
The fire extinguisher segment is projected to reach USD 22 billion by 2035, supported by its role as a primary response tool for early-stage fire control. This segment includes portable extinguishers, wheeled industrial units, and fixed systems using clean agents, CO2, and dry chemical formulations. These devices are widely deployed as first-response equipment and operate alongside automated suppression systems to quickly contain fire incidents before escalation. Regulatory standards and building safety requirements continue to shape product adoption across multiple end-use environments, ensuring consistent demand growth over the forecast period.
The commercial application segment accounted for a 48.3% share in 2025 and is expected to grow at a CAGR of 6.6% through 2035. Demand in this segment is driven by rapid commercial construction, refurbishment of existing properties, and stricter compliance requirements for fire safety installations. Increasing emphasis on business continuity planning, insurance compliance, and occupant safety is further strengthening adoption. The integration of smart building technologies is also enabling seamless coordination between fire protection systems and automated facility management platforms, improving overall safety efficiency.
U.S. Fire Suppression Market was valued at USD 7.5 billion in 2025, supported by strong enforcement of safety regulations and widespread awareness regarding fire prevention systems. Growth is reinforced by ongoing infrastructure development across commercial real estate, including office complexes, retail spaces, hospitality projects, and mixed-use buildings. Industrial expansion across manufacturing, logistics, and energy sectors is also increasing demand for specialized suppression systems designed for high-risk environments. Rising adoption of advanced building codes and continuous upgrades to safety infrastructure further support long-term market expansion.
Key companies operating in the Global Fire Suppression Industry include Johnson Controls (Tyco), Siemens, Honeywell, Robert Bosch, Halma, Carrier Global, API Group, Kidde, Hochiki Corporation, Minimax, Ansul, Amerex Corporation, Ceasefire Industries, JL Industries, Britannia Fire, Flamex, Feuerschutz Jockel, Kanex Fire, Nohmi Bosai, and Safex Fire Services. Companies in the fire suppression market are focusing on expanding integrated safety portfolios that combine detection, control, and suppression into unified systems. They are investing heavily in smart and connected technologies that enable real-time monitoring and remote diagnostics. Strategic emphasis is placed on compliance-driven product development aligned with evolving safety regulations across regions. Firms are also strengthening R&D capabilities to introduce more efficient, environmentally friendly suppression agents. Partnerships with construction firms and facility managers are helping expand deployment in large-scale infrastructure projects.
Table of Contents
Chapter 1 Methodology & Scope
- 1.1 Research design
- 1.2 Quality commitments
- 1.2.1 GMI AI policy & data integrity commitment
- 1.2.1.1 Source consistency protocol
- 1.2.1 GMI AI policy & data integrity commitment
- 1.3 Research trail & confidence scoring
- 1.3.1 Research trail components
- 1.3.2 Scoring components
- 1.4 Data collection
- 1.4.1 Partial list of primary sources
- 1.5 Data mining sources
- 1.5.1 Paid sources
- 1.5.1.1 Sources, by region
- 1.5.1 Paid sources
- 1.6 Base estimates and calculations
- 1.6.1 Base year calculation for any one approach
- 1.7 Market estimates and forecasts parameters
- 1.8 Forecast model
- 1.8.1 Quantified market impact analysis
- 1.8.1.1 Mathematical impact of growth parameters on forecast
- 1.8.1 Quantified market impact analysis
- 1.9 Research transparency addendum
- 1.9.1 Source attribution framework
- 1.9.2 Quality assurance metrics
- 1.9.3 Our commitment to trust
- 1.10 Market definitions
Chapter 2 Executive Summary
- 2.1 Industry synopsis, 2022 - 2035
- 2.1.1 Business trends
- 2.1.2 Product trends
- 2.1.3 End use trends
- 2.1.4 Regional trends
Chapter 3 Industry Insights
- 3.1 Industry ecosystem analysis
- 3.1.1 Raw material availability & sourcing analysis
- 3.1.2 Manufacturing capacity assessment
- 3.1.3 Supply chain resilience & risk factors
- 3.1.4 Distribution network analysis
- 3.2 Industry impact forces
- 3.2.1 Growth drivers
- 3.2.2 Industry pitfalls & challenges
- 3.3 Regulatory landscape
- 3.4 Growth potential analysis
- 3.5 Porter's analysis
- 3.5.1 Bargaining power of suppliers
- 3.5.2 Bargaining power of buyers
- 3.5.3 Threat of new entrants
- 3.5.4 Threat of substitutes
- 3.6 PESTEL analysis
- 3.6.1 Political factors
- 3.6.2 Economic factors
- 3.6.3 Social factors
- 3.6.4 Technological factors
- 3.6.5 Legal factors
- 3.6.6 Environmental factors
- 3.7 Cost structure analysis of fire suppression system
- 3.8 Pricing analysis (Driven by Primary Research)
- 3.8.1 By product
- 3.8.2 By region
- 3.9 Trade data analysis (Driven by Primary Research)
- 3.9.1 Import/export value trends (Driven by Primary Research)
- 3.9.2 Key trade corridors & tariff impact (Driven by Primary Research)
- 3.10 Impact of AI & Generative AI on the industry (Core Solution)
- 3.10.1 AI-Driven production optimization
- 3.10.2 Predictive maintenance & fault detection
- 3.11 Emerging opportunities & trends
- 3.11.1 Digitalization & IoT integration
- 3.11.2 Growth in untapped markets & applications
- 3.12 Investment analysis & future prospects
Chapter 4 Competitive Landscape, 2026
- 4.1 Introduction
- 4.2 Company market share analysis, by region, 2025
- 4.2.1 North America
- 4.2.2 Europe
- 4.2.3 Asia Pacific
- 4.2.4 Middle East & Africa
- 4.2.5 Latin America
- 4.3 Competitive positioning matrix
- 4.4 Key developments
- 4.4.1 Mergers & acquisitions
- 4.4.2 Partnerships & collaborations
- 4.4.3 New product launches
- 4.4.4 Expansion plans & funding
Chapter 5 Market Size and Forecast, By Product, 2022 - 2035 (USD Million & Million Units)
- 5.1 Key trends
- 5.2 Fire extinguishers
- 5.2.1 By capacity
- 5.2.1.1 <5
- 5.2.1.2 5 to 15
- 5.2.1.3 >15
- 5.2.2 By chemical
- 5.2.2.1 Dry Chemical
- 5.2.2.2 Foam
- 5.2.2.3 Carbon dioxide
- 5.2.2.4 Others
- 5.2.1 By capacity
- 5.3 Fire sprinkler
Chapter 6 Market Size and Forecast, By End Use, 2022 - 2035 (USD Million & Million Units)
- 6.1 Key trends
- 6.2 Residential
- 6.3 Commercial
- 6.3.1 Education Institutions
- 6.3.2 Healthcare
- 6.3.3 Retail
- 6.3.4 Officies
- 6.3.5 Logistics & Transportation
- 6.3.6 Hospitality
- 6.3.7 Others
- 6.4 Industrial
Chapter 7 Market Size and Forecast, By Region, 2022 - 2035 (USD Million & Million Units)
- 7.1 Key trends
- 7.2 North America
- 7.2.1 U.S.
- 7.2.2 Canada
- 7.3 Europe
- 7.3.1 Germany
- 7.3.2 France
- 7.3.3 UK
- 7.3.4 Italy
- 7.3.5 Spain
- 7.3.6 Russia
- 7.4 Asia Pacific
- 7.4.1 China
- 7.4.2 Japan
- 7.4.3 South Korea
- 7.4.4 India
- 7.4.5 Australia
- 7.5 Middle East & Africa
- 7.5.1 Saudi Arabia
- 7.5.2 UAE
- 7.5.3 South Africa
- 7.6 Latin America
- 7.6.1 Brazil
- 7.6.2 Argentina
Chapter 8 Company Profiles
- 8.1 Amerex Corporation
- 8.2 API Group
- 8.3 Ansul
- 8.4 Britannia Fire
- 8.5 Carrier Global
- 8.6 Ceasefire Industries
- 8.7 Feuerschutz Jockel
- 8.8 Flamex
- 8.9 Halma
- 8.10 Hochiki Corporation
- 8.11 Honeywell
- 8.12 Johnson Controls (Tyco)
- 8.13 JL Industries
- 8.14 Kidde
- 8.15 Kanex Fire
- 8.16 Minimax
- 8.17 Nohmi Bosai
- 8.18 Robert Bosch
- 8.19 Siemens
- 8.20 Safex Fire Services
- 8.21 United Technologies Corporation

 全球消防系統市場規模、佔有率、趨勢和成長分析報告(2026-2034年)
 哈龍滅火器市場規模、佔有率和成長分析:按產品類型、產能、應用、最終用戶、分銷管道和地區分類-2026-2033年產業預測
 消防系統市場-2026-2032年全球市場預測
 2026年全球機艙滅火系統市場報告
 全球國防消防系統市場:2026-20362026年全球自動滅火系統市場報告電氣控制櫃滅火系統市場:依產品類型、安裝類型、最終用戶產業、控制櫃電壓等級、服務類型、通路分類,全球預測(2026-2032年)
 水噴淋滅火系統市場分析及預測(至2035年):依類型、產品類型、服務、技術、應用、形式、材質、最終用戶、安裝類型及設備分類環保型滅火材料市場分析及預測(至2035年):依類型、產品類型、服務、技術、應用、材料類型、設備、最終用戶、安裝類型分類全球滅火設備市場規模、佔有率、趨勢和成長分析報告(2026-2034年)