

 |
市場調查報告書
商品編碼
2045737
設施管理市場機會、成長要素、產業趨勢分析及2026-2035年預測Facility Management Market Opportunity, Growth Drivers, Industry Trend Analysis, and Forecast 2026 - 2035 |
||||||
預計到 2025 年,全球設施管理市場規模將達到 2.45 兆美元,年複合成長率為 6.8%,到 2035 年將達到 4.7 兆美元。
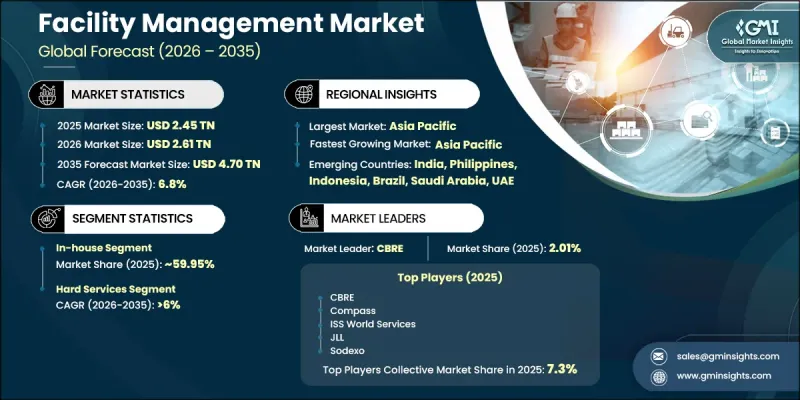
快速的城市發展、智慧基礎設施項目的擴張以及對高效建築運營日益成長的需求,正在從根本上改變設施管理行業。設施管理已遠遠超越了傳統的維護服務,如今被視為一項策略性營運職能,旨在支援資產最佳化、提升職場效率、保障用戶安全和永續性目標。現代商業建築、醫療設施、工業設施和企業園區越來越依賴整合自動化、預測性維護和即時監控技術的智慧設施管理系統。各組織機構正在優先考慮將能源管理、工作空間最佳化和數位化服務管理相結合的先進設施管理平台,以提高營運可視性並降低長期成本。自動化照明系統、智慧暖通空調控制和數位化維護計畫等功能在提高資源效率的同時,也提升了使用者體驗。此外,永續發展計劃和以ESG(環境、社會和治理)為重點的營運策略正推動設施營運商採用綠色建築技術和節能基礎設施解決方案。物聯網系統、雲端管理平台和人工智慧分析工具的日益普及,正進一步加速全球設施管理領域的數位轉型。
| 市場範圍 | |
|---|---|
| 開始年份 | 2025 |
| 預測期 | 2026-2035 |
| 初始市場規模 | 2.45兆美元 |
| 預計金額 | 4.7兆美元 |
| 複合年成長率 | 6.8% |
預計2026年至2035年,外包產業將以7.4%的複合年成長率成長。外包服務領域的擴張主要得益於整合設施管理解決方案的日益普及、對成本最佳化的日益重視以及對專業知識需求的成長。企業擴大將安保服務、清潔、暖通空調維護和能源管理等非核心業務活動外包給外部服務供應商,以便更有效地專注於核心業務職能,同時保持高標準的營運水準。
預計到2025年,硬性服務領域將佔據54.3%的市場佔有率,並在2026年至2035年間以6%的複合年成長率成長。該領域持續佔據市場主導地位,因為它涵蓋了關鍵的技術和基礎設施相關運營,包括機械、電氣、管道、暖通空調系統、消防、水資源管理和能源最佳化服務。硬性設施管理服務對於維持建築性能、符合法規要求、確保營運安全和高效利用資產至關重要。各組織機構持續優先考慮這些服務,以最大限度地減少停機時間、保護基礎設施投資並提高長期營運可靠性。
預計到2025年,中國設施管理市場將佔據全球44.2%的佔有率,並在2026年至2035年間達到4,141億美元的市場規模。中國市場的成長主要得益於快速的都市化進程、大規模的基礎設施建設以及對專業物業管理服務日益成長的需求。商業開發、工業園區、醫療基礎設施和智慧城市建設的擴張,催生了對先進的維護、能源管理和綜合設施管理解決方案的強勁需求。此外,不斷上漲的人事費用和外包營運模式的日益普及,也促使中國企業採用系統化、技術驅動的設施管理系統。
目錄
第1章:調查方法
第2章執行摘要
第3章 行業洞察
- 產業生態系分析
- 供應商情況
- 利潤率分析
- 成本結構
- 每個階段增加的價值
- 影響價值鏈的因素
- 中斷
- 影響產業的因素
- 促進因素
- 快速發展的旅遊和酒店業
- 對附加價值服務的需求日益成長
- 擴大對建築業的投資
- 政府支持智慧城市和商業中心發展的舉措
- 產業潛在風險與挑戰
- 外包設施管理服務的普及程度仍然較低。
- 人們對先進設施管理技術帶來的益處認知不足。
- 市場機遇
- 對綜合設施管理服務的需求日益成長
- 人力資源技術整合與勞動分析
- 永續發展服務與綠建築合規性
- 向二、三線城市擴張
- 促進因素
- 成長潛力分析
- 監管指南
- 北美洲
- 美國:職業安全與健康管理局 (OSHA) 關於職場安全與能源效率的規定
- 加拿大:國家建築標準與能源效率標準(加拿大自然資源部)
- 歐洲
- 德國:《能源保護法》(EnEV)和《建築能源法》(GEG)
- 英國:最低能源效率標準(MEES)與健康與安全法規
- 法國:建築能源性能指令(EPBD)的實施情形
- 義大利:遵守國家能源效率行動計畫(NEEAP)
- 亞太地區
- 中國:綠建築評估標準與節能法
- 印度:節能建築標準(ECBC)與智慧城市計畫指南
- 日本:建築節能法與CASBEE認證體系
- 澳洲:國家建築標準 (NCC) 和 NABERS 評級系統
- 拉丁美洲
- 巴西:國家能源效率計畫和綠建築委員會標準
- 墨西哥:NOM能源效率標準與永續建築標準
- 阿根廷:國家合理能源利用計畫(PRONUREE)
- 中東和非洲
- 阿拉伯聯合大公國:Estida-Ma Pearl評級系統與杜拜綠建築法規
- 沙烏地阿拉伯:沙烏地阿拉伯建築標準法和能源效率計畫 (SEEP)
- 南非:SANS 10400-XA 建築能源使用規範
- 北美洲
- 波特的分析
- PESTLE分析
- 技術與創新展望
- 最新科技趨勢
- 新興技術
- 專利分析
- 價格分析
- 對過去價格趨勢的分析
- 定價策略:按業務類型分類
- 人工智慧和生成式人工智慧對市場的影響
- 利用人工智慧改造現有經營模式
- 按細分市場分類的生成式人工智慧用例和部署藍圖
- 風險、限制和監管考量
- 永續性和環境方面
- 永續計劃
- 減少廢棄物策略
- 生產中的能源效率
- 具有環保意識的舉措
- 考慮碳足跡
- 預測假設和情境分析
- 基本案例:驅動複合年成長率的關鍵宏觀經濟與產業變量
- 樂觀情境:宏觀經濟與產業的順風
- 悲觀情景:宏觀經濟放緩或產業逆風
第4章 競爭情勢
- 介紹
- 企業市佔率分析
- 主要市場公司的競爭分析
- 競爭定位矩陣
- 主要進展
- 併購
- 夥伴關係和聯盟
- 新產品發布
- 業務拓展計劃及資金籌措
- 按公司規模進行基準測試
- 排名分類標準與遴選標準
- 按銷售額、地區和創新能力分類的層級定位矩陣。
第5章 市場估算與預測:依產品類型分類,2022-2035年
- 內部
- 外包
第6章 市場估計與預測:依服務業分類,2022-2035年
- 硬服務
- 機械、電氣、管道和暖通空調系統的維護。
- 能源管理
- 消防系統
- 水資源管理系統
- 資產管理
- 其他
- 軟服務
- 清潔和衛生管理
- 辦公室支援和保全服務
- 家政
- 害蟲防治
- 餐飲服務
- 地面維護
- 其他
第7章 市場估計與預測:依最終用途分類,2022-2035年
- 衛生保健
- 企業和公司
- 製造業
- 政府/公共部門
- 教育
- 建築和房地產
- 酒店和旅遊
- 零售
- 軍事/國防
- 其他
第8章 市場估算與預測:依組織規模分類,2022-2035年
- 大公司
- 中小企業
第9章 市場估計與預測:依地區分類,2022-2035年
- 北美洲
- 美國
- 加拿大
- 歐洲
- 德國
- 英國
- 法國
- 義大利
- 西班牙
- 俄羅斯
- 荷蘭
- 比利時
- 亞太地區
- 中國
- 印度
- 日本
- 澳洲
- 韓國
- 菲律賓
- 印尼
- 拉丁美洲
- 巴西
- 墨西哥
- 阿根廷
- 中東和非洲
- 南非
- 沙烏地阿拉伯
- UAE
第10章:公司簡介
- 世界公司
- ABM Industries
- Archibus
- CBRE
- Compass
- Cushman &Wakefield
- IBM
- ISS A/S
- JLL
- Planon
- Sodexo
- 當地公司
- Apleona
- Aramark
- Atalian Servest
- BGIS
- Caverion
- Emrill Services
- Facilicom
- Knight Facilities Management
- Mitie
- OCS
- 新興企業
- Eptura
- Facilio
- Infogrid
- UpKeep
- VergeSense
The Global Facility Management Market was valued at USD 2.45 trillion in 2025 and is estimated to grow at a CAGR of 6.8% to reach USD 4.70 trillion by 2035.
Rapid urban development, expanding smart infrastructure projects, and growing demand for efficient building operations are significantly reshaping the facility management industry. Facility management has evolved far beyond conventional maintenance services and is now considered a strategic operational function that supports asset optimization, workplace efficiency, occupant safety, and sustainability goals. Modern commercial buildings, healthcare institutions, industrial facilities, and corporate campuses increasingly rely on intelligent facility management systems that integrate automation, predictive maintenance, and real-time monitoring technologies. Organizations are prioritizing advanced FM platforms that combine energy management, workspace optimization, and digital service management to improve operational visibility and reduce long-term costs. Features such as automated lighting systems, smart climate control, and digital maintenance scheduling are enhancing user experience while improving resource efficiency. Sustainability initiatives and ESG-focused operational strategies are also encouraging facility operators to adopt green building technologies and energy-efficient infrastructure solutions. The growing use of IoT-enabled systems, cloud-based management platforms, and AI-driven analytics is further accelerating digital transformation across the facility management landscape globally.
| Market Scope | |
|---|---|
| Start Year | 2025 |
| Forecast Year | 2026-2035 |
| Start Value | $2.45 Trillion |
| Forecast Value | $4.70 Trillion |
| CAGR | 6.8% |
The outsourced segment is expected to grow at a CAGR of 7.4% during 2026-2035. Increasing adoption of integrated facility management solutions, rising focus on cost optimization, and growing demand for specialized expertise are driving expansion within the outsourced services segment. Businesses are increasingly outsourcing non-core operational activities such as security services, cleaning operations, HVAC maintenance, and energy management to external service providers to focus more effectively on primary business functions while maintaining high operational standards.
The hard services segment accounted for 54.3% share in 2025 and is anticipated to grow at a CAGR of 6% from 2026 to 2035. This segment continues to dominate because it covers critical technical and infrastructure-related operations, including mechanical, electrical, plumbing, HVAC systems, fire protection, water management, and energy optimization services. Hard facility management services are essential for ensuring uninterrupted building performance, regulatory compliance, operational safety, and efficient asset utilization. Organizations continue to prioritize these services to minimize downtime, protect infrastructure investments, and improve long-term operational reliability.
China Facility Management Market held a 44.2% share in 2025 and generated USD 414.1 billion during 2026-2035. The country's market growth is being supported by rapid urbanization, large-scale infrastructure expansion, and increasing demand for professional property management services. Growth in commercial developments, industrial zones, healthcare infrastructure, and smart city initiatives is creating strong demand for advanced maintenance, energy management, and integrated facility management solutions. In addition, rising labor costs and increasing adoption of outsourced operational models are encouraging businesses across China to implement structured and technology-enabled facility management systems.
Major companies operating in the Global Facility Management Market include Apleona, Aramark, BGIS, CBRE, Compass, Cushman & Wakefield, IBM TRIRIGA, ISS World Services, JLL, and Sodexo. Companies operating in the Facility Management Market are focusing on digital transformation, integrated service offerings, and sustainability initiatives to strengthen their market position. Industry participants are investing heavily in smart building technologies, IoT-enabled monitoring systems, predictive maintenance platforms, and cloud-based facility management software to improve operational efficiency and service quality. Strategic mergers, acquisitions, and partnerships are helping companies expand geographic reach and diversify their service portfolios. Many providers are also emphasizing energy-efficient solutions and ESG-driven operational strategies to meet evolving client expectations and regulatory standards. In addition, businesses are enhancing workforce training, adopting automation technologies, and strengthening data analytics capabilities to deliver customized and value-driven facility management services.
Table of Contents
Chapter 1 Methodology
- 1.1 Research approach
- 1.2 Quality Commitments
- 1.2.1 GMI AI policy & data integrity commitment
- 1.2.1.1 Source consistency protocol
- 1.2.1 GMI AI policy & data integrity commitment
- 1.3 Research Trail & Confidence Scoring
- 1.3.1 Research Trail Components
- 1.3.2 Scoring Components
- 1.4 Data Collection
- 1.4.1 Partial list of primary sources
- 1.5 Data mining sources
- 1.5.1 Paid sources
- 1.5.1.1 Sources, by region
- 1.5.1 Paid sources
- 1.6 Base estimates and calculations
- 1.6.1 Base year calculation for any one approach
- 1.7 Forecast
- 1.7.1 Quantified market impact analysis
- 1.7.1.1 Mathematical impact of growth parameters on forecast
- 1.7.1 Quantified market impact analysis
- 1.8 Research transparency addendum
- 1.8.1 Source attribution framework
- 1.8.2 Quality assurance metrics
- 1.8.3 Our commitment to trust
Chapter 2 Executive Summary
- 2.1 Industry 360° synopsis, 2022 - 2035
- 2.2 Key market trends
- 2.2.1 Regional
- 2.2.2 Offering
- 2.2.3 Service
- 2.2.4 End Use
- 2.2.5 Organization Size
- 2.3 TAM Analysis, 2026-2035
- 2.4 CXO perspectives: Strategic imperatives
Chapter 3 Industry Insights
- 3.1 Industry ecosystem analysis
- 3.1.1 Supplier landscape
- 3.1.2 Profit margin analysis
- 3.1.3 Cost structure
- 3.1.4 Value addition at each stage
- 3.1.5 Factor affecting the value chain
- 3.1.6 Disruptions
- 3.2 Industry impact forces
- 3.2.1 Growth drivers
- 3.2.1.1 Rapidly growing tourism and hospitality sectors
- 3.2.1.2 Rising demand for value-added services
- 3.2.1.3 Growing investments in construction sector
- 3.2.1.4 Supportive government initiatives for development of smart cities and business hubs
- 3.2.2 Industry pitfalls and challenges
- 3.2.2.1 Slow adoption of outsourced facilities management services
- 3.2.2.2 Limited awareness about the benefits of advanced facility management technologies
- 3.2.3 Market opportunities
- 3.2.3.1 Growing demand for integrated FM services
- 3.2.3.2 HR tech integration & workforce analytics
- 3.2.3.3 Sustainability services & green building compliance
- 3.2.3.4 Tier 2 & tier 3 cities expansion
- 3.2.1 Growth drivers
- 3.3 Growth potential analysis
- 3.4 Regulatory guideline
- 3.4.1 North America
- 3.4.1.1 U.S.: OSHA Workplace Safety & Energy Efficiency Regulations
- 3.4.1.2 Canada: National Building Code & Energy Efficiency Standards (NRCan)
- 3.4.2 Europe
- 3.4.2.1 Germany: Energy Saving Ordinance (EnEV) & Building Energy Act (GEG)
- 3.4.2.2 UK: Minimum Energy Efficiency Standards (MEES) & Health and Safety Regulations
- 3.4.2.3 France: Energy Performance of Buildings Directive (EPBD) Implementation
- 3.4.2.4 Italy: National Energy Efficiency Action Plan (NEEAP) Compliance
- 3.4.3 Asia Pacific
- 3.4.3.1 China: Green Building Evaluation Standard & Energy Conservation Law
- 3.4.3.2 India: Energy Conservation Building Code (ECBC) & Smart Cities Mission Guidelines
- 3.4.3.3 Japan: Building Energy Efficiency Act & CASBEE Certification System
- 3.4.3.4 Australia: National Construction Code (NCC) & NABERS Rating System
- 3.4.4 Latin America
- 3.4.4.1 Brazil: National Energy Efficiency Plan & Green Building Council Standards
- 3.4.4.2 Mexico: NOM Energy Efficiency Standards & Sustainable Building Codes
- 3.4.4.3 Argentina: National Program for Rational Energy Use (PRONUREE)
- 3.4.5 MEA
- 3.4.5.1 UAE: Estidama Pearl Rating System & Dubai Green Building Regulations
- 3.4.5.2 Saudi Arabia: Saudi Building Code & Energy Efficiency Program (SEEP)
- 3.4.5.3 South Africa: SANS 10400-XA Energy Usage in Buildings Regulation
- 3.4.1 North America
- 3.5 Porter's analysis
- 3.6 PESTEL analysis
- 3.7 Technology and Innovation landscape
- 3.7.1 Current technological trends
- 3.7.2 Emerging technologies
- 3.8 Patent analysis (Driven by Primary Research)
- 3.9 Pricing Analysis (Driven by Primary Research)
- 3.9.1 Historical Price Trend Analysis
- 3.9.2 Pricing Strategy by Player Type
- 3.10 Impact of AI & generative AI on the market
- 3.10.1 AI-Driven Disruption of Existing Business Models
- 3.10.2 GenAI Use Cases & Adoption Roadmap by Segment
- 3.10.3 Risks, limitations & regulatory considerations
- 3.11 Sustainability and environmental aspects
- 3.11.1 Sustainable practices
- 3.11.2 Waste reduction strategies
- 3.11.3 Energy efficiency in production
- 3.11.4 Eco-friendly initiatives
- 3.11.5 Carbon footprint considerations
- 3.12 Forecast assumptions & scenario analysis (Driven by Primary Research)
- 3.12.1 Base Case - Key Macro & Industry Variables Driving CAGR
- 3.12.2 Optimistic Scenarios - Favourable macro and industry tailwinds
- 3.12.3 Pessimistic Scenario - Macroeconomic slowdown or industry headwinds
Chapter 4 Competitive Landscape, 2025
- 4.1 Introduction
- 4.2 Company market share analysis
- 4.2.1 North America
- 4.2.2 Europe
- 4.2.3 Asia Pacific
- 4.2.4 Latin America
- 4.2.5 MEA
- 4.3 Competitive analysis of major market players
- 4.4 Competitive positioning matrix
- 4.5 Key developments
- 4.5.1 Mergers & acquisitions
- 4.5.2 Partnerships & collaborations
- 4.5.3 New Product Launches
- 4.5.4 Expansion Plans and funding
- 4.6 Company Tier Benchmarking
- 4.6.1 Tier Classification Criteria & Qualifying Thresholds
- 4.6.2 Tier Positioning Matrix by Revenue, Geography & Innovation
Chapter 5 Market Estimates & Forecast, By Offering, 2022 - 2035 ($Bn)
- 5.1 Key trends
- 5.2 In-House
- 5.3 Outsourced
Chapter 6 Market Estimates & Forecast, By Service, 2022 - 2035 ($Bn)
- 6.1 Key trends
- 6.2 Hard Services
- 6.2.1 Mechanical, Electrical, Plumbing & HVAC Maintenance
- 6.2.2 Energy Management
- 6.2.3 Fire Safety Systems
- 6.2.4 Water Management Systems
- 6.2.5 Asset Management
- 6.2.6 Others
- 6.3 Soft Services
- 6.3.1 Janitorial & Sanitization
- 6.3.2 Office Support & Security Services
- 6.3.3 Housekeeping
- 6.3.4 Pest Control
- 6.3.5 Catering Services
- 6.3.6 Ground Maintenance
- 6.3.7 Others
Chapter 7 Market Estimates & Forecast, By End Use, 2022 - 2035 ($Bn)
- 7.1 Key trends
- 7.2 Healthcare
- 7.3 Business & Corporate
- 7.4 Manufacturing
- 7.5 Government & Public Sector
- 7.6 Education
- 7.7 Construction & Real Estate
- 7.8 Hospitality & Travel
- 7.9 Retail
- 7.10 Military & Defense
- 7.11 Others
Chapter 8 Market Estimates & Forecast, By Organization Size, 2022 - 2035 ($Bn)
- 8.1 Key trends
- 8.2 Large Enterprises
- 8.3 Small & Medium Enterprises (SMEs)
Chapter 9 Market Estimates & Forecast, By Region, 2022 - 2035 ($Bn)
- 9.1 Key trends
- 9.2 North America
- 9.2.1 US
- 9.2.2 Canada
- 9.3 Europe
- 9.3.1 Germany
- 9.3.2 UK
- 9.3.3 France
- 9.3.4 Italy
- 9.3.5 Spain
- 9.3.6 Russia
- 9.3.7 Netherlands
- 9.3.8 Belgium
- 9.4 Asia Pacific
- 9.4.1 China
- 9.4.2 India
- 9.4.3 Japan
- 9.4.4 Australia
- 9.4.5 South Korea
- 9.4.6 Philippines
- 9.4.7 Indonesia
- 9.5 Latin America
- 9.5.1 Brazil
- 9.5.2 Mexico
- 9.5.3 Argentina
- 9.6 MEA
- 9.6.1 South Africa
- 9.6.2 Saudi Arabia
- 9.6.3 UAE
Chapter 10 Company Profiles
- 10.1 Global players
- 10.1.1 ABM Industries
- 10.1.2 Archibus
- 10.1.3 CBRE
- 10.1.4 Compass
- 10.1.5 Cushman & Wakefield
- 10.1.6 IBM
- 10.1.7 ISS A/S
- 10.1.8 JLL
- 10.1.9 Planon
- 10.1.10 Sodexo
- 10.2 Regional Players
- 10.2.1 Apleona
- 10.2.2 Aramark
- 10.2.3 Atalian Servest
- 10.2.4 BGIS
- 10.2.5 Caverion
- 10.2.6 Emrill Services
- 10.2.7 Facilicom
- 10.2.8 Knight Facilities Management
- 10.2.9 Mitie
- 10.2.10 OCS
- 10.3 Emerging Players
- 10.3.1 Eptura
- 10.3.2 Facilio
- 10.3.3 Infogrid
- 10.3.4 UpKeep
- 10.3.5 VergeSense
 全球軟性服務設施管理市場:機會與策略展望(至2035年)
 自主設施管理系統市場預測至2034年-全球分析(按組件、系統類型、發展現狀、技術、應用、最終用戶和地區分類)
 設施管理市場規模、佔有率和成長分析:按服務類型、產業、部署類型、公司規模和地區分類-2026-2033年產業預測
 設施管理市場:2026-2032年全球市場預測(依產品、產品模式、部署類型、公司規模及最終用途分類)
 設施管理市場規模、佔有率、趨勢和預測:按解決方案、服務、部署類型、組織規模、行業和地區分類,2026-2034 年設施管理服務市場:2026-2032年全球市場預測(依服務類型、合約類型、服務交付方式、最終用戶和組織規模分類)2026年全球地下設施維護與管理市場報告2026年全球硬性服務設施管理市場報告2026年全球設施支援服務市場報告2026年全球設施管理服務市場報告