

 |
市場調查報告書
商品編碼
2045690
真空鹽市場:商業機會、成長要素、產業趨勢分析及2026-2035年預測Vacuum Salt Market Opportunity, Growth Drivers, Industry Trend Analysis, and Forecast 2026 - 2035 |
||||||
預計到 2025 年,全球真空鹽市場價值將達到 91 億美元,並預計以 4.6% 的複合年成長率成長,到 2035 年達到 143 億美元。
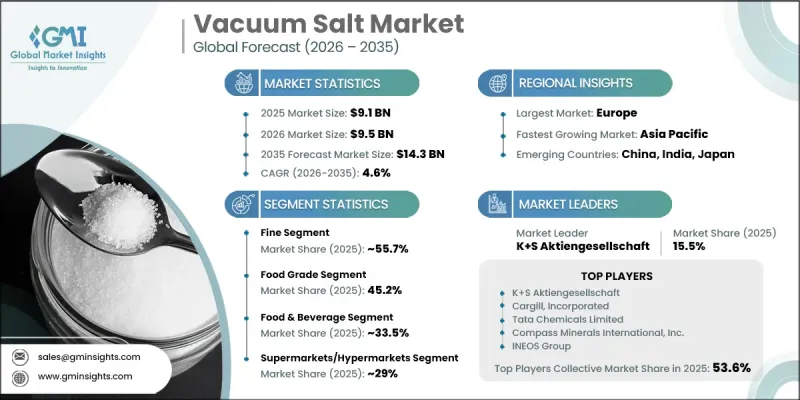
市場擴張的驅動力在於消費者對符合嚴格品質和安全標準的高純度鹽產品的需求不斷成長。真空鹽是在受控真空條件下蒸發鹽水製成的,以其高純度、均勻的顆粒結構和低雜質含量而廣受認可。這些特性使其非常適用於食品加工、藥品配方和工業化學品的生產。其應用範圍涵蓋食品保鮮和增味,以及氯氣生產、苛性鈉生產、水處理和水軟化等製程。消費者對產品純度和健康問題的日益關注進一步推動了對無添加劑鹽溶液的需求。工業成長和城市發展也促進了各終端用戶產業的穩定消費。隨著各行業持續重視品質和效率,在應用範圍不斷擴大和製造製程技術進步的推動下,全球真空鹽市場預計將保持穩定的成長動能。
| 市場範圍 | |
|---|---|
| 開始年份 | 2025 |
| 預測期 | 2026-2035 |
| 上市時的市場規模 | 91億美元 |
| 預計金額 | 143億美元 |
| 複合年成長率 | 4.6% |
預計到2025年,細鹽市佔率將達到55.7%,並在2035年之前以4.9%的複合年成長率成長。細鹽因其高純度和均勻的粒徑而廣受歡迎,尤其適用於對精度和品質要求較高的應用。在配方控制至關重要的食品加工和製藥領域,細鹽的應用日益廣泛。其均勻的結構有助於實現精確混合併提高產品一致性,從而推動了其在眾多行業的應用。
預計到2025年,食品級鹽的市佔率將達到45.2%,並在2026年至2035年間以4.7%的複合年成長率成長。此細分市場的需求成長主要受加工食品和包裝食品消費量增加以及消費者對安全和品質標準日益重視的推動。製造商正在擴大高純度鹽的使用,以滿足嚴格的監管要求和消費者期望。工業級鹽繼續為化學和水處理應用提供支持,從而在基礎設施主導行業中保持穩定的需求。
預計到2025年,北美真空鹽市佔率將達到20.1%。該地區的需求成長主要得益於食品加工、水處理和工業製造等領域應用範圍的擴大。先進生產系統和嚴格品質標準的採用,也促進了精製鹽產品的高普及率。此外,人們對環境永續性和水淨化的日益關注也推動了需求成長,使該地區成為全球市場成長的主要驅動力。
目錄
第1章:調查方法和範圍
第2章執行摘要
第3章 行業洞察
- 產業生態系分析
- 供應商情況
- 利潤率
- 每個階段增加的價值
- 影響價值鏈的因素
- 中斷
- 影響產業的因素
- 促進因素
- 產業潛在風險與挑戰
- 市場機遇
- 成長潛力分析
- 監理情勢
- 波特的分析
- PESTLE分析
- 價格趨勢
- 按地區
- 按類型
- 未來市場趨勢
- 技術與創新展望
- 最新科技趨勢
- 新興技術
- 專利趨勢
- 貿易統計
- 主要進口國
- 主要出口國
- 永續性和環境方面
- 永續計劃
- 減少廢棄物策略
- 生產中的能源效率
- 具有環保意識的舉措
- 考慮碳足跡
第4章 競爭情勢
- 介紹
- 企業市佔率分析
- 按地區
- 北美洲
- 歐洲
- 亞太地區
- LATAM
- 中東和非洲
- 按地區
- 企業矩陣分析
- 主要市場公司的競爭分析
- 競爭定位矩陣
- 主要進展
- 併購
- 夥伴關係和聯盟
- 新產品發布
- 業務拓展計劃
第5章 市場估算與預測:依產品類型分類,2022-2035年
- 顆粒狀
- 細粉
第6章 市場估算與預測:依等級分類,2022-2035年
- 食品級
- 工業級
- 醫藥級
第7章 市場估計與預測:依應用領域分類,2022-2035年
- 食品/飲料
- 化工
- 水處理
- 製藥
- 其他
第8章 市場估算與預測:依通路分類,2022-2035年
- 線上零售
- 超級市場和大賣場
- 專賣店
- 直銷
- 其他
第9章 市場估計與預測:依地區分類,2022-2035年
- 北美洲
- 美國
- 加拿大
- 歐洲
- 德國
- 英國
- 法國
- 西班牙
- 義大利
- 其他歐洲國家
- 亞太地區
- 中國
- 印度
- 日本
- 澳洲
- 韓國
- 其他亞太國家
- 拉丁美洲
- 巴西
- 墨西哥
- 阿根廷
- 其他拉丁美洲國家
- 中東和非洲
- 沙烏地阿拉伯
- 南非
- UAE
- 其他中東和非洲國家
第10章:公司簡介
- K+S Aktiengesellschaft
- Tata Chemicals Limited
- INEOS Group
- Nobian
- Compass Minerals International, Inc.
- Cargill, Incorporated
- Sudwestdeutsche Salzwerke AG
- Dominion Salt Limited
- Cheetham Salt
- WA Salt Group
- Salins Group
- ACI Limited
- Infosa
- Nirma Limited
The Global Vacuum Salt Market was valued at USD 9.1 billion in 2025 and is estimated to grow at a CAGR of 4.6% to reach USD 14.3 billion by 2035.
Expansion is driven by the growing requirement for high-purity salt products that meet strict quality and safety standards. Vacuum salt, produced through the evaporation of brine under controlled vacuum conditions, is widely recognized for its high purity, uniform grain structure, and low impurity levels. These characteristics make it highly suitable for food processing, pharmaceutical formulations, and industrial chemical production. Its applications extend across food preservation, flavor enhancement, chlorine production, caustic soda manufacturing, water treatment, and softening processes. Rising consumer awareness regarding product purity and health considerations is further supporting demand for additive-free salt solutions. Industrial growth and urban development are also contributing to consistent consumption across end-use sectors. As industries continue to prioritize quality and efficiency, the global vacuum salt market is expected to maintain stable growth momentum driven by expanding applications and technological improvements in production processes.
| Market Scope | |
|---|---|
| Start Year | 2025 |
| Forecast Year | 2026-2035 |
| Start Value | $9.1 Billion |
| Forecast Value | $14.3 Billion |
| CAGR | 4.6% |
The fine salt segment accounted for 55.7% share in 2025 and is expected to grow at a CAGR of 4.9% through 2035. This segment remains widely preferred due to its high purity and consistent particle size, making it suitable for applications requiring precision and quality. Fine salt is increasingly used in food processing and pharmaceutical applications where controlled formulation is essential. Its uniform structure supports accurate blending and improved product consistency, strengthening its adoption across multiple industries.
The food grade segment held a 45.2% share in 2025 and is projected to grow at a CAGR of 4.7% from 2026 to 2035. Demand in this segment is driven by increasing consumption of processed and packaged foods along with rising emphasis on safety and quality standards. Manufacturers are increasingly adopting high-purity salt to meet stringent regulatory requirements and consumer expectations. Industrial-grade salt continues to support chemical processing and water treatment applications, maintaining steady demand across infrastructure-driven sectors.
North America Vacuum Salt Market accounted for 20.1% share in 2025. Regional demand is supported by expanding applications across food processing, water treatment, and industrial manufacturing. The presence of advanced production systems and strict quality standards contributes to high adoption of purified salt products. Increasing focus on environmental sustainability and water purification is also strengthening demand, making the region a key contributor to global market growth.
Key companies operating in the Global Vacuum Salt Industry include ACI Limited, Cargill, Incorporated, Cheetham Salt, Compass Minerals International, Inc., Dominion Salt Limited, INEOS Group, Infosa, K+S Aktiengesellschaft, Nirma Limited, Nobian, Salins Group, Sudwestdeutsche Salzwerke AG, Tata Chemicals Limited, and WA Salt Group. Companies in the vacuum salt market are strengthening their position through capacity expansion, technological upgrades, and product quality enhancement strategies. Manufacturers are investing in advanced production technologies to improve purity levels, consistency, and operational efficiency. Strategic partnerships and distribution network expansion are helping companies reach a broader customer base across industrial and consumer segments. Many players are also focusing on sustainability initiatives, including energy-efficient production processes and reduced environmental impact. Product diversification is being adopted to cater to specialized applications in food, pharmaceuticals, and industrial processing.
Table of Contents
Chapter 1 Methodology & Scope
- 1.1 Market scope and definition
- 1.2 Research design
- 1.2.1 Research approach
- 1.2.2 Data collection methods
- 1.3 Data mining sources
- 1.3.1 Global
- 1.3.2 Regional/Country
- 1.4 Base estimates and calculations
- 1.4.1 Base year calculation
- 1.4.2 Key trends for market estimation
- 1.5 Primary research and validation
- 1.5.1 Primary sources
- 1.6 Forecast model
- 1.7 Research assumptions and limitations
Chapter 2 Executive Summary
- 2.1 Industry 360° synopsis
- 2.2 Key market trends
- 2.2.1 Regional
- 2.2.2 Product type
- 2.2.3 Grade
- 2.2.4 Application
- 2.2.5 Distribution channel
- 2.3 TAM Analysis, 2026-2035
- 2.4 CXO perspectives: Strategic imperatives
- 2.4.1 Executive decision points
Chapter 3 Industry Insights
- 3.1 Industry ecosystem analysis
- 3.1.1 Supplier landscape
- 3.1.2 Profit margin
- 3.1.3 Value addition at each stage
- 3.1.4 Factor affecting the value chain
- 3.1.5 Disruptions
- 3.2 Industry impact forces
- 3.2.1 Growth drivers
- 3.2.2 Industry pitfalls and challenges
- 3.2.3 Market opportunities
- 3.3 Growth potential analysis
- 3.4 Regulatory landscape
- 3.4.1 North America
- 3.4.2 Europe
- 3.4.3 Asia Pacific
- 3.4.4 Latin America
- 3.4.5 Middle East & Africa
- 3.5 Porter's analysis
- 3.6 PESTEL analysis
- 3.7 Price trends
- 3.7.1 By region
- 3.7.2 By type
- 3.8 Future market trends
- 3.9 Technology and Innovation landscape
- 3.9.1 Current technological trends
- 3.9.2 Emerging technologies
- 3.10 Patent Landscape
- 3.11 Trade statistics (HS code)
- 3.11.1 Major importing countries
- 3.11.2 Major exporting countries
- 3.12 Sustainability and environmental aspects
- 3.12.1 Sustainable practices
- 3.12.2 Waste reduction strategies
- 3.12.3 Energy efficiency in production
- 3.12.4 Eco-friendly initiatives
- 3.13 Carbon footprint consideration
Chapter 4 Competitive Landscape, 2025
- 4.1 Introduction
- 4.2 Company market share analysis
- 4.2.1 By region
- 4.2.1.1 North America
- 4.2.1.2 Europe
- 4.2.1.3 Asia Pacific
- 4.2.1.4 LATAM
- 4.2.1.5 MEA
- 4.2.1 By region
- 4.3 Company matrix analysis
- 4.4 Competitive analysis of major market players
- 4.5 Competitive positioning matrix
- 4.6 Key developments
- 4.6.1 Mergers & acquisitions
- 4.6.2 Partnerships & collaborations
- 4.6.3 New Product Launches
- 4.6.4 Expansion Plans
Chapter 5 Market Estimates and Forecast, By Product Type, 2022-2035 (USD Billion) (Kilo Tons)
- 5.1 Key trends
- 5.2 Granular
- 5.3 Fine
Chapter 6 Market Estimates and Forecast, By Grade, 2022-2035 (USD Billion) (Kilo Tons)
- 6.1 Key trends
- 6.2 Food grade
- 6.3 Industrial grade
- 6.4 Pharmaceutical grade
Chapter 7 Market Estimates and Forecast, By Application, 2022-2035 (USD Billion) (Kilo Tons)
- 7.1 Key trends
- 7.2 Food and beverage
- 7.3 Chemical industry
- 7.4 Water treatment
- 7.5 Pharmaceuticals
- 7.6 Others
Chapter 8 Market Estimates and Forecast, By Distribution channel, 2022-2035 (USD Billion) (Kilo Tons)
- 8.1 Key trends
- 8.2 Online retail
- 8.3 Supermarkets/hypermarkets
- 8.4 Specialty stores
- 8.5 Direct sales
- 8.6 Others
Chapter 9 Market Estimates and Forecast, By Region, 2022-2035 (USD Billion) (Kilo Tons)
- 9.1 Key trends
- 9.2 North America
- 9.2.1 U.S.
- 9.2.2 Canada
- 9.3 Europe
- 9.3.1 Germany
- 9.3.2 UK
- 9.3.3 France
- 9.3.4 Spain
- 9.3.5 Italy
- 9.3.6 Rest of Europe
- 9.4 Asia Pacific
- 9.4.1 China
- 9.4.2 India
- 9.4.3 Japan
- 9.4.4 Australia
- 9.4.5 South Korea
- 9.4.6 Rest of Asia Pacific
- 9.5 Latin America
- 9.5.1 Brazil
- 9.5.2 Mexico
- 9.5.3 Argentina
- 9.5.4 Rest of Latin America
- 9.6 Middle East and Africa
- 9.6.1 Saudi Arabia
- 9.6.2 South Africa
- 9.6.3 UAE
- 9.6.4 Rest of Middle East and Africa
Chapter 10 Company Profiles
- 10.1 K+S Aktiengesellschaft
- 10.2 Tata Chemicals Limited
- 10.3 INEOS Group
- 10.4 Nobian
- 10.5 Compass Minerals International, Inc.
- 10.6 Cargill, Incorporated
- 10.7 Sudwestdeutsche Salzwerke AG
- 10.8 Dominion Salt Limited
- 10.9 Cheetham Salt
- 10.10 WA Salt Group
- 10.11 Salins Group
- 10.12 ACI Limited
- 10.13 Infosa
- 10.14 Nirma Limited
