

 |
市場調查報告書
商品編碼
2038794
乙太網路切換器市場機會、成長要素、產業趨勢分析及2026-2035年預測Ethernet Switch Market Opportunity, Growth Drivers, Industry Trend Analysis, and Forecast 2026 - 2035 |
||||||
2025年全球乙太網路切換器市場價值為519億美元,預計到2035年將以10.6%的複合年成長率成長至1,433億美元。
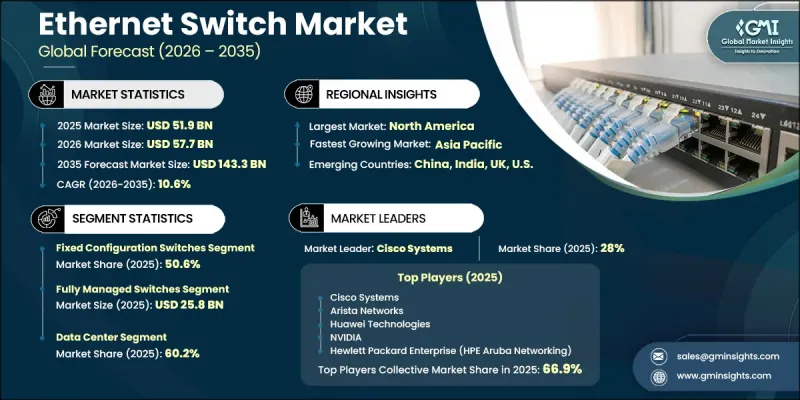
超大規模和託管資料中心的快速擴張、高速乙太網路技術的日益普及以及企業加速向雲端和混合IT環境遷移,共同推動了市場成長。邊緣運算和5G基礎設施的日益部署進一步刺激了對先進網路解決方案的需求。人工智慧工作負載和高效能運算的激增顯著提升了現代資料中心生態系統對高容量、低延遲交換架構的需求。同時,企業擴大採用網路自動化和意圖式網路來簡化維運並減少人工干預。向人工智慧主導的編配和自癒網路能力的轉變正在提高營運效率並縮短網路部署週期。企業IT基礎設施的持續現代化和資料流量的不斷成長,共同推動了可擴展、可程式設計乙太網路交換解決方案在各行業的廣泛應用。
| 市場範圍 | |
|---|---|
| 開始年份 | 2025 |
| 預測期 | 2026-2035 |
| 上市時的市場規模 | 519億美元 |
| 預測金額 | 1433億美元 |
| 複合年成長率 | 10.6% |
到2025年,固定配置交換器市佔率將達到50.6%。這主要得益於企業接取和邊緣網路環境的強勁需求。這類交換器因其成本效益高、易於部署以及預先定義的連接埠架構而廣受歡迎,尤其適用於中小型網路配置。其可靠性和易管理性使其非常適合園區網路、分店和其他需要穩定連接且配置簡單的分散式企業環境。
預計2025年,全管理型交換器市場規模將達258億美元。由於企業網路和資料中心對高階流量控制、安全功能和效能最佳化的需求,全管理型交換器市場持續佔據主導地位。全管理型交換器支援網路監控、VLAN配置、QoS控制和自動化整合等功能,使其成為複雜IT基礎設施的必備工具。此外,它們與軟體定義網路(SDN)環境的兼容性進一步提升了其在現代網路架構中的重要性。
預計到2025年,北美乙太網路切換器市場佔有率將達到47.9%,這主要得益於對超大規模資料中心的大力投資、人工智慧基礎設施的建設以及雲端運算在全部區域快速發展。高速乙太網路解決方案的日益普及,滿足了資料密集型應用和分散式網路環境不斷成長的需求。此外,該地區在軟體定義網路(SDN)、邊緣運算系統和新一代5G基礎設施的部署方面也取得了顯著進展。公共和私營部門的持續投資正在加強數位轉型,並推動大規模網路的現代化。
目錄
第1章:調查方法和範圍
第2章執行摘要
第3章業界考察
- 生態系分析
- 供應商情況
- 利潤率
- 成本結構
- 每個階段增加的價值
- 影響價值鏈的因素
- 中斷
- 影響產業的因素
- 促進因素
- 面向人工智慧工作負載的超大規模資料中心擴展
- 400G 和 800G 交換器的快速普及
- 企業向雲端基礎設施遷移
- 邊緣運算在全球範圍內的廣泛應用
- 5G網路的部署將增加回程傳輸的需求。
- 產業潛在風險與挑戰
- 高速交換器的初始成本較高
- 半導體元件供應鏈的波動
- 市場機遇
- 人工智慧驅動的網路需要超低延遲交換
- 新興市場資料中心擴張
- 促進因素
- 成長潛力分析
- 監理情勢
- 北美洲
- 歐洲
- 亞太地區
- 拉丁美洲
- 中東和非洲
- 波特五力分析
- PESTEL 分析
- 科技與創新趨勢
- 當前技術趨勢
- 新興技術
- 價格趨勢
- 按地區
- 依產品
- 定價策略
- 新興經營模式
- 合規要求
- 專利和智慧財產權分析
第4章 競爭情勢
- 介紹
- 企業市佔率分析
- 按地區
- 北美洲
- 歐洲
- 亞太地區
- 拉丁美洲
- 中東和非洲
- 市場集中度分析
- 按地區
- 主要公司的競爭標竿分析
- 財務績效比較
- 銷售量
- 利潤率
- 研究與開發
- 產品系列比較
- 產品線寬度
- 科技
- 創新
- 區域擴張比較
- 全球擴張分析
- 服務網路覆蓋
- 按地區分類的市場滲透率
- 競爭定位矩陣
- 領導者
- 挑戰者
- 追蹤者
- 小眾玩家
- 戰略展望矩陣
- 財務績效比較
- 主要進展
- 併購
- 夥伴關係和聯盟
- 技術進步
- 業務拓展與投資策略
- 數位轉型計劃
- 新興競爭對手和新創競爭對手的發展趨勢
第5章 市場估價與預測:依開關類型分類,2022-2035年
- 模組化開關
- 固定配置交換機
- 可堆疊開關
第6章 市場估算與預測:依管理功能分類,2022-2035年
- 非網管型交換機
- 智慧開關
- 全管理型交換機
第7章 市場估計與預測:依轉換細分市場分類,2022-2035年
- 二層(L2)交換機
- 三層(L3)交換機
第8章 市場估算與預測:以港口速度分類,2022-2035年
- 快速乙太網路(最高可達 100 Mbps)
- Gigabit乙太網路(1 Gbps)
- 10Gigabit乙太網路(10 Gbps)
- 25/40Gigabit乙太網路 (25–40 Gbps)
- 200/400Gigabit乙太網路 (200–400 Gbps)
- 800Gigabit或更高(800 Gbps 或更高)
第9章 市場估計與預測:依最終用途分類,2022-2035年
- 資料中心
- 企業網路
- 工業和製造業
- 電信/服務供應商
第10章 市場估價與預測:依地區分類,2022-2035年
- 北美洲
- 美國
- 加拿大
- 歐洲
- 德國
- 英國
- 法國
- 西班牙
- 義大利
- 亞太地區
- 中國
- 印度
- 日本
- 澳洲
- 韓國
- 拉丁美洲
- 巴西
- 墨西哥
- 中東和非洲
- 南非
- 沙烏地阿拉伯
- 阿拉伯聯合大公國
第11章:公司簡介
- 全球主要公司
- Cisco Systems
- Huawei Technologies
- Hewlett Packard Enterprise(HPE Aruba Networking)
- Arista Networks
- Juniper Networks
- Nokia
- Dell Technologies
- 按地區分類的主要公司
- 北美洲
- Extreme Networks
- NETGEAR
- Fortinet
- 亞太地區
- H3C
- ZTE Corporation
- TP-Link
- 歐洲
- Siemens
- Belden Inc.(Hirschmann)
- 北美洲
- 特殊玩家/干擾者
- FS.com
- Edgecore Networks
- Allied Telesis
- Moxa
- D-Link Corporation
The Global Ethernet Switch Market was valued at USD 51.9 billion in 2025 and is estimated to grow at a CAGR of 10.6% to reach USD 143.3 billion by 2035.
The market is witnessing growth driven by the rapid expansion of hyperscale and colocation data centers, rising adoption of high-speed Ethernet technologies, and the increasing shift of enterprises toward cloud-based and hybrid IT environments. The growing deployment of edge computing and 5G infrastructure is further accelerating demand for advanced networking solutions. The surge in AI workloads and high-performance computing is significantly increasing the need for high-capacity, low-latency switching architectures within modern data center ecosystems. At the same time, enterprises are increasingly adopting network automation and intent-based networking to simplify operations and reduce manual intervention. The transition toward AI-driven orchestration and self-healing network capabilities is improving operational efficiency and enabling faster network provisioning cycles. Continuous modernization of enterprise IT infrastructure, combined with rising data traffic volumes, is strengthening the adoption of scalable and programmable Ethernet switching solutions across industries.
| Market Scope | |
|---|---|
| Start Year | 2025 |
| Forecast Year | 2026-2035 |
| Start Value | $51.9 Billion |
| Forecast Value | $143.3 Billion |
| CAGR | 10.6% |
The fixed configuration switches segment accounted for 50.6% share in 2025, supported by strong demand in enterprise access and edge network environments. These switches are widely preferred due to their cost-effectiveness, simplified deployment, and predefined port structures that suit small and mid-sized network setups. Their reliability and ease of management make them suitable for campus networks, branch offices, and other distributed enterprise environments where stable connectivity is required with minimal complexity.
The fully managed switches segment reached USD 25.8 billion in 2025. This segment continues to dominate due to its extensive deployment in enterprise networks and data centers that require advanced traffic control, security features, and performance optimization. Fully managed switches support capabilities such as network monitoring, VLAN configuration, quality of service controls, and automation integration, making them essential for complex IT infrastructures. Their compatibility with software-defined networking environments further enhances their importance in modern network architectures.
North America Ethernet Switch Market held a 47.9% share in 2025, driven by strong investments in hyperscale data centers, AI infrastructure development, and rapid cloud computing expansion across the region. Increasing adoption of high-speed Ethernet solutions is supporting the growing demand for data-intensive applications and distributed network environments. The region is also witnessing significant deployment of software-defined networking, edge computing systems, and next-generation 5G infrastructure. Continued investments from both public and private sectors are strengthening digital transformation initiatives and supporting large-scale network modernization.
Key companies operating in the Global Ethernet Switch Market include Cisco Systems, Arista Networks, Juniper Networks, Huawei Technologies, Hewlett Packard Enterprise (HPE Aruba Networking), Dell Technologies, Nokia, Extreme Networks, Allied Telesis, Belden Inc. (Hirschmann), Edgecore Networks, D-Link Corporation, Fortinet, H3C, FS.com, NETGEAR, TP-Link, Siemens, Moxa, and ZTE Corporation. Companies in the Ethernet Switch Market are focusing on strengthening their competitive position through continuous innovation in high-speed networking technologies and advanced software integration. Many players are investing in scalable architectures that support cloud, edge, and hybrid IT environments while enhancing performance and flexibility. Expansion of AI-driven network automation and intent-based networking solutions is a key strategy to improve operational efficiency and reduce network complexity. Firms are also prioritizing the development of high-capacity switches that support increasing data traffic demands from AI and hyperscale data centers. Strategic partnerships with cloud service providers and data center operators are helping expand market reach. Additionally, companies are enhancing cybersecurity capabilities within switching systems to support secure enterprise networks. Continuous R&D investment, along with advancements in programmable networking and software-defined infrastructure, is further strengthening long-term market competitiveness and global positioning.
Table of Contents
Chapter 1 Methodology and Scope
- 1.1 Market scope and definition
- 1.2 Research design
- 1.2.1 Research approach
- 1.2.2 Data collection methods
- 1.3 Data mining sources
- 1.3.1 Global
- 1.3.2 Regional/Country
- 1.4 Base estimates and calculations
- 1.4.1 Base year calculation
- 1.4.2 Key trends for market estimation
- 1.5 Primary research and validation
- 1.5.1 Primary sources
- 1.6 Forecast model
- 1.7 Research assumptions and limitations
Chapter 2 Executive Summary
- 2.1 Industry 360° synopsis, 2022 - 2035
- 2.2 Key market trends
- 2.2.1 Switch type trends
- 2.2.2 Management capability trends
- 2.2.3 Switching layer capability trends
- 2.2.4 Port speed trends
- 2.2.5 End-use application trends
- 2.2.6 Regional trends
- 2.3 TAM Analysis, 2026-2035
- 2.4 CXO perspectives: Strategic imperatives
Chapter 3 Industry Insights
- 3.1 Industry ecosystem analysis
- 3.1.1 Supplier Landscape
- 3.1.2 Profit Margin
- 3.1.3 Cost structure
- 3.1.4 Value addition at each stage
- 3.1.5 Factor affecting the value chain
- 3.1.6 Disruptions
- 3.2 Industry impact forces
- 3.2.1 Growth drivers
- 3.2.1.1 Hyperscale data center expansion for AI workloads
- 3.2.1.2 Rapid adoption of 400G and 800G switching
- 3.2.1.3 Enterprise migration to cloud-based infrastructure
- 3.2.1.4 Growth of edge computing deployments globally
- 3.2.1.5 5G network rollout increasing backhaul demand
- 3.2.2 Industry pitfalls and challenges
- 3.2.2.1 High upfront cost of high-speed switches
- 3.2.2.2 Supply chain volatility in semiconductor components
- 3.2.3 Market opportunities
- 3.2.3.1 AI-driven networking requiring ultra-low latency switching
- 3.2.3.2 Expansion of data centers in emerging markets
- 3.2.1 Growth drivers
- 3.3 Growth potential analysis
- 3.4 Regulatory landscape
- 3.4.1 North America
- 3.4.2 Europe
- 3.4.3 Asia Pacific
- 3.4.4 Latin America
- 3.4.5 Middle East & Africa
- 3.5 Porter's analysis
- 3.6 PESTEL analysis
- 3.7 Technology and Innovation landscape
- 3.7.1 Current technological trends
- 3.7.2 Emerging technologies
- 3.8 Price trends
- 3.8.1 By region
- 3.8.2 By product
- 3.9 Pricing Strategies
- 3.10 Emerging Business Models
- 3.11 Compliance Requirements
- 3.12 Patent and IP analysis
Chapter 4 Competitive Landscape, 2025
- 4.1 Introduction
- 4.2 Company market share analysis
- 4.2.1 By region
- 4.2.1.1 North America
- 4.2.1.2 Europe
- 4.2.1.3 Asia Pacific
- 4.2.1.4 Latin America
- 4.2.1.5 Middle East & Africa
- 4.2.2 Market concentration analysis
- 4.2.1 By region
- 4.3 Competitive benchmarking of key players
- 4.3.1 Financial performance comparison
- 4.3.1.1 Revenue
- 4.3.1.2 Profit margin
- 4.3.1.3 R&D
- 4.3.2 Product portfolio comparison
- 4.3.2.1 Product range breadth
- 4.3.2.2 Technology
- 4.3.2.3 Innovation
- 4.3.3 Geographic presence comparison
- 4.3.3.1 Global footprint analysis
- 4.3.3.2 Service network coverage
- 4.3.3.3 Market penetration by region
- 4.3.4 Competitive positioning matrix
- 4.3.4.1 Leaders
- 4.3.4.2 Challengers
- 4.3.4.3 Followers
- 4.3.4.4 Niche players
- 4.3.5 Strategic outlook matrix
- 4.3.1 Financial performance comparison
- 4.4 Key developments
- 4.4.1 Mergers and acquisitions
- 4.4.2 Partnerships and collaborations
- 4.4.3 Technological advancements
- 4.4.4 Expansion and investment strategies
- 4.4.5 Digital transformation initiatives
- 4.5 Emerging/ startup competitors landscape
Chapter 5 Market Estimates and Forecast, By Switch Type, 2022 - 2035 (USD Million)
- 5.1 Key trends
- 5.2 Modular switches
- 5.3 Fixed configuration switches
- 5.4 Stackable switches
Chapter 6 Market Estimates and Forecast, By Management Capability, 2022 - 2035 (USD Million)
- 6.1 Key trends
- 6.2 Unmanaged switches
- 6.3 Smart switches
- 6.4 Fully managed switches
Chapter 7 Market Estimates and Forecast, By Switching Layer Capability, 2022 - 2035 (USD Million)
- 7.1 Key trends
- 7.2 Layer 2 (L2) switches
- 7.3 Layer 3 (L3) switches
Chapter 8 Market Estimates and Forecast, By Port Speed, 2022 - 2035 (USD Million)
- 8.1 Key trends
- 8.2 Fast ethernet (Up to 100 Mbps)
- 8.3 gigabit ethernet (1 Gbps)
- 8.4 10 gigabit ethernet (10 Gbps)
- 8.5 25/40 gigabit ethernet (25-40 Gbps)
- 8.6 200/400 gigabit ethernet (200-400 Gbps)
- 8.7 800 gigabit & above (≥800 Gbps)
Chapter 9 Market Estimates and Forecast, By End-Use Application, 2022 - 2035 (USD Million)
- 9.1 Key trends
- 9.2 Data center
- 9.3 Enterprise networks
- 9.4 Industrial & manufacturing
- 9.5 Telecom/service provider
Chapter 10 Market Estimates and Forecast, By Region, 2022 - 2035 (USD Million)
- 10.1 Key trends
- 10.2 North America
- 10.2.1 U.S.
- 10.2.2 Canada
- 10.3 Europe
- 10.3.1 Germany
- 10.3.2 UK
- 10.3.3 France
- 10.3.4 Spain
- 10.3.5 Italy
- 10.4 Asia Pacific
- 10.4.1 China
- 10.4.2 India
- 10.4.3 Japan
- 10.4.4 Australia
- 10.4.5 South Korea
- 10.5 Latin America
- 10.5.1 Brazil
- 10.5.2 Mexico
- 10.6 Middle East and Africa
- 10.6.1 South Africa
- 10.6.2 Saudi Arabia
- 10.6.3 UAE
Chapter 11 Company Profiles
- 11.1 Global Key Players
- 11.1.1 Cisco Systems
- 11.1.2 Huawei Technologies
- 11.1.3 Hewlett Packard Enterprise (HPE Aruba Networking)
- 11.1.4 Arista Networks
- 11.1.5 Juniper Networks
- 11.1.6 Nokia
- 11.1.7 Dell Technologies
- 11.2 Regional key players
- 11.2.1 North America
- 11.2.1.1 Extreme Networks
- 11.2.1.2 NETGEAR
- 11.2.1.3 Fortinet
- 11.2.2 Asia Pacific
- 11.2.2.1 H3C
- 11.2.2.2 ZTE Corporation
- 11.2.2.3 TP-Link
- 11.2.3 Europe
- 11.2.3.1 Siemens
- 11.2.3.2 Belden Inc. (Hirschmann)
- 11.2.1 North America
- 11.3 Niche Players/Disruptors
- 11.3.1 FS.com
- 11.3.2 Edgecore Networks
- 11.3.3 Allied Telesis
- 11.3.4 Moxa
- 11.3.5 D-Link Corporation
 乙太網路切換器市場 - 全球產業規模、佔有率、趨勢、機會、預測:按類型、配置、速度、地區和競爭格局分類,2021-2031年
 DCIM市場規模、佔有率和成長分析:按組件、部署模式、資料中心規模、應用、銷售管道和地區分類-2026年至2033年產業預測
 乙太網路切換器晶片市場分析及預測(至2035年):類型、產品、技術、組件、應用、部署、最終用戶、功能、安裝配置
 工業乙太網交換器市場:2026年至2032年全球市場預測(依產品類型、硬體配置類型、通訊協定、連接埠數量、安裝方式、頻寬和最終用戶分類)非網管型工業乙太網交換器市場:依安裝類型、連接埠配置、IP防護等級、最終用途、企業規模及銷售管道分類-2026-2032年全球市場預測
 2026年全球工業乙太網交換器市場報告PoE供電市場:按通訊協定、連接埠數量、安裝方式、連接器和最終用戶分類-2026-2032年全球預測2026年全球乙太網路切換器市場報告企業乙太網路接取交換器市場:依產品類型、連接埠速度、管理類型、連接埠數量、組織規模、部署模式、應用程式和最終用戶產業分類-2026-2032年全球預測DCIM市場分析及至2035年預測:按類型、產品、服務、技術、組件、應用、部署模式、最終用戶、功能和解決方案分類