

 |
市場調查報告書
商品編碼
2038766
低鈉海鹽市場商機、成長要素、產業趨勢分析及2026-2035年預測。Low Sodium Sea Salt Market Opportunity, Growth Drivers, Industry Trend Analysis, and Forecast 2026 - 2035 |
||||||

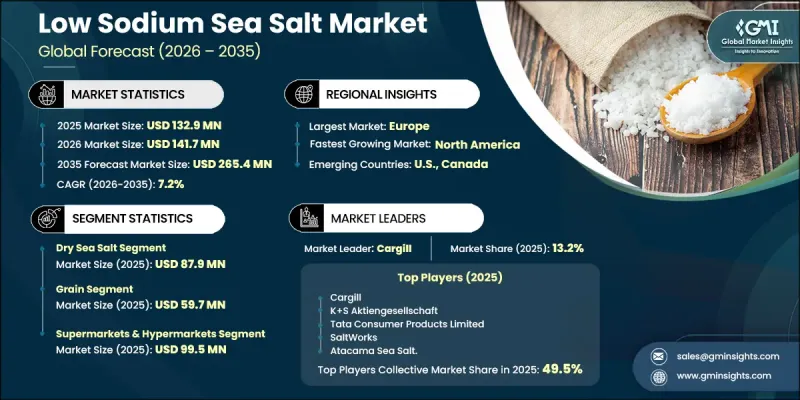
2025 年全球低鈉海鹽市場價值為 1.329 億美元,預計到 2035 年將以 7.2% 的複合年成長率成長至 2.654 億美元。
隨著消費者越來越重視健康的飲食習慣,並尋求既能減少鈉攝取又不影響口感的替代品,低鈉海鹽產業正穩步發展。低鈉海鹽提取自海水,經過加工或天然平衡處理,在保留有益礦物質的同時,顯著降低了鈉含量。這使其成為那些既想維持營養均衡又想滿足口味偏好的消費者的理想選擇。從家庭廚房到食品加工廠,低鈉海鹽的應用十分廣泛,尤其在需要保持口味一致性並遵循飲食指南的情況下,它更是不可或缺。低鈉海鹽擁有多種質地,可用於各種烹飪用途,從而推動了市場需求的成長。消費者對潔淨標示成分和低加工食品的日益關注,也進一步促進了市場成長。精煉技術、礦物質成分平衡和混合過程的不斷改進,提升了產品質量,確保其在各種食品應用中都能保持穩定的口感和性能。
| 市場規模 | |
|---|---|
| 開始年份 | 2025 |
| 預測期 | 2026-2035 |
| 上市時的市場規模 | 1.329億美元 |
| 預測金額 | 2.654億美元 |
| 複合年成長率 | 7.2% |
到2025年,低鈉乾海鹽市場規模將達到8,790萬美元。由於其易於儲存、保存期限長,且廣泛適用於包裝食品和加工食品,因此其受歡迎程度持續成長。這種形態的穩定性使其可用於調味料、零食生產和日常烹飪,從而在零售、餐飲服務和工業領域保持了強勁的需求。
預計到 2025 年,超級市場和大賣場市場規模將達到 9,950 萬美元。由於商品種類繁多、交通便利、價格具有競爭力,並且能夠滿足消費者的日常需求,這些零售業態仍然是消費者首選的購物場所。
預計北美低鈉海鹽市場規模將從2025年的3,540萬美元成長到2035年的7,010萬美元。消費者對更健康的鹽替代品和天然成分日益成長的興趣正在推動全部區域的需求。隨著消費者對低鈉產品的認知度不斷提高,零售店和數位平台的產品推廣也進一步促進了市場成長。
目錄
第1章:調查方法和範圍
第2章執行摘要
第3章業界考察
- 生態系分析
- 供應商情況
- 利潤率
- 每個階段增加的價值
- 影響價值鏈的因素
- 中斷
- 影響產業的因素
- 促進因素
- 對低鈉飲食的需求日益成長
- 人們對心臟健康的認知不斷提高
- 加工食品中用量增加
- 陷阱與挑戰
- 它比普通食鹽貴。
- 本地市場認知度低
- 機會
- 開發功能性健康產品
- 人們對富含礦產資源的替代資源的興趣日益濃厚
- 促進因素
- 成長潛力分析
- 監理情勢
- 北美洲
- 歐洲
- 亞太地區
- 拉丁美洲
- 中東和非洲
- 波特五力分析
- PESTEL 分析
- 科技與創新趨勢
- 當前技術趨勢
- 新興技術
- 價格趨勢
- 按地區
- 依產品類型
- 未來市場趨勢
- 科技與創新趨勢
- 當前技術趨勢
- 新興技術
- 專利趨勢
- 貿易統計(HS編碼)
- 主要進口國
- 主要出口國
- 永續性和環境方面
- 永續計劃
- 減少廢棄物策略
- 生產中的能源效率
- 環保意識的舉措
- 考慮碳足跡
第4章 競爭情勢
- 介紹
- 企業市佔率分析
- 按地區
- 北美洲
- 歐洲
- 亞太地區
- 拉丁美洲
- 中東和非洲(MEA)
- 按地區
- 企業矩陣分析
- 主要市場公司的競爭分析
- 競爭定位矩陣
- 主要進展
- 併購
- 夥伴關係和聯盟
- 新產品發布
- 業務拓展計劃
第5章 市場估算與預測:依產品類型分類,2022-2035年
- 濕海鹽
- 乾海鹽
第6章 市場估計與預測:依類型分類,2022-2035年
- 顆粒狀
- 薄片
- 噴
第7章 市場估價與預測:依通路分類,2022-2035年
- 超級市場和大賣場
- 便利商店
- 線上零售商
- 專賣店
- 其他
第8章 市場估計與預測:依地區分類,2022-2035年
- 北美洲
- 美國
- 加拿大
- 歐洲
- 德國
- 英國
- 法國
- 西班牙
- 義大利
- 其他歐洲地區
- 亞太地區
- 中國
- 印度
- 日本
- 澳洲
- 韓國
- 亞太其他地區
- 拉丁美洲
- 巴西
- 墨西哥
- 阿根廷
- 其他拉丁美洲地區
- 中東和非洲
- 沙烏地阿拉伯
- 南非
- 阿拉伯聯合大公國
- 其他中東和非洲地區
第9章:公司簡介
- A&B Ingredients, Inc
- Atacama Sea Salt.
- Cargill
- K+S Aktiengesellschaft
- SaltWorks
- Tata Consumer Products Limited
- THE LOW SODIUM SEA SALT COMPANY
- Ahir Salt Industries
- Krishna Group
- Merisal Sea Salt
The Global Low Sodium Sea Salt Market was valued at USD 132.9 million in 2025 and is estimated to grow at a CAGR of 7.2% to reach USD 265.4 million by 2035.
The industry is gaining steady traction as consumers increasingly prioritize healthier dietary choices and seek alternatives that help reduce sodium intake without compromising flavor. Low sodium sea salt is derived from seawater and processed or naturally balanced to contain reduced sodium levels compared to traditional salt, while still retaining beneficial minerals. This makes it an appealing option for individuals aiming to maintain nutritional balance alongside taste preferences. The product is widely used across both household kitchens and commercial food production environments, where maintaining flavor consistency while adhering to dietary guidelines is essential. Its availability in various textures supports diverse culinary applications, contributing to its growing demand. Rising awareness around clean-label ingredients and minimally processed foods is further driving market expansion. Continuous improvements in refining techniques, mineral composition balancing, and blending processes are enhancing product quality, ensuring consistent taste and performance across different food applications.
| Market Scope | |
|---|---|
| Start Year | 2025 |
| Forecast Year | 2026-2035 |
| Start Value | $132.9 Million |
| Forecast Value | $265.4 Million |
| CAGR | 7.2% |
The dry low sodium sea salt segment accounted for USD 87.9 million in 2025. Its popularity continues to rise due to its ease of storage, extended shelf life, and versatility in packaged and processed food applications. The stable nature of this format supports its use across seasoning mixes, snack production, and routine cooking needs, sustaining demand across retail, foodservice, and industrial sectors.
The supermarkets and hypermarkets segment reached USD 99.5 million in 2025. These retail formats remain the preferred purchasing points as they offer a wide range of options, easy accessibility, and competitive pricing, making them convenient for everyday consumer needs.
North America Low Sodium Sea Salt Market is projected to grow from USD 35.4 million in 2025 to USD 70.1 million by 2035. Increasing consumer inclination toward healthier salt alternatives and naturally sourced ingredients is fueling demand across the region. Greater product visibility through retail outlets and digital platforms is further supporting market growth as awareness of reduced-sodium options continues to rise.
Key players operating in the Global Low Sodium Sea Salt Market include Cargill, Tata Consumer Products Limited, SaltWorks, K+S Aktiengesellschaft, A&B Ingredients, Inc, THE LOW SODIUM SEA SALT COMPANY, Atacama Sea Salt, Merisal Sea Salt, Ahir Salt Industries, and Krishna Group. Companies in the Low Sodium Sea Salt Market are reinforcing their market position through product innovation and the development of formulations that balance taste with reduced sodium content. Investment in advanced processing technologies is helping improve product consistency and mineral composition. Strategic distribution partnerships are being expanded to increase product availability across retail and online channels. Businesses are also focusing on branding and marketing strategies that highlight health benefits and clean-label attributes to attract health-conscious consumers. Additionally, companies are strengthening supply chains and exploring new regional markets to enhance their reach.
Table of Contents
Chapter 1 Methodology & Scope
- 1.1 Market scope and definition
- 1.2 Research design
- 1.2.1 Research approach
- 1.2.2 Data collection methods
- 1.3 Data mining sources
- 1.3.1 Global
- 1.3.2 Regional/Country
- 1.4 Base estimates and calculations
- 1.4.1 Base year calculation
- 1.4.2 Key trends for market estimation
- 1.5 Primary research and validation
- 1.5.1 Primary sources
- 1.6 Forecast model
- 1.7 Research assumptions and limitations
Chapter 2 Executive Summary
- 2.1 Industry 360° synopsis
- 2.2 Key market trends
- 2.2.1 Product Type
- 2.2.2 Form
- 2.2.3 Distribution Channel
- 2.2.4 Regional
- 2.3 TAM Analysis, 2026-2035
- 2.4 CXO perspectives: Strategic imperatives
- 2.5 Future outlook and strategic recommendations
Chapter 3 Industry Insights
- 3.1 Industry ecosystem analysis
- 3.1.1 Supplier landscape
- 3.1.2 Profit margin
- 3.1.3 Value addition at each stage
- 3.1.4 Factor affecting the value chain
- 3.1.5 Disruptions
- 3.2 Industry impact forces
- 3.2.1 Growth drivers
- 3.2.1.1 Rising demand for reduced-sodium diets
- 3.2.1.2 Growing awareness of heart health
- 3.2.1.3 Increasing use in packaged foods
- 3.2.2 Pitfalls/challenge
- 3.2.2.1 Higher price than regular salt
- 3.2.2.2 Limited awareness in rural markets
- 3.2.3 Opportunities
- 3.2.3.1 Expansion into functional wellness products
- 3.2.3.2 Growing interest in mineral-rich alternatives
- 3.2.1 Growth drivers
- 3.3 Growth potential analysis
- 3.4 Regulatory landscape
- 3.4.1 North America
- 3.4.2 Europe
- 3.4.3 Asia Pacific
- 3.4.4 Latin America
- 3.4.5 Middle East & Africa
- 3.5 Porter's analysis
- 3.6 PESTEL analysis
- 3.7 Technology and innovation landscape
- 3.7.1 Current technological trends
- 3.7.2 Emerging technologies
- 3.8 Price trends
- 3.8.1 By region
- 3.8.2 By product type
- 3.9 Future market trends
- 3.10 Technology and innovation landscape
- 3.10.1 Current technological trends
- 3.10.2 Emerging technologies
- 3.11 Patent landscape
- 3.12 Trade statistics (HS code)
- 3.12.1 Major importing countries
- 3.12.2 Major exporting countries
- 3.13 Sustainability and environmental aspects
- 3.13.1 Sustainable practices
- 3.13.2 Waste reduction strategies
- 3.13.3 Energy efficiency in production
- 3.13.4 Eco-friendly initiatives
- 3.14 Carbon footprint consideration
Chapter 4 Competitive Landscape, 2025
- 4.1 Introduction
- 4.2 Company market share analysis
- 4.2.1 By region
- 4.2.1.1 North America
- 4.2.1.2 Europe
- 4.2.1.3 Asia Pacific
- 4.2.1.4 LATAM
- 4.2.1.5 MEA
- 4.2.1 By region
- 4.3 Company matrix analysis
- 4.4 Competitive analysis of major market players
- 4.5 Competitive positioning matrix
- 4.6 Key developments
- 4.6.1 Mergers & acquisitions
- 4.6.2 Partnerships & collaborations
- 4.6.3 New product launches
- 4.6.4 Expansion plans
Chapter 5 Market Estimates and Forecast, By Product Type, 2022-2035 (USD Million) (Kilo Tons)
- 5.1 Key trends
- 5.2 Wet sea salt
- 5.3 Dry sea salt
Chapter 6 Market Estimates and Forecast, By Form, 2022-2035 (USD Million) (Kilo Tons)
- 6.1 Key trends
- 6.2 Grain
- 6.3 Flakes
- 6.4 Spray
Chapter 7 Market Estimates and Forecast, By Distribution Channel, 2022-2035 (USD Million) (Kilo Tons)
- 7.1 Key trends
- 7.2 Supermarkets & hypermarkets
- 7.3 Convenience stores
- 7.4 Online retailers
- 7.5 Specialty stores
- 7.6 Others
Chapter 8 Market Estimates and Forecast, By Region, 2022-2035 (USD Million) (Kilo Tons)
- 8.1 Key trends
- 8.2 North America
- 8.2.1 U.S.
- 8.2.2 Canada
- 8.3 Europe
- 8.3.1 Germany
- 8.3.2 UK
- 8.3.3 France
- 8.3.4 Spain
- 8.3.5 Italy
- 8.3.6 Rest of Europe
- 8.4 Asia Pacific
- 8.4.1 China
- 8.4.2 India
- 8.4.3 Japan
- 8.4.4 Australia
- 8.4.5 South Korea
- 8.4.6 Rest of Asia Pacific
- 8.5 Latin America
- 8.5.1 Brazil
- 8.5.2 Mexico
- 8.5.3 Argentina
- 8.5.4 Rest of Latin America
- 8.6 Middle East and Africa
- 8.6.1 Saudi Arabia
- 8.6.2 South Africa
- 8.6.3 UAE
- 8.6.4 Rest of Middle East and Africa
Chapter 9 Company Profiles
- 9.1 A&B Ingredients, Inc
- 9.2 Atacama Sea Salt.
- 9.3 Cargill
- 9.4 K+S Aktiengesellschaft
- 9.5 SaltWorks
- 9.6 Tata Consumer Products Limited
- 9.7 THE LOW SODIUM SEA SALT COMPANY
- 9.8 Ahir Salt Industries
- 9.9 Krishna Group
- 9.10 Merisal Sea Salt

 低鈉海鹽市場報告:趨勢、預測及競爭分析(至2035年)
 喜馬拉雅粉紅岩鹽市場-2026-2032年全球市場預測硫酸鎂市場-2026-2032年全球市場預測
 喜馬拉雅粉紅岩鹽市場報告:按類型、應用、分銷管道和地區分類,2026-2034年浴鹽市場:全球市場按產品類型、包裝、配方、最終用戶和分銷管道分類的預測 - 2026-2032年樹枝狀鹽市場:依產品類型、應用、最終用戶和通路分類-全球預測,2026-2032年死海鹽市場:全球市場按產品類型、形態、應用、分銷管道和最終用戶分類的預測——2026-2032年液壓浴鹽球成型機市場:依操作方式、機器類型、產能、終端用戶產業及銷售管道,全球預測(2026-2032年)
 浴鹽市場 - 全球產業規模、佔有率、趨勢、機會及預測(按類型、形式、銷售管道、地區和競爭格局分類,2021-2031年)
 按產品類型、應用、最終用戶、分銷管道和地區分類的瀉鹽市場規模、佔有率和成長分析 - 2026-2033 年產業預測