


 |
市場調查報告書
商品編碼
2038738
卡車市場商機、成長要素、產業趨勢分析及2026-2035年預測。Trucks Market Opportunity, Growth Drivers, Industry Trend Analysis, and Forecast 2026 - 2035 |
||||||

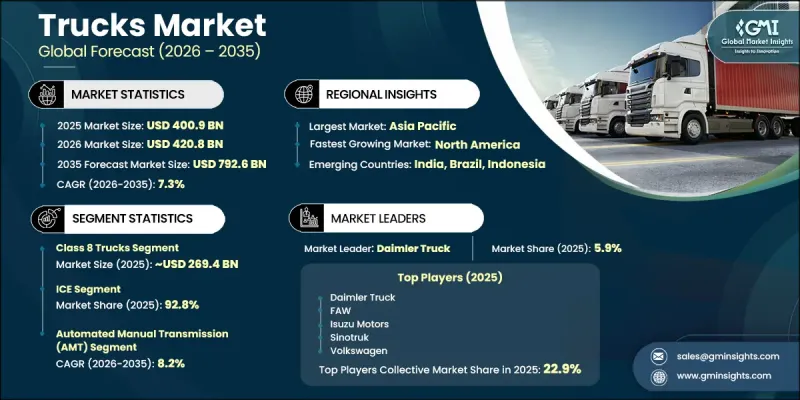
2025年全球卡車市場價值4,009億美元,預計到2035年將以7.3%的複合年成長率成長至7,926億美元。
市場成長與貨運需求的波動密切相關,而貨運需求又深受全部區域經濟趨勢的影響。物流網路的擴張和對運輸效率日益成長的重視,進一步塑造了行業趨勢。政府主導的旨在加強物流基礎設施的舉措,在支持市場發展方面發揮越來越重要的作用,尤其是在快速成長的經濟體中。公共投資增加、監管完善以及供應鏈效率提升計劃,都促進了貨運服務需求的成長,從而推動了中型和重型卡車需求的穩定成長。道路運輸,凸顯了以卡車為基礎的物流系統的重要性。同時,電氣化、車輛系統自動化、建築業的成長以及小包裹遞送服務的快速擴張等趨勢,正在推動產業結構性變革。這些因素共同作用,正在重塑全球卡車運輸生態系統中的車輛設計、營運模式和車輛所有權資金籌措結構。
| 市場範圍 | |
|---|---|
| 開始年份 | 2025 |
| 預測期 | 2026-2035 |
| 上市時的市場規模 | 4009億美元 |
| 預測金額 | 7926億美元 |
| 複合年成長率 | 7.3% |
到2025年,8級卡車市場將佔據67.2%的市場佔有率,並創造2,694億美元的收入。隨著先進技術廣泛整合到車輛系統中,該細分市場正在經歷重大變革。互聯車隊解決方案、自動化輔助和數位化監控工具等功能正在提升營運效率、安全性和成本控制。車隊營運商正加大對新一代車輛的投資,以提高生產力並最佳化物流績效。
預計2025年,內燃機市佔率將達到92.8%,市場規模達3,719億美元。其卓越的性能,尤其是在長途和重型運輸領域,支撐了其主導。完善的加油基礎設施、高扭力輸出和久經考驗的可靠性等技術優勢,使其成為全球商務傳輸營運的首選。
美國卡車市場預計到2025年將達到823億美元,並在2026年至2035年間以7.9%的複合年成長率成長。美國完善的物流生態系統和對長途公路貨運的高度依賴是成長要素。儘管旨在減少排放氣體的監管標準正在推動技術逐步轉型,但由於基礎設施建設和營運效率的要求,柴油車仍然佔據主導地位。
目錄
第1章:調查方法
第2章執行摘要
第3章業界考察
- 生態系分析
- 供應商情況
- 利潤率分析
- 成本結構
- 每個階段增加的價值
- 影響價值鏈的因素
- 中斷
- 影響產業的因素
- 促進因素
- 電子商務和最後一公里配送需求不斷成長
- 嚴格的排放法規旨在促進無污染燃料的推廣應用
- 基礎設施開發和建設活動的成長
- 政府對電動車和替代燃料卡車的獎勵
- 產業潛在風險與挑戰
- 電動和自動駕駛卡車的初始成本很高
- 缺乏替代燃料的充電和加註基礎設施
- 市場機遇
- 自動駕駛卡車技術的進步
- 氫燃料電池卡車的研發
- 新興市場的都市化與物流網路擴張
- 促進因素
- 技術趨勢與創新生態系統
- 目前技術
- 電動驅動系統
- ADAS(進階駕駛輔助系統)
- 互聯物聯網平台
- 新興技術
- 自動駕駛卡車
- 氫燃料電池
- 平板技術
- 人工智慧驅動的智慧車隊分析
- 目前技術
- 成長潛力分析
- 價格分析(基於初步調查)
- 對過去價格趨勢的分析
- 按球員類型分類的定價策略(高階/超值/成本加成)
- 監理情勢
- 北美洲
- 美國國家公路交通安全管理局
- 加拿大 - 加拿大運輸部
- 歐洲
- 歐盟委員會
- 英國運輸部
- 亞太地區
- 印度 - 公路運輸與公路部
- 中國 - 工業及資訊化部(工信部)
- 拉丁美洲
- 巴西 - 國家交通管理局 (DENATRAN/SENATRAN)
- 阿根廷 - 國家公路安全局 (ANSV)
- 中東和非洲
- 沙烏地阿拉伯 - 沙烏地阿拉伯標準、計量和品質研究所
- 阿拉伯聯合大公國聯邦土地和海事管理局
- 北美洲
- 波特五力分析
- PESTEL 分析
- 專利分析(基於初步研究)
- 交易數據分析(基於付費資料庫)
- 進出口量和進出口額的趨勢
- 主要貿易走廊及關稅的影響
- 產能和生產概況(基於初步調查)
- 按地區和主要生產商分類的已安裝產能
- 設備運轉率和擴建計劃
- 成本細分分析
- 電動車充電基礎設施發展現狀
- 各區域電動車充電網路部署狀況
- 充電標準與互通性(CCS、CHAdeMO、MCS)
- 基礎建設投資需求與資金籌措模式
- 電網容量和能源管理的挑戰
- 人工智慧和生成式人工智慧對市場的影響
- 利用人工智慧改造現有經營模式
- 針對特定領域的生成式人工智慧應用案例和實施藍圖
- 風險、限制和監管考量
- 預測假設和情境分析(基於初步研究)
- 基本案例-驅動複合年成長率的關鍵宏觀經濟與產業變量
- 樂觀情境-宏觀經濟與產業的順風
- 悲觀情景-宏觀經濟放緩或產業逆風
第4章 競爭情勢
- 介紹
- 企業市佔率分析
- 北美洲
- 歐洲
- 亞太地區
- 拉丁美洲
- 中東和非洲(MEA)
- 主要市場公司的競爭分析
- 競爭定位矩陣
- 主要進展
- 併購
- 夥伴關係和聯盟
- 新產品發布
- 業務拓展計劃及資金籌措
- 企業級分層基準測試
- 層級分類標準與選擇標準
- 按收入、地區和創新能力分類的層級定位矩陣。
第5章 市場估計與預測:依類別分類,2022-2035年
- 三年級
- 四年級
- 五年級
- 六年級
- 七年級
- 八年級
第6章 市場估算與預測:依推進系統/燃料類型分類,2022-2035年
- 內燃機(ICE)
- 柴油引擎
- 汽油
- 天然氣
- 電池式電動車(BEV)
- 混合動力電動車(HEV)
- 燃料電池汽車(FCEV)
第7章 市場估計與預測:依輸電類型分類,2022-2035年
- 手排變速箱
- 自動變速箱
- 自動手排變速箱(AMT)
第8章 市場估算與預測:依自動駕駛等級分類,2022-2035年
- 0級
- 一級
- 二級
- 3級
- 4級
- 5級
第9章 市場估計與預測:依應用領域分類,2022-2035年
- 物流/運輸
- 建築和基礎設施
- 零售與電子商務
- 農業和林業
- 礦業
- 其他
第10章 市場估價與預測:依地區分類,2022-2035年
- 北美洲
- 美國
- 加拿大
- 歐洲
- 德國
- 英國
- 法國
- 義大利
- 西班牙
- 俄羅斯
- 瑞士
- 荷蘭
- 波蘭
- 亞太地區
- 中國
- 印度
- 日本
- 韓國
- 澳洲
- 印尼
- 馬來西亞
- 越南
- 菲律賓
- 拉丁美洲
- 巴西
- 墨西哥
- 阿根廷
- 智利
- 中東和非洲(MEA)
- 南非
- 沙烏地阿拉伯
- 阿拉伯聯合大公國
第11章:公司簡介
- 世界公司
- Daimler Truck
- Volvo Group
- PACCAR
- Isuzu Motors
- Toyota Group
- Dongfeng Motor
- Tata Motors Commercial Vehicles
- Volkswagen
- Ford Motor
- FAW Group
- 當地公司
- Sinotruk
- Hyundai Motors
- Ashok Leyland
- BYD Auto
- Mahindra and Mahindra
- SAIC Motor
- Eicher
- 新興企業
- Hyliion
- Foton Motor
- JAC Motors
The Global Trucks Market was valued at USD 400.9 billion in 2025 and is estimated to grow at a CAGR of 7.3% to reach USD 792.6 billion by 2035.
Market growth is linked to fluctuations in freight demand, which remain highly sensitive to overall economic performance across regions. Expansion of logistics networks and rising emphasis on transportation efficiency are further shaping industry dynamics. Government-led initiatives that strengthen logistics infrastructure are playing an increasingly important role in supporting market development, particularly in rapidly expanding economies. Increased public investment in road networks, regulatory improvements, and supply chain efficiency programs is contributing to higher demand for freight transportation services, which in turn is driving consistent requirements for medium and heavy-duty trucks. Road transport continues to dominate domestic cargo movement, reinforcing the importance of truck-based logistics systems. At the same time, structural changes in the industry are being driven by electrification trends, automation in vehicle systems, construction sector growth, and the rapid expansion of parcel delivery services. These factors collectively are reshaping vehicle design, operational models, and fleet financing structures across the global trucking ecosystem.
| Market Scope | |
|---|---|
| Start Year | 2025 |
| Forecast Year | 2026-2035 |
| Start Value | $400.9 Billion |
| Forecast Value | $792.6 Billion |
| CAGR | 7.3% |
The Class 8 trucks segment accounted for a 67.2% share in 2025, generating revenue of USD 269.4 billion. This segment is undergoing significant transformation as advanced technologies become more widely integrated into vehicle systems. Features such as connected fleet solutions, automation support, and digital monitoring tools are improving operational efficiency, safety, and cost management. Fleet operators are increasingly investing in next-generation vehicles to enhance productivity and optimize logistics performance.
The internal combustion engine segment held a 92.8% share in 2025, valued at USD 371.9 billion. This dominance is supported by its strong performance capabilities, particularly for long-distance and heavy-load applications. The technology benefits from established refueling infrastructure, high torque output, and proven reliability, making it the preferred choice across commercial transportation operations worldwide.
U.S. Trucks Market was valued at USD 82.3 billion in 2025 and is expected to grow at a CAGR of 7.9% between 2026 and 2035. The country's well-developed logistics ecosystem and heavy dependence on road freight transportation across long-distance routes are key growth drivers. Regulatory standards focused on reducing emissions are encouraging gradual technological transitions, while diesel-powered vehicles continue to dominate due to infrastructure readiness and operational efficiency requirements.
Key companies operating in the Global Trucks Market include Volvo, Daimler Truck, PACCAR, Isuzu Motors, Dongfeng Motor, FAW Group, Foton Motor, Sinotruk, Volkswagen, and Shaanxi Auto. Companies in the Global Trucks Market are strengthening their market position through continuous investment in advanced vehicle technologies, including electrification, connectivity, and automation systems. Manufacturers are focusing on improving fuel efficiency, safety features, and overall vehicle performance to meet evolving regulatory and customer requirements. Strategic collaborations with logistics providers and technology firms are helping accelerate innovation and expand service capabilities. Expansion of production facilities and localization strategies are being adopted to enhance supply chain efficiency and reduce operational costs. Companies are also offering flexible financing solutions and customized fleet packages to attract commercial buyers.
Table of Contents
Chapter 1 Methodology
- 1.1 Research approach
- 1.2 Quality Commitments
- 1.2.1 GMI AI policy & data integrity commitment
- 1.3 Research Trail & Confidence Scoring
- 1.3.1 Research Trail Components
- 1.3.2 Scoring Components
- 1.4 Data Collection
- 1.5 Data mining sources
- 1.5.1 Paid sources
- 1.6 Base estimates and calculations
- 1.6.1 Base year calculation for any one approach
- 1.7 Forecast
- 1.7.1 Quantified market impact analysis
- 1.8 Research transparency addendum
- 1.8.1 Source attribution framework
- 1.8.2 Quality assurance metrics
- 1.8.3 Our commitment to trust
Chapter 2 Executive Summary
- 2.1 Industry 360° synopsis
- 2.2 Key market trends
- 2.2.1 Regional
- 2.2.2 Class
- 2.2.3 Propulsion/Fuel
- 2.2.4 Transmission
- 2.2.5 Autonomy Level
- 2.2.6 Application
- 2.3 TAM analysis, 2026-2035
- 2.4 CXO perspectives: Strategic imperatives
Chapter 3 Industry Insights
- 3.1 Industry ecosystem analysis
- 3.1.1 Supplier landscape
- 3.1.2 Profit margin analysis
- 3.1.3 Cost structure
- 3.1.4 Value addition at each stage
- 3.1.5 Factor affecting the value chain
- 3.1.6 Disruptions
- 3.2 Industry Impact forces
- 3.2.1 Growth drivers
- 3.2.1.1 Rising e-commerce & last-mile delivery demand
- 3.2.1.2 Stringent emission regulations driving clean fuel adoption
- 3.2.1.3 Infrastructure development & construction activity growth
- 3.2.1.4 Government incentives for electric & alternative fuel trucks
- 3.2.2 Industry pitfalls & challenges
- 3.2.2.1 High initial cost of electric & autonomous trucks
- 3.2.2.2 Limited charging/refueling infrastructure for alternative fuels
- 3.2.3 Market opportunities
- 3.2.3.1 Autonomous trucking technology advancements
- 3.2.3.2 Hydrogen fuel cell truck development
- 3.2.3.3 Emerging market urbanization & logistics expansions
- 3.2.1 Growth drivers
- 3.3 Technology trends & innovation ecosystem
- 3.3.1 Current technologies
- 3.3.1.1 Electric Powertrains
- 3.3.1.2 Advanced Driver Assistance Systems (ADAS)
- 3.3.1.3 Connected IoT Platforms
- 3.3.2 Emerging technologies
- 3.3.2.1 Autonomous Trucks
- 3.3.2.2 Hydrogen Fuel Cells
- 3.3.2.3 Platooning Technology
- 3.3.2.4 Smart Fleet Analytics with AI
- 3.3.1 Current technologies
- 3.4 Growth potential analysis
- 3.5 Pricing Analysis (Driven by Primary Research)
- 3.5.1 Historical Price Trend Analysis
- 3.5.2 Pricing Strategy by Player Type (Premium / Value / Cost-plus)
- 3.6 Regulatory landscape
- 3.6.1 North America
- 3.6.1.1 US - National Highway Traffic Safety Administration
- 3.6.1.2 Canada - Transport Canada
- 3.6.2 Europe
- 3.6.2.1 EU - European Commission
- 3.6.2.2 UK - Department for Transport (DfT)
- 3.6.3 Asia Pacific
- 3.6.3.1 India - Ministry of Road Transport and Highways
- 3.6.3.2 China - Ministry of Industry and Information Technology (MIIT)
- 3.6.4 Latin America
- 3.6.4.1 Brazil - National Traffic Department (DENATRAN / SENATRAN)
- 3.6.4.2 Argentina - National Road Safety Agency (ANSV)
- 3.6.5 Middle East & Africa
- 3.6.5.1 Saudi Arabia - Saudi Standards Metrology and Quality Organization
- 3.6.5.2 UAE - Federal Authority for Land and Maritime Transport
- 3.6.1 North America
- 3.7 Porter's analysis
- 3.8 PESTEL analysis
- 3.9 Patent analysis (Driven by Primary Research)
- 3.10 Trade Data Analysis (Driven by Paid Database)
- 3.10.1 Import/Export Volume & Value Trends
- 3.10.2 Key Trade Corridors & Tariff Impact
- 3.11 Capacity & Production Landscape (Driven by Primary Research)
- 3.11.1 Installed Capacity by Region & Key Producer
- 3.11.2 Capacity Utilization Rates & Expansion Pipelines
- 3.12 Cost breakdown analysis
- 3.13 EV Charging Infrastructure Readiness
- 3.13.1 EV charging network deployment by region
- 3.13.2 Charging standards & interoperability (CCS, CHAdeMO, MCS)
- 3.13.3 Infrastructure investment requirements & funding models
- 3.13.4 Grid capacity & energy management challenges
- 3.14 Impact of AI & Generative AI on the Market
- 3.14.1 AI-driven disruption of existing business models
- 3.14.2 GenAI use cases & adoption roadmap by segment
- 3.14.3 Risks, limitations & regulatory considerations
- 3.15 Forecast assumptions & scenario analysis (Driven by Primary Research)
- 3.15.1 Base Case - key macro & industry variables driving CAGR
- 3.15.2 Optimistic Scenarios - Favorable macro and industry tailwinds
- 3.15.3 Pessimistic Scenario - Macroeconomic slowdown or industry headwinds
Chapter 4 Competitive Landscape, 2025
- 4.1 Introduction
- 4.2 Company market share analysis
- 4.2.1 North America
- 4.2.2 Europe
- 4.2.3 Asia Pacific
- 4.2.4 LATAM
- 4.2.5 MEA
- 4.3 Competitive analysis of major market players
- 4.4 Competitive positioning matrix
- 4.5 Key developments
- 4.5.1 Mergers & acquisitions
- 4.5.2 Partnerships & collaborations
- 4.5.3 New product launches
- 4.5.4 Expansion plans and funding
- 4.6 Company tier benchmarking
- 4.6.1 Tier classification criteria & qualifying thresholds
- 4.6.2 Tier positioning matrix by revenue, geography & innovation
Chapter 5 Market Estimates & Forecast, By Class, 2022 - 2035 ($Bn, Units)
- 5.1 Key trends
- 5.2 Class 3
- 5.3 Class 4
- 5.4 Class 5
- 5.5 Class 6
- 5.6 Class 7
- 5.7 Class 8
Chapter 6 Market Estimates & Forecast, By Propulsion/Fuel, 2022 - 2035 ($Bn, Units)
- 6.1 Key trends
- 6.2 Internal Combustion Engine (ICE)
- 6.2.1 Diesel
- 6.2.2 Gasoline
- 6.2.3 Natural Gas
- 6.3 Battery Electric Vehicle (BEV)
- 6.4 Hybrid Electric Vehicle (HEV)
- 6.5 Fuel Cell Electric Vehicle (FCEV)
Chapter 7 Market Estimates & Forecast, By Transmission, 2022 - 2035 ($Bn, Units)
- 7.1 Key trends
- 7.2 Manual Transmission
- 7.3 Automatic Transmission
- 7.4 Automated Manual Transmission (AMT)
Chapter 8 Market Estimates & Forecast, By Autonomy Level, 2022 - 2035 ($Bn, Units)
- 8.1 Key trends
- 8.2 Level 0
- 8.3 Level 1
- 8.4 Level 2
- 8.5 Level 3
- 8.6 Level 4
- 8.7 Level 5
Chapter 9 Market Estimates & Forecast, By Application, 2022 - 2035 ($Bn, Units)
- 9.1 Key trends
- 9.2 Logistics & transportation
- 9.3 Construction & infrastructure
- 9.4 Retail & e-commerce
- 9.5 Agriculture & Forestry
- 9.6 Mining
- 9.7 Others
Chapter 10 Market Estimates & Forecast, By Region, 2022 - 2035 ($Bn, Units)
- 10.1 Key trends
- 10.2 North America
- 10.2.1 US
- 10.2.2 Canada
- 10.3 Europe
- 10.3.1 Germany
- 10.3.2 UK
- 10.3.3 France
- 10.3.4 Italy
- 10.3.5 Spain
- 10.3.6 Russia
- 10.3.7 Switzerland
- 10.3.8 Netherlands
- 10.3.9 Poland
- 10.4 Asia Pacific
- 10.4.1 China
- 10.4.2 India
- 10.4.3 Japan
- 10.4.4 South Korea
- 10.4.5 Australia
- 10.4.6 Indonesia
- 10.4.7 Malaysia
- 10.4.8 Vietnam
- 10.4.9 Philippines
- 10.5 Latin America
- 10.5.1 Brazil
- 10.5.2 Mexico
- 10.5.3 Argentina
- 10.5.4 Chile
- 10.6 MEA
- 10.6.1 South Africa
- 10.6.2 Saudi Arabia
- 10.6.3 UAE
Chapter 11 Company Profiles
- 11.1 Global players
- 11.1.1 Daimler Truck
- 11.1.2 Volvo Group
- 11.1.3 PACCAR
- 11.1.4 Isuzu Motors
- 11.1.5 Toyota Group
- 11.1.6 Dongfeng Motor
- 11.1.7 Tata Motors Commercial Vehicles
- 11.1.8 Volkswagen
- 11.1.9 Ford Motor
- 11.1.10 FAW Group
- 11.2 Regional players
- 11.2.1 Sinotruk
- 11.2.2 Hyundai Motors
- 11.2.3 Ashok Leyland
- 11.2.4 BYD Auto
- 11.2.5 Mahindra and Mahindra
- 11.2.6 SAIC Motor
- 11.2.7 Eicher
- 11.3 Emerging players
- 11.3.1 Hyliion
- 11.3.2 Foton Motor
- 11.3.3 JAC Motors

 卡車市場規模、佔有率和趨勢分析報告:按車輛類型、負載容量、燃料類型、應用、地區和細分市場預測(2026-2033 年)
 卡車市場分析及至2035年預測:類型、產品類型、服務、技術、零件、應用、部署狀況、最終用戶、功能
 印度卡車市場:市場佔有率分析、產業趨勢與統計及成長預測(2025-2030 年)二手車市場分析與預測(至2035年):類型、產品類型、服務、技術、零件、應用、流程、最終用戶、形式
 全球汽車電動尾門市場規模、佔有率、趨勢和成長分析報告(2026-2034)
 2026年全球拖車市場報告2026年全球混合動力卡車市場報告輕型卡車市場規模、市場佔有率和成長率、全球行業分析、按類型、應用和地區分類的細分以及未來預測(2026-2034 年)。
 食品油輪市場:依罐體材質、容量範圍及終端用戶產業分類-2026-2032年全球預測美國罐車運輸:市場佔有率分析、行業趨勢和統計數據、成長預測(2026-2031 年)