

 |
市場調查報告書
商品編碼
2038724
電子紙顯示器市場機會、成長要素、產業趨勢分析及2026-2035年預測Electronic Paper Display Market Opportunity, Growth Drivers, Industry Trend Analysis, and Forecast 2026 - 2035 |
||||||

2025年全球電子紙顯示器市場價值為37億美元,預計到2035年將以17%的複合年成長率成長至180億美元。
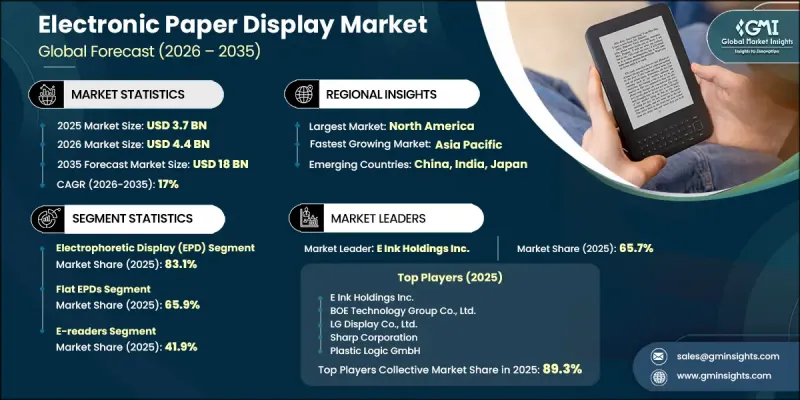
電子紙顯示器產業正經歷強勁成長,這主要得益於市場對節能顯示解決方案日益成長的需求以及連網型設備中電子紙顯示技術的廣泛應用。數位閱讀平台和低功耗顯示技術的日益普及正在加速市場擴張。物聯網生態系統的蓬勃發展,尤其是低功耗和長續航力等關鍵需求,也為市場成長提供了助力。軟性電子紙和彩色電子紙技術的不斷進步,進一步提升了產品功能並拓展了應用領域。此外,人們對永續性和節能減排的日益關注,也推動了各行業對電子紙顯示技術的應用。監管機構對節能電子產品的支持以及材料科學的持續創新,都增強了市場的整體前景。不斷擴展的商業應用以及向更智慧、更互聯的基礎設施的轉變,將繼續支撐全球各地電子紙顯示器產業的長期成長。
| 市場範圍 | |
|---|---|
| 開始年份 | 2025 |
| 預測期 | 2026-2035 |
| 上市時的市場規模 | 37億美元 |
| 預測金額 | 180億美元 |
| 複合年成長率 | 17% |
電子紙顯示器市場的成長也得益於全部區域對永續性和節能的日益關注。法律規範正在推動低功耗電子解決方案的應用,這與電子紙顯示器的運作優勢相契合。電子墨水和軟性顯示器技術的持續創新正在提升產品性能,並使其在各種應用領域中得到更廣泛的應用。持續的技術發展正在增強電子紙解決方案在現代顯示生態系統中的競爭力。
到2025年,電泳顯示器市佔率將達到83.1%。該領域保持領先地位的原因在於其極低的功耗、在各種光照條件下均具有高可視性,以及在各種應用領域中日益普及。在保持能源效率的同時提供媲美紙張的可視性,這一優勢持續推動市場需求。
預計到2025年,平板顯示器市佔率將達到65.9%,這主要得益於其廣泛的商業化、規模經濟帶來的成本優勢以及在多個產業的大規模部署。平板顯示器因其耐用性、清晰度和低功耗而被廣泛採用,適用於各種應用情境。
預計到2025年,北美電子紙顯示器市佔率將達到31.3%。該地區的成長主要得益於數位顯示解決方案的日益普及、智慧基礎設施的大力投資以及對節能技術日益成長的需求。互聯系統和先進零售技術的擴展也持續推動全部區域。
目錄
第1章:調查方法和範圍
第2章執行摘要
第3章業界考察
- 生態系分析
- 供應商情況
- 利潤率
- 成本結構
- 每個階段增加的價值
- 影響價值鏈的因素
- 中斷
- 影響產業的因素
- 促進因素
- 對節能低功耗顯示技術的需求日益成長
- 電子閱讀器和數位閱讀設備的廣泛普及
- 零售業電子貨架標籤(ESL)的普及應用日益廣泛
- 物聯網智慧設備和應用的擴展
- 軟性彩色電子紙顯示器技術的進步
- 產業潛在風險與挑戰
- 高更新率和有限的影片功能
- 與LCD和OLED技術相比,初始成本較高。
- 市場機遇
- 將電子紙顯示器整合到智慧包裝和標籤中
- 電子紙在公共資訊和交通系統中的興起
- 促進因素
- 成長潛力分析
- 監理情勢
- 北美洲
- 歐洲
- 亞太地區
- 拉丁美洲
- 中東和非洲
- 波特五力分析
- PESTEL 分析
- 科技與創新趨勢
- 當前技術趨勢
- 新興技術
- 價格趨勢(基於付費資料庫)
- 歷史價格分析(2022-2025)
- 影響價格趨勢的因素
- 區域價格波動
- 價格預測(2026-2035)
- 貿易數據分析(基於初步調查)
- 進出口量及進口額趨勢
- 主要貿易路線及關稅的影響
- 人工智慧和生成式人工智慧對市場的影響
- 利用人工智慧改造現有經營模式
- 針對特定領域的生成式人工智慧應用案例和實施藍圖
- 風險、限制和監管考量
- 生產能力和生產趨勢(基於初步調查)
- 按地區和主要生產商分類的設備產能
- 運轉率和擴張計劃
第4章 競爭情勢
- 介紹
- 企業市佔率分析
- 按地區
- 北美洲
- 歐洲
- 亞太地區
- 拉丁美洲
- 中東和非洲
- 市場集中度分析
- 按地區
- 主要市場公司的競爭分析
- 競爭定位矩陣
- 主要進展
- 併購
- 夥伴關係和聯盟
- 新產品發布
- 業務拓展計劃及資金籌措
- 企業級分層基準測試
- 層級分類標準與選擇標準
- 按收入、地區和創新能力分類的層級定位矩陣。
第5章 市場估計與預測:依技術分類,2022-2035年
- 電泳顯示(EPD)
- 電潤濕顯示器
- 電致變色顯示器
- 膽固醇液晶顯示器
- 電流體顯示器
- 其他
第6章 市場估價與預測:依顯示器類型分類,2022-2035年
- 平面型EPD
- 彎曲EPD
- 軟性EPD
- 捲軸式顯示器
- 軟性顯示螢幕
- 折疊式EPD
- 單折整體
- 折疊式折疊式展示架
第7章 市場估計與預測:依應用領域分類,2022-2035年
- 電子書閱讀器
- 電子貨架標籤(ESL)
- 數位電子看板
- 智慧標籤卡
- 穿戴式裝置
- 輔助/備用電腦顯示器
- 其他
第8章 市場估算與預測:依最終用途產業分類,2022-2035年
- 家用電子電器
- 個人閱讀設備
- 家庭自動化和智慧家庭顯示器
- 消費級穿戴裝置
- 其他
- 零售
- 用於店內銷售的電子貨架標籤
- POS顯示器
- 零售廣告和促銷
- 其他
- 衛生保健
- 診斷設備顯示器
- 病患監測設備
- 醫院資訊系統
- 其他
- 運輸
- 政府/國防
- 產業
- 媒體與娛樂
- 其他
第9章 市場估計與預測:依地區分類,2022-2035年
- 北美洲
- 美國
- 加拿大
- 歐洲
- 德國
- 英國
- 法國
- 西班牙
- 義大利
- 荷蘭
- 亞太地區
- 中國
- 印度
- 日本
- 澳洲
- 韓國
- 拉丁美洲
- 巴西
- 墨西哥
- 阿根廷
- 中東和非洲
- 南非
- 沙烏地阿拉伯
- 阿拉伯聯合大公國
第10章:公司簡介
- 世界公司
- E Ink Holdings Inc.
- BOE Technology Group Co., Ltd.
- LG Display Co., Ltd.
- Sharp Corporation
- AUO Display Plus
- Visionect
- CLEARink Displays Inc.
- 當地公司
- Plastic Logic GmbH
- Pervasive Displays Inc.
- OED Technologies Co., Ltd.
- Tianma Microelectronics Co., Ltd.
- SOLUM(Samsung Spin-off)
- Hanshow Technology
- NEWFACE Optoelectronics Co., Ltd.
- Local Players
- DKE Co., Ltd.
The Global Electronic Paper Display Market was valued at USD 3.7 billion in 2025 and is estimated to grow at a CAGR of 17% to reach USD 18 billion by 2035.
The electronic paper display industry is experiencing strong growth momentum, driven by rising demand for energy-efficient display solutions and increasing deployment across connected devices. Growing adoption of digital reading platforms and low-power display technologies is accelerating market expansion. The market is also benefiting from the proliferation of IoT-enabled ecosystems, where low energy consumption and extended battery life are critical requirements. Continuous advancements in flexible and color e-paper technologies are further enhancing product capabilities and broadening application areas. Additionally, increasing focus on sustainability and reduced energy consumption is encouraging the adoption of these displays across industries. Regulatory support for energy-efficient electronics and ongoing innovation in material science are strengthening the overall market outlook. Expanding commercial applications and the push toward smarter, connected infrastructure continue to support long-term growth across global regions.
| Market Scope | |
|---|---|
| Start Year | 2025 |
| Forecast Year | 2026-2035 |
| Start Value | $3.7 Billion |
| Forecast Value | $18 Billion |
| CAGR | 17% |
The growth of the electronic paper display market is further supported by rising emphasis on sustainability and energy conservation across major regions. Regulatory frameworks are encouraging the use of low-power electronic solutions, which aligns with the operational advantages of electronic paper displays. Ongoing innovation in electronic ink and flexible display technologies is enhancing product performance and enabling wider adoption across various applications. Continuous technological development is strengthening the competitiveness of electronic paper solutions in modern display ecosystems.
The electrophoretic display segment reached 83.1% share in 2025. This segment maintains leadership due to its minimal power consumption, high visibility in different lighting conditions, and strong adoption across multiple applications. Its ability to deliver a paper-like viewing experience while maintaining energy efficiency continues to drive demand.
The flat panel segment held a 65.9% share in 2025, supported by widespread commercialization, cost advantages at scale, and extensive deployment across multiple industries. These displays are widely adopted due to their durability, clarity, and low energy requirements, making them suitable for a range of applications.
North America Electronic Paper Display Market accounted for 31.3% share in 2025. Growth in the region is driven by increasing adoption of digital display solutions, strong investment in smart infrastructure, and rising demand for energy-efficient technologies. The expansion of connected systems and advanced retail technologies continues to support market growth across the region.
Key players operating in the Global Electronic Paper Display Industry include E Ink Holdings Inc., BOE Technology Group Co., Ltd., LG Display Co., Ltd., Sharp Corporation, Plastic Logic GmbH, Pervasive Displays Inc., OED Technologies Co., Ltd., DKE Co., Ltd., Tianma Microelectronics Co., Ltd., Visionect, CLEARink Displays Inc., AUO Display Plus, SOLUM, Hanshow Technology, and NEWFACE Optoelectronics Co., Ltd. Companies in the electronic paper display market are focusing on innovation, partnerships, and expansion strategies to strengthen their competitive position. Significant investments in research and development are driving advancements in flexible, color, and high-performance display technologies. Strategic collaborations with technology providers and device manufacturers are enabling broader product integration and market reach. Firms are also expanding their manufacturing capabilities to meet growing demand while optimizing production costs. Geographic expansion into emerging markets and diversification of application areas are further supporting growth.
Table of Contents
Chapter 1 Methodology and Scope
- 1.1 Market scope and definition
- 1.2 Research design
- 1.2.1 Research approach
- 1.2.2 Data collection methods
- 1.3 Data mining sources
- 1.3.1 Global
- 1.3.2 Regional/Country
- 1.4 Base estimates and calculations
- 1.4.1 Base year calculation
- 1.4.2 Key trends for market estimation
- 1.5 Primary research and validation
- 1.5.1 Primary sources
- 1.6 Forecast model
- 1.7 Research assumptions and limitations
Chapter 2 Executive Summary
- 2.1 Industry 360° synopsis, 2022 - 2035
- 2.2 Key market trends
- 2.2.1 Technology trends
- 2.2.2 Display Type trends
- 2.2.3 Application trends
- 2.2.4 End-user Industry trends
- 2.2.5 Regional trends
- 2.3 TAM Analysis, 2026-2035
- 2.4 CXO perspectives: Strategic imperatives
Chapter 3 Industry Insights
- 3.1 Industry ecosystem analysis
- 3.1.1 Supplier Landscape
- 3.1.2 Profit Margin
- 3.1.3 Cost structure
- 3.1.4 Value addition at each stage
- 3.1.5 Factor affecting the value chain
- 3.1.6 Disruptions
- 3.2 Industry impact forces
- 3.2.1 Growth drivers
- 3.2.1.1 Increasing demand for energy-efficient and low-power display technologies
- 3.2.1.2 Rising adoption of e-readers and digital reading devices
- 3.2.1.3 Growing deployment of electronic shelf labels (ESLs) in retail
- 3.2.1.4 Expansion of IoT-enabled smart devices and applications
- 3.2.1.5 Advancements in flexible and color electronic paper display technologies
- 3.2.2 Industry pitfalls and challenges
- 3.2.2.1 High refresh latency and limited video capability
- 3.2.2.2 Higher initial costs compared to LCD and OLED technologies
- 3.2.3 Market opportunities
- 3.2.3.1 Integration of e-paper displays in smart packaging and labeling
- 3.2.3.2 Emergence of e-paper in public information and transportation systems
- 3.2.1 Growth drivers
- 3.3 Growth potential analysis
- 3.4 Regulatory landscape
- 3.4.1 North America
- 3.4.2 Europe
- 3.4.3 Asia Pacific
- 3.4.4 Latin America
- 3.4.5 Middle East & Africa
- 3.5 Porter's analysis
- 3.6 PESTEL analysis
- 3.7 Technology and Innovation landscape
- 3.7.1 Current technological trends
- 3.7.2 Emerging technologies
- 3.8 Price trends (Based on paid Database)
- 3.8.1 Historical Price Analysis (2022-2025)
- 3.8.2 Price Trend Drivers
- 3.8.3 Regional Price Variations
- 3.8.4 Price Forecast (2026-2035)
- 3.9 Trade Data Analysis (Driven by Primary Research)
- 3.9.1 Import/Export Volume & Value Trends
- 3.9.2 Key Trade Corridors & Tariff Impact
- 3.10 Impact of AI & Generative AI on the Market
- 3.10.1 AI-Driven Disruption of Existing Business Models
- 3.10.2 GenAI Use Cases & Adoption Roadmap by Segment
- 3.10.3 Risks, Limitations & Regulatory Considerations
- 3.11 Capacity & Production Landscape (Driven by Primary Research)
- 3.11.1 Installed Capacity by Region & Key Producer
- 3.11.2 Capacity Utilization Rates & Expansion Pipelines
Chapter 4 Competitive Landscape, 2025
- 4.1 Introduction
- 4.2 Company market share analysis
- 4.2.1 By region
- 4.2.1.1 North America
- 4.2.1.2 Europe
- 4.2.1.3 Asia Pacific
- 4.2.1.4 Latin America
- 4.2.1.5 Middle East & Africa
- 4.2.2 Market concentration analysis
- 4.2.1 By region
- 4.3 Competitive analysis of major market players
- 4.4 Competitive positioning matrix
- 4.5 Key developments
- 4.5.1 Mergers & acquisitions
- 4.5.2 Partnerships & collaborations
- 4.5.3 New product launches
- 4.5.4 Expansion plans and funding
- 4.6 Company tier benchmarking
- 4.6.1 Tier classification criteria & qualifying thresholds
- 4.6.2 Tier positioning matrix by revenue, geography & innovation
Chapter 5 Market Estimates and Forecast, By Technology, 2022 - 2035 (USD Million & Units)
- 5.1 Key trends
- 5.2 Electrophoretic Display (EPD)
- 5.3 Electrowetting display
- 5.4 Electrochromic display
- 5.5 Cholesteric LCD
- 5.6 Electro-fluidic display
- 5.7 Others
Chapter 6 Market Estimates and Forecast, By Display Type, 2022 - 2035 (USD Million & Units)
- 6.1 Key trends
- 6.2 Flat EPDs
- 6.3 Curved EPDs
- 6.4 Flexible EPDs
- 6.4.1 Rollable displays
- 6.4.2 Bendable displays
- 6.5 Foldable EPDs
- 6.5.1 Single-fold displays
- 6.5.2 Multi-fold displays
Chapter 7 Market Estimates and Forecast, By Application, 2022 - 2035 (USD Million & Units)
- 7.1 Key trends
- 7.2 E-Readers
- 7.3 Electronic Shelf Labels (ESL)
- 7.4 Digital signage
- 7.5 Smart labels & cards
- 7.6 Wearable devices
- 7.7 Auxiliary/secondary PC displays
- 7.8 Others
Chapter 8 Market Estimates and Forecast, By End-use Industry, 2022 - 2035 (USD Million & Units)
- 8.1 Key trends
- 8.2 Consumer electronics
- 8.2.1 Personal reading devices
- 8.2.2 Home automation & smart home displays
- 8.2.3 Consumer wearables
- 8.2.4 Others
- 8.3 Retail
- 8.3.1 In-store electronic shelf labels
- 8.3.2 Point-of-sale displays
- 8.3.3 Retail advertising & promotion
- 8.3.4 Others
- 8.4 Healthcare
- 8.4.1 Diagnostic equipment displays
- 8.4.2 Patient monitoring devices
- 8.4.3 Hospital information systems
- 8.4.4 Others
- 8.5 Transportation
- 8.6 Government & defense
- 8.7 Industrial
- 8.8 Media & entertainment
- 8.9 Others
Chapter 9 Market Estimates and Forecast, By Region, 2022 - 2035 (USD Million & Units)
- 9.1 Key trends
- 9.2 North America
- 9.2.1 U.S.
- 9.2.2 Canada
- 9.3 Europe
- 9.3.1 Germany
- 9.3.2 UK
- 9.3.3 France
- 9.3.4 Spain
- 9.3.5 Italy
- 9.3.6 Netherlands
- 9.4 Asia Pacific
- 9.4.1 China
- 9.4.2 India
- 9.4.3 Japan
- 9.4.4 Australia
- 9.4.5 South Korea
- 9.5 Latin America
- 9.5.1 Brazil
- 9.5.2 Mexico
- 9.5.3 Argentina
- 9.6 Middle East and Africa
- 9.6.1 South Africa
- 9.6.2 Saudi Arabia
- 9.6.3 UAE
Chapter 10 Company Profiles
- 10.1 Global Players
- 10.1.1 E Ink Holdings Inc.
- 10.1.2 BOE Technology Group Co., Ltd.
- 10.1.3 LG Display Co., Ltd.
- 10.1.4 Sharp Corporation
- 10.1.5 AUO Display Plus
- 10.1.6 Visionect
- 10.1.7 CLEARink Displays Inc.
- 10.2 Regional Players
- 10.2.1 Plastic Logic GmbH
- 10.2.2 Pervasive Displays Inc.
- 10.2.3 OED Technologies Co., Ltd.
- 10.2.4 Tianma Microelectronics Co., Ltd.
- 10.2.5 SOLUM (Samsung Spin-off)
- 10.2.6 Hanshow Technology
- 10.2.7 NEWFACE Optoelectronics Co., Ltd.
- 10.3 Local Players
- 10.3.1 DKE Co., Ltd.


