


 |
市場調查報告書
商品編碼
2038718
化學氣相沉積法合成鑽石市場機會、成長要素、產業趨勢分析及2026-2035年預測CVD Lab-grown Diamonds Market Opportunity, Growth Drivers, Industry Trend Analysis, and Forecast 2026 - 2035 |
||||||
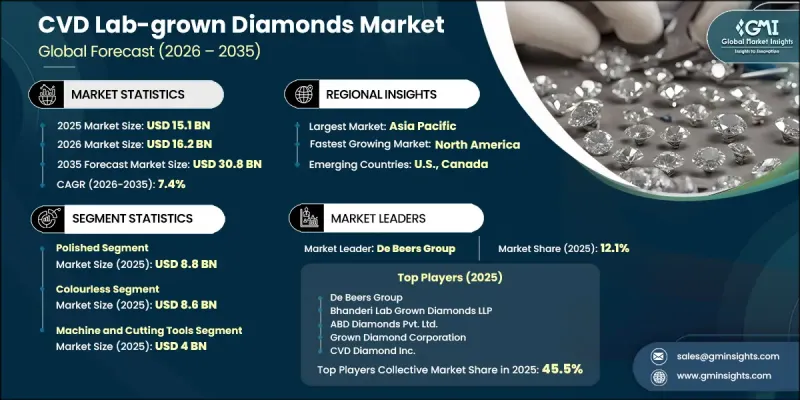
全球 CVD(化學氣相沉積)人造鑽石市場預計到 2025 年將價值 151 億美元,預計到 2035 年將以 7.4% 的複合年成長率成長至 308 億美元。
市場擴張的驅動力在於先進材料技術的日益普及以及合成鑽石在眾多工業領域中日益廣泛的接受度。化學氣相沉積 (CVD) 技術透過將富碳氣體轉化為層狀結構來控制鑽石晶體的形成,從而生產出化學成分、晶體結構和物理性質與天然鑽石相當的材料。這些特性使其能夠應用於從裝飾到功能性等眾多領域。市場生態系統涵蓋了參與生產、加工和下游整合的公司,滿足了各個需要高性能材料的行業的需求。尺寸、純度和結構特性等規格的客製化能力增強了這些鑽石的商業性吸引力。反應器設計、等離子體控制和生長製程最佳化的持續改進提高了生產效率和均勻性。這些進步減少了缺陷並改善了光學性能,使製造商能夠滿足嚴格的品質要求,從而促進了市場的長期成長和在各行業的更廣泛應用。
| 市場範圍 | |
|---|---|
| 開始年份 | 2025 |
| 預測期 | 2026-2035 |
| 上市時的市場規模 | 151億美元 |
| 預計金額 | 308億美元 |
| 複合年成長率 | 7.4% |
預計到2025年,拋光CVD人造鑽石市場規模將達到88億美元,反映出市場需求強勁,而強勁的需求主要來自於加工品質和分級一致性的提升。切割和拋光技術的進步提高了鑽石的淨度、亮度和均勻性,使其更符合不斷變化的設計需求。同時,毛坯鑽石的生產也日益注重應用導向,製造商專注於控制尺寸、厚度和晶體取向。毛坯鑽石的需求仍取決於下游加工能力和產業需求,從而在原料生產和高附加價值表面處理工程之間形成了一個平衡的生態系統。
預計到2025年,機械和切削工具市場規模將達到40億美元。這些材料因其卓越的硬度、導熱性和結構穩定性,被廣泛用於精密加工、高效散熱以及在嚴苛條件下保持可靠的性能。其多功能性使其可應用於包括高性能設備、光學系統和特殊部件在內的眾多領域。除了工業需求外,寶石市場也持續貢獻著重要的市場佔有率,確保了珠寶飾品製造的穩定供應。這些鑽石兼具功能性和美觀性,其適應性不斷為先進研究和專業工程應用開闢新的機會。
北美CVD合成鑽石市場預計將從2025年的39億美元成長到2035年的75億美元,反映出該地區工業製造和先進技術領域對CVD合成鑽石的日益成長的需求。這一成長得益於成熟的加工能力、持續的創新以及對高品質材料開發的重視。市場需求主要來自電子產品、切割工具和實驗室培育珠寶等領域的應用,同時,對國內供應鏈和產業合作的重視程度也不斷提高。該地區擁有技術專長和成熟的生態系統,支持創新、客製化和穩定的材料性能,這些都有助於市場的持續擴張。
目錄
第1章:調查方法和範圍
第2章執行摘要
第3章業界考察
- 生態系分析
- 供應商情況
- 利潤率
- 每個階段增加的價值
- 影響價值鏈的因素
- 中斷
- 影響產業的因素
- 促進因素
- 實驗室培育鑽石珠寶的需求不斷成長
- 合成鑽石工業應用領域的拓展
- 提高鑽石品管
- 陷阱與挑戰
- 前期資本投資要求較高。
- 缺陷管理的技術複雜性
- 機會
- 電子產業應用範圍不斷擴大
- 根據特定最終用途客製化產品
- 促進因素
- 成長潛力分析
- 監理情勢
- 波特五力分析
- PESTEL 分析
- 科技與創新趨勢
- 當前技術趨勢
- 新興技術
- 價格趨勢
- 按地區
- 按類型
- 未來市場趨勢
- 科技與創新趨勢
- 當前技術趨勢
- 新興技術
- 專利趨勢
- 貿易統計(HS編碼)
- 主要進口國
- 主要出口國
- 永續性和環境方面
- 永續計劃
- 減少廢棄物策略
- 生產中的能源效率
- 具有環保意識的舉措
- 考慮碳足跡
第4章 競爭情勢
- 介紹
- 企業市佔率分析
- 按地區
- 北美洲
- 歐洲
- 亞太地區
- 拉丁美洲
- 中東和非洲(MEA)
- 按地區
- 企業矩陣分析
- 主要市場公司的競爭分析
- 競爭定位矩陣
- 主要進展
- 併購
- 夥伴關係和聯盟
- 新產品發布
- 業務拓展計劃
第5章 市場估計與預測:依類型分類,2022-2035年
- 拋光
- 粗糙的石頭
第6章 市場估算與預測:彩色編碼,2022-2035年
- 無色
- 染色
第7章 市場估計與預測:依應用領域分類,2022-2035年
- 機器/切削工具
- 電子設備
- 光學、雷射、X光
- 散熱器和熱交換器
- 醫療設備
- 珠寶
- 其他
第8章 市場估計與預測:依地區分類,2022-2035年
- 北美洲
- 美國
- 加拿大
- 歐洲
- 德國
- 英國
- 法國
- 西班牙
- 義大利
- 其他歐洲國家
- 亞太地區
- 中國
- 印度
- 日本
- 澳洲
- 韓國
- 其他亞太地區
- 拉丁美洲
- 巴西
- 墨西哥
- 阿根廷
- 其他拉丁美洲
- 中東和非洲
- 沙烏地阿拉伯
- 南非
- 阿拉伯聯合大公國
- 其他中東和非洲地區
第9章:公司簡介
- De Beers Group
- Bhanderi Lab Grown Diamonds LLP
- Tomei Diamond Corporation
- SP3 Diamond Technologies
- Hebei Plasma Diamond Technology Co., Ltd.
- EDP Corporation
- ABD Diamonds Pvt. Ltd.
- CVD Diamond Inc.
- Vibranium Lab
- Shanghai Zhengshi Technology Co., Ltd.
- Ritani
- Nova Diamant
- Grown Diamond Corporation
The Global CVD Lab-Grown Diamonds Market was valued at USD 15.1 billion in 2025 and is estimated to grow at a CAGR of 7.4% to reach USD 30.8 billion by 2035.
Market expansion is supported by the increasing adoption of advanced material technologies and the growing acceptance of engineered diamonds across multiple industries. Chemical Vapor Deposition technology enables the controlled formation of diamond crystals by converting carbon-rich gases into layered structures, resulting in materials that match the chemical composition, crystal structure, and physical properties of natural diamonds. These characteristics allow widespread utilization across both decorative and functional applications. The market ecosystem includes participants engaged in production, processing, and downstream integration, catering to diverse sectors that require high-performance materials. The ability to tailor specifications such as size, purity, and structural properties enhances the commercial appeal of these diamonds. Continuous improvements in reactor design, plasma control, and growth optimization are strengthening production efficiency and consistency. These advancements are reducing defects, improving optical performance, and enabling manufacturers to meet stringent quality requirements, thereby supporting long-term market growth and broader industrial adoption.
| Market Scope | |
|---|---|
| Start Year | 2025 |
| Forecast Year | 2026-2035 |
| Start Value | $15.1 Billion |
| Forecast Value | $30.8 Billion |
| CAGR | 7.4% |
The polished CVD lab-grown diamonds segment accounted for USD 8.8 billion in 2025, reflecting strong demand driven by improvements in finishing quality and grading consistency. Advances in cutting and polishing technologies have enhanced clarity, brilliance, and uniformity, aligning these products more closely with evolving design expectations. At the same time, the production of rough diamonds is becoming increasingly application-specific, with manufacturers focusing on controlling dimensions, thickness, and crystal orientation. Demand for rough variants continues to depend on downstream processing capabilities and industrial requirements, creating a balanced ecosystem between raw material production and value-added finishing processes.
The machine and cutting tools segment generated USD 4 billion in 2025. These materials are widely utilized due to their exceptional hardness, thermal conductivity, and structural stability, which enable precision machining, efficient heat dissipation, and reliable performance under demanding conditions. Their versatility supports usage across high-performance equipment, optical systems, and specialized components. In addition to industrial demand, the gemstone segment remains a significant contributor, ensuring a steady supply for jewelry manufacturing. The adaptability of these diamonds to meet both functional and aesthetic requirements continues to open new opportunities in advanced research and specialized engineering applications.
North America CVD Lab-Grown Diamonds Market is expected to grow from USD 3.9 billion in 2025 to USD 7.5 billion by 2035, reflecting strong regional adoption across industrial manufacturing and advanced technology sectors. Growth is supported by well-established processing capabilities, continuous innovation, and a focus on high-quality material development. Demand is primarily driven by applications in electronics, cutting tools, and lab-grown jewelry, with increasing emphasis on domestic supply chains and collaborative industry efforts. The region benefits from technological expertise and a mature ecosystem that supports innovation, customization, and consistent material performance, contributing to sustained market expansion.
Key companies operating in the Global CVD Lab-Grown Diamonds Market include De Beers Group, Bhanderi Lab Grown Diamonds LLP, Tomei Diamond Corporation, SP3 Diamond Technologies, Hebei Plasma Diamond Technology Co., Ltd., EDP Corporation, ABD Diamonds Pvt. Ltd., CVD Diamond Inc., Vibranium Lab, Shanghai Zhengshi Technology Co., Ltd., Ritani, Nova Diamant, and Grown Diamond Corporation. Companies in the CVD Lab-Grown Diamonds Market are strengthening their position through continuous investment in advanced manufacturing technologies and process optimization to enhance product quality and scalability. Strategic focus on customization capabilities allows manufacturers to cater to both industrial and jewelry applications with precision. Firms are expanding their global footprint through partnerships, distribution networks, and vertical integration across the value chain. Innovation in reactor systems and material engineering is enabling higher efficiency and reduced production costs. Additionally, companies are emphasizing sustainability and traceability to align with evolving consumer preferences.
Table of Contents
Chapter 1 Methodology & Scope
- 1.1 Market scope and definition
- 1.2 Research design
- 1.2.1 Research approach
- 1.2.2 Data collection methods
- 1.3 Data mining sources
- 1.3.1 Global
- 1.3.2 Regional/Country
- 1.4 Base estimates and calculations
- 1.4.1 Base year calculation
- 1.4.2 Key trends for market estimation
- 1.5 Primary research and validation
- 1.5.1 Primary sources
- 1.6 Forecast model
- 1.7 Research assumptions and limitations
Chapter 2 Executive Summary
- 2.1 Industry 360° synopsis
- 2.2 Key market trends
- 2.2.1 Type
- 2.2.2 Color
- 2.2.3 Application
- 2.2.4 Regional
- 2.3 TAM Analysis, 2026-2035
- 2.4 CXO perspectives: Strategic imperatives
- 2.5 Future outlook and strategic recommendations
Chapter 3 Industry Insights
- 3.1 Industry ecosystem analysis
- 3.1.1 Supplier landscape
- 3.1.2 Profit margin
- 3.1.3 Value addition at each stage
- 3.1.4 Factor affecting the value chain
- 3.1.5 Disruptions
- 3.2 Industry impact forces
- 3.2.1 Growth drivers
- 3.2.1.1 Increasing demand for lab-grown diamond jewelry
- 3.2.1.2 Expanding industrial use of synthetic diamonds
- 3.2.1.3 Improved control over diamond quality
- 3.2.2 Pitfalls/challenge
- 3.2.2.1 High initial equipment investment requirements
- 3.2.2.2 Technical complexity in defect control
- 3.2.3 Opportunities
- 3.2.3.1 Rising adoption in electronic applications
- 3.2.3.2 Product customization for specific end uses
- 3.2.1 Growth drivers
- 3.3 Growth potential analysis
- 3.4 Regulatory landscape
- 3.4.1 North America
- 3.4.2 Europe
- 3.4.3 Asia Pacific
- 3.4.4 Latin America
- 3.4.5 Middle East & Africa
- 3.5 Porter's analysis
- 3.6 PESTEL analysis
- 3.7 Technology and innovation landscape
- 3.7.1 Current technological trends
- 3.7.2 Emerging technologies
- 3.8 Price trends
- 3.8.1 By region
- 3.8.2 By type
- 3.9 Future market trends
- 3.10 Technology and innovation landscape
- 3.10.1 Current technological trends
- 3.10.2 Emerging technologies
- 3.11 Patent landscape
- 3.12 Trade statistics (HS code)
- 3.12.1 Major importing countries
- 3.12.2 Major exporting countries
- 3.13 Sustainability and environmental aspects
- 3.13.1 Sustainable practices
- 3.13.2 Waste reduction strategies
- 3.13.3 Energy efficiency in production
- 3.13.4 Eco-friendly initiatives
- 3.14 Carbon footprint consideration
Chapter 4 Competitive Landscape, 2025
- 4.1 Introduction
- 4.2 Company market share analysis
- 4.2.1 By region
- 4.2.1.1 North America
- 4.2.1.2 Europe
- 4.2.1.3 Asia Pacific
- 4.2.1.4 LATAM
- 4.2.1.5 MEA
- 4.2.1 By region
- 4.3 Company matrix analysis
- 4.4 Competitive analysis of major market players
- 4.5 Competitive positioning matrix
- 4.6 Key developments
- 4.6.1 Mergers & acquisitions
- 4.6.2 Partnerships & collaborations
- 4.6.3 New product launches
- 4.6.4 Expansion plans
Chapter 5 Market Estimates and Forecast, By Type, 2022-2035 (USD Billion) (Kilo Tons)
- 5.1 Key trends
- 5.2 Polished
- 5.3 Rough
Chapter 6 Market Estimates and Forecast, By Color, 2022-2035 (USD Billion) (Kilo Tons)
- 6.1 Key trends
- 6.2 Colorless
- 6.3 Colored
Chapter 7 Market Estimates and Forecast, By Application, 2022-2035 (USD Billion) (Kilo Tons)
- 7.1 Key trends
- 7.2 Machine and cutting tools
- 7.3 Electronics
- 7.4 Optical, laser and X-ray
- 7.5 Heat sinks & exchangers
- 7.6 Healthcare instruments
- 7.7 Gemstone
- 7.8 Others
Chapter 8 Market Estimates and Forecast, By Region, 2022-2035 (USD Billion) (Kilo Tons)
- 8.1 Key trends
- 8.2 North America
- 8.2.1 U.S.
- 8.2.2 Canada
- 8.3 Europe
- 8.3.1 Germany
- 8.3.2 UK
- 8.3.3 France
- 8.3.4 Spain
- 8.3.5 Italy
- 8.3.6 Rest of Europe
- 8.4 Asia Pacific
- 8.4.1 China
- 8.4.2 India
- 8.4.3 Japan
- 8.4.4 Australia
- 8.4.5 South Korea
- 8.4.6 Rest of Asia Pacific
- 8.5 Latin America
- 8.5.1 Brazil
- 8.5.2 Mexico
- 8.5.3 Argentina
- 8.5.4 Rest of Latin America
- 8.6 Middle East and Africa
- 8.6.1 Saudi Arabia
- 8.6.2 South Africa
- 8.6.3 UAE
- 8.6.4 Rest of Middle East and Africa
Chapter 9 Company Profiles
- 9.1 De Beers Group
- 9.2 Bhanderi Lab Grown Diamonds LLP
- 9.3 Tomei Diamond Corporation
- 9.4 SP3 Diamond Technologies
- 9.5 Hebei Plasma Diamond Technology Co., Ltd.
- 9.6 EDP Corporation
- 9.7 ABD Diamonds Pvt. Ltd.
- 9.8 CVD Diamond Inc.
- 9.9 Vibranium Lab
- 9.10 Shanghai Zhengshi Technology Co., Ltd.
- 9.11 Ritani
- 9.12 Nova Diamant
- 9.13 Grown Diamond Corporation
 化學氣相沉積合成鑽石市場:全球市場預測,2026-2032年
 合成鑽石市場規模、佔有率、趨勢和預測:按類型、製造流程、應用和地區分類,2026-2034年
 合成鑽石市場規模、佔有率、成長及全球產業分析:按類型和應用分類,區域洞察及2026-2034年預測
 合成鑽石市場:按類型、製造程序和地區分類
 2026年全球實驗室培育鑽石市場報告
 合成鑽石市場規模、佔有率和趨勢分析報告:按顏色、應用、地區和細分市場預測(2026-2033 年)
 合成鑽石:市場佔有率分析、產業趨勢與統計、成長預測(2026-2031)2026年全球化學氣相沉積法(CVD)實驗室培育鑽石市場報告2026年全球合成鑽石市場報告CVD鑽石市場(按形狀、克拉重量範圍、分銷管道和應用分類)—全球預測,2026-2032年