

 |
市場調查報告書
商品編碼
2038666
傳統旋轉器市場機會、成長要素、產業趨勢分析及2026-2035年預測Conventional Rotators Market Opportunity, Growth Drivers, Industry Trend Analysis, and Forecast 2026 - 2035 |
||||||
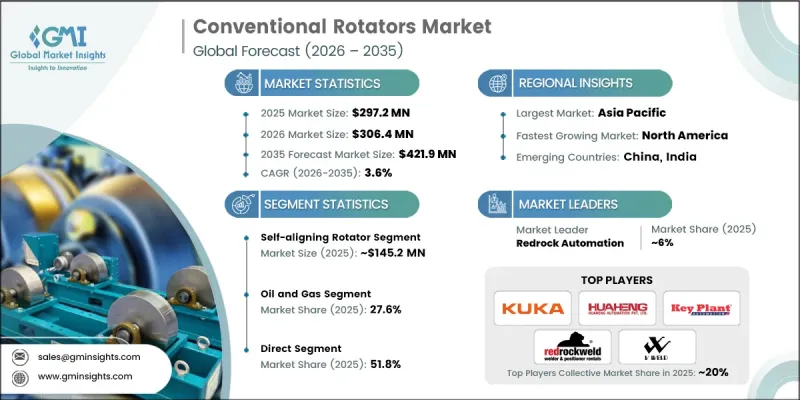
預計到 2025 年,全球傳統旋轉器市場價值將達到 2.972 億美元,並預計以 3.6% 的複合年成長率成長,到 2035 年達到 4.219 億美元。
這一成長主要得益於受控旋轉系統的日益普及,這些系統能夠提高圓柱形焊接作業的精度,並減少製造過程中的結構變形。各行業越來越重視焊接品質的一致性、減少重工和提高生產效率,這推動了傳統旋轉器的應用。這些系統能夠穩定定位重型零件,從而確保更高的尺寸精度和操作效率。隨著製造商致力於最大限度地減少人工干預並最佳化工作流程的連續性,製造工廠對自動化日益成長的興趣進一步加速了市場需求。與機械手臂和自動化生產線等先進焊接系統的整合也提高了營運的擴充性。此外,持續的工業現代化以及重工業項目對更短前置作業時間的需求,正在推動全球製造環境中此類系統的市場應用。
| 市場範圍 | |
|---|---|
| 開始年份 | 2025 |
| 預測期 | 2026-2035 |
| 上市時的市場規模 | 2.972億美元 |
| 預測金額 | 4.219億美元 |
| 複合年成長率 | 3.6% |
該市場也受到重工業領域日益重視簡化製造流程和提高生產效率的影響。製造商正在增加對能夠實現連續作業、縮短工時並提高職場安全性的設備的投資。傳統的旋轉設備已成為同步焊接作業和支援大規模生產的關鍵設備。
預計到2025年,自動定位旋轉器市場規模將達到1.452億美元,並在2026年至2035年間以4%的複合年成長率成長。該細分市場之所以如此重要,是因為它能夠根據圓柱形零件的曲率和直徑自動調整滾輪的位置。這種功能無需人工調整,提升了工作精準度。這些系統在處理重工業製造中常見的形狀不規則、表面不平整或厚度不一的零件時特別有效,從而提高了工作流程效率和焊接精度。
預計到2025年,自動定位旋轉器市場規模將達到1.452億美元,並在2026年至2035年間以4%的複合年成長率成長。這些系統旨在根據工件形狀自動調整滾輪角度,無需手動校準。它們能夠處理略有變形和尺寸偏差的圓柱形零件,因此在對焊接精度和穩定性要求極高的重型工業製造過程中,這些系統具有極高的價值。
美國傳統旋轉焊機市場預計到2025年將達到7,430萬美元,並在2026年至2035年間以3.5%的複合年成長率成長。該國市場成長的主要驅動力是產業部門對高精度焊接解決方案的強勁需求。基礎設施項目的擴張、能源系統的持續維護以及不斷成長的工業製造需求都在推動設備的普及應用。製造業向數位化和自動化轉型也推動了對具備智慧監控和高效運作功能的先進旋轉焊接機的需求。完善的製造設施和嚴格的品質標準進一步增加了全部區域對高性能旋轉焊接設備的需求。
目錄
第1章:調查方法和範圍
第2章執行摘要
第3章業界考察
- 生態系分析
- 原物料供應商
- 零件製造商
- 旋轉器原廠
- 銷售代理商和經銷商
- 最終用戶
- 售後服務服務供應商
- 每個階段增加的價值
- 影響價值鏈的因素
- 影響產業的因素
- 促進因素
- 重工業對精度和效率日益成長的需求
- 可再生能源項目擴張
- 新興國家的基礎建設
- 陷阱與挑戰
- 初始投資成本高
- 需要頻繁維護和熟練的操作人員
- 機會
- 現有設施維修升級的市場
- 亞太地區和拉丁美洲的新興市場
- 促進因素
- 成長潛力分析
- 未來市場趨勢
- 科技與創新趨勢
- 當前技術趨勢
- 新興技術
- 價格趨勢
- 按地區
- 依產品
- 對過去價格趨勢的分析
- 按玩家類型分類的定價策略
- 監理情勢
- 焊接設備的 OSHA 安全標準
- ASME標準和準則
- CE標誌要求(歐洲)
- API石油和天然氣應用標準
- 環境法規
- 貿易資料分析(基於一手調查)-(HS編碼 - 84682090)
- 進出口量及進口額趨勢
- 主要貿易走廊及關稅的影響
- 人工智慧和生成式人工智慧對市場的影響
- 利用人工智慧改造現有經營模式
- 按細分市場分類的生成式人工智慧用例和部署藍圖
- 風險、限制和監管考量
- 供應鏈分析
- 關鍵零件的採購趨勢
- 前置作業時間分析
- 供應鏈中斷及緩解措施
- 在地採購和全球採購趨勢
- 產能和生產趨勢
- 按地區和主要生產商分類的設備產能
- 運轉率和擴張計劃
- 波特五力分析
- PESTEL 分析
第4章 競爭情勢
- 介紹
- 企業市佔率分析
- 按地區
- 企業矩陣分析
- 主要市場公司的競爭分析
- 競爭定位矩陣
- 主要進展
- 併購
- 夥伴關係與合作
- 新產品發布
- 業務拓展計劃
第5章 市場估計與預測:依類型分類,2022-2035年
- 中心線旋轉器(CCL)
- 輕型CCL旋轉器
- 重型CCL旋轉器
- 液壓裝配旋轉器
- 移動式液壓旋轉器
- 固定式液壓旋轉器
- 自對準旋轉器
- 手動可調自定心
- 自動自對準
第6章 市場估價與預測:依焊接方法分類,2022-2035年
- 潛弧焊接(SAW)
- 單軌表面聲鋸
- 多線SAW
- 鎢極惰性氣體保護焊 (TIG)
- 手動氬弧焊
- 自動氬弧焊
- 金屬惰性氣體保護焊(MIG焊)
- 短路 MIG
- 噴塗傳輸MIG
- 電弧焊接
- 遮護金屬電弧焊接(SMAW)
- 藥芯焊絲電電弧焊接(FCAW)
- 其他
第7章 市場估價與預測:依裝載能力分類,2022-2035年
- 2噸至100噸
- 100噸至500噸
- 5000噸至2000噸
- 超過2000噸
第8章 市場估計與預測:依應用領域分類,2022-2035年
- 壓力容器製造
- 工業壓力容器
- 液化石油氣/ING儲存槽
- 熱交換器製造
- 管殼式熱交換器
- 板式熱交換器
- 船舶建造及海洋結構製造
- 商船建造
- 海上平台和結構
- 管道焊接
- 石油和天然氣管道
- 用水和污水管
- 鍋爐水箱
- 工業鍋爐
- 儲存槽
- 風力渦輪機塔架
- 陸域風力發電塔
- 離岸風力塔
- 發電設備
- 渦輪機零件
- 發電機外殼
- 其他(重型機械製造、工廠建設等)
第9章 市場估計與預測:依最終用途產業分類,2022-2035年
- 石油和天然氣
- 上游部門
- 中游
- 下游
- 造船
- 商船
- 防禦艦艇
- 風力
- 陸域風力發電
- 離岸風電
- 發電
- 火力發電
- 核能發電
- 可再生能源
- 車
- 大型商用車輛
- 零件製造
- 航太
- 飛機製造
- 太空與國防
- 一般製造業
- 重型機械製造
- 工廠和施工機械
- 其他
第10章 市場估價與預測:依通路分類,2022-2035年
- 直接地
- 間接
第11章 市場估價與預測:按地區分類,2022-2035年
- 北美洲
- 美國
- 加拿大
- 歐洲
- 德國
- 英國
- 法國
- 義大利
- 西班牙
- 亞太地區
- 中國
- 印度
- 日本
- 韓國
- 澳洲
- 拉丁美洲
- 巴西
- 墨西哥
- 阿根廷
- 中東和非洲(MEA)
- 沙烏地阿拉伯
- 阿拉伯聯合大公國
- 南非
第12章:公司簡介
- Amin Machinery
- Anvin Engineers
- Cascade Corporation
- Cubuilt Engineers
- Huaheng Automation
- Indexator
- Innovic Technology
- Intermercato
- Key Plant Automation
- KUKA Robotics
- MG Welding
- Mogra Engineering
- Redrock Automation
- SENLISWELD
- V-Weld
The Global Conventional Rotators Market was valued at USD 297.2 million in 2025 and is estimated to grow at a CAGR of 3.6% to reach USD 421.9 million by 2035.
Growth is driven by increasing adoption of controlled rotation systems that enhance accuracy in cylindrical welding operations and reduce structural deformation during fabrication. Industries are increasingly prioritizing high-quality weld consistency, reduced rework, and improved productivity, which is strengthening the adoption of conventional rotators. These systems enable stable positioning of heavy components, ensuring improved dimensional precision and operational efficiency. Rising focus on automation in fabrication facilities is further accelerating demand, as manufacturers aim to minimize manual intervention and optimize workflow continuity. Integration with advanced welding systems such as manipulators and automated production lines is also improving operational scalability. Additionally, ongoing industrial modernization and the need for faster turnaround times in heavy engineering projects are reinforcing market adoption across global manufacturing environments.
| Market Scope | |
|---|---|
| Start Year | 2025 |
| Forecast Year | 2026-2035 |
| Start Value | $297.2 Million |
| Forecast Value | $421.9 Million |
| CAGR | 3.6% |
The market is further influenced by the growing emphasis on streamlined fabrication processes and enhanced production efficiency across heavy engineering sectors. Manufacturers are increasingly investing in equipment that supports continuous operation, reduces handling time, and improves workplace safety. Conventional rotators are becoming essential in enabling synchronized welding operations and supporting high-volume industrial output.
The self-aligning rotator segment generated USD 145.2 million in 2025 and is expected to grow at a CAGR of 4% from 2026 to 2035. This segment remains highly significant due to its ability to automatically adjust roller positioning based on the curvature and diameter of cylindrical components. Such functionality eliminates the need for manual adjustments and improves operational precision. These systems are particularly effective in handling components with irregular shapes, uneven surfaces, or varying thickness levels, which are common in heavy fabrication environments, thereby improving workflow efficiency and weld accuracy.
The self-aligning rotator segment generated USD 145.2 million in 2025 and is expected to grow at a CAGR of 4% from 2026 to 2035. These systems are designed to automatically adapt roller angles according to the workpiece geometry, removing the need for manual calibration. Their ability to manage cylindrical parts with minor distortions or inconsistent dimensions makes them highly valuable in heavy-duty fabrication processes where precision and stability are critical for achieving consistent welding outcomes.
U.S. Conventional Rotators Market accounted for USD 74.3 million in 2025 and is projected to grow at a CAGR of 3.5% from 2026 to 2035. Market growth in the country is supported by strong demand from industrial sectors requiring high-precision welding solutions. Expanding infrastructure projects, ongoing maintenance activities in energy systems, and increased industrial fabrication requirements are supporting equipment adoption. The shift toward digitalized manufacturing and automation is also contributing to demand for advanced rotators equipped with smart monitoring and operational efficiency features. Established fabrication facilities and strict quality standards further reinforce the need for high-performance rotational welding equipment across the region.
Key companies operating in the Global Conventional Rotators Market include Cascade Corporation, KUKA Robotics, Indexator, Key Plant Automation, Huaheng Automation, Amin Machinery, Anvin Engineers, Cubuilt Engineers, Innovic Technology, Intermercato, MG Welding, Mogra Engineering, Redrock Automation, SENLISWELD, and V-Weld. Companies in the Conventional Rotators Market are focusing on automation enhancement and product performance optimization to strengthen their market position. They are investing in advanced control systems that improve precision, load handling capacity, and operational safety. Strategic partnerships with industrial fabrication firms are helping expand application reach and improve customization capabilities. Manufacturers are also emphasizing integration with automated welding systems to support continuous production workflows. Expansion of service networks and aftersales support is improving customer retention and operational reliability. Additionally, companies are prioritizing digital monitoring technologies and predictive maintenance features to enhance equipment lifespan, reduce downtime, and improve efficiency across heavy industrial welding applications.
Table of Contents
Chapter 1 Methodology & Scope
- 1.1 Market scope & definitions
- 1.2 Research design
- 1.2.1 Research approach
- 1.2.2 Data collection methods
- 1.3 Base estimates and calculations
- 1.3.1 Base year calculation
- 1.3.2 Market estimates & forecasts parameters
- 1.4 Forecast Model
- 1.4.1 Key trends for market estimates
- 1.4.2 Quantified market impact analysis
- 1.4.2.1 Mathematical impact of growth parameters on forecast
- 1.4.3 Scenario analysis framework
- 1.5 Primary research and validation
- 1.5.1 Some of the primary sources (but not limited to)
- 1.6 Data mining sources
- 1.6.1 Paid Sources
- 1.7 Primary research and validation
- 1.7.1 Primary sources
- 1.8 Research Trail & confidence scoring
- 1.8.1 Research trail components
- 1.8.2 Scoring components
- 1.9 Research transparency addendum
- 1.9.1 Source attribution framework
- 1.9.2 Quality assurance metrics
- 1.9.3 Our commitment to trust
- 1.10 Market Definitions
Chapter 2 Executive Summary
- 2.1 Industry 360° synopsis
- 2.2 Key market trends
- 2.2.1 Regional
- 2.2.2 Type
- 2.2.3 Welding Types
- 2.2.4 Load Carrying Capacity
- 2.2.5 Application
- 2.2.6 End Use Industry
- 2.2.7 Distribution Channel
Chapter 3 Industry Insights
- 3.1 Industry ecosystem analysis
- 3.1.1 Raw material suppliers
- 3.1.2 Component manufacturers
- 3.1.3 Rotator OEMs
- 3.1.4 Distributors & dealers
- 3.1.5 End users
- 3.1.6 After-sales service providers
- 3.1.7 Value addition at each stage
- 3.1.8 Factor affecting the value chain
- 3.2 Industry impact forces
- 3.2.1 Growth drivers
- 3.2.1.1 Growing demand for precision & efficiency in heavy manufacturing
- 3.2.1.2 Expansion of renewable energy projects
- 3.2.1.3 Infrastructure development in emerging economies
- 3.2.2 Pitfalls & challenges
- 3.2.2.1 High initial investment costs
- 3.2.2.2 Need for frequent maintenance & skilled operators
- 3.2.3 Opportunities
- 3.2.3.1 Retrofit & upgrade market for existing equipment
- 3.2.3.2 Emerging markets in Asia Pacific & Latin America
- 3.2.1 Growth drivers
- 3.3 Growth potential analysis
- 3.4 Future market trends
- 3.5 Technology and innovation landscape
- 3.5.1 Current technological trends
- 3.5.2 Emerging technologies
- 3.6 Price trends
- 3.6.1 By region
- 3.6.2 By product
- 3.6.3 Historical price trend analysis
- 3.6.4 Pricing strategy by player type
- 3.7 Regulatory landscape
- 3.7.1 OSHA Safety Standards for Welding Equipment
- 3.7.2 ASME Codes & Standards
- 3.7.3 CE Marking Requirements (Europe)
- 3.7.4 API Standards for Oil & Gas Applications
- 3.7.5 Environmental Regulations
- 3.8 Trade data analysis (driven by primary research) - (HS Code - 84682090)
- 3.8.1 Import/Export Volume & Value Trends
- 3.8.2 Key Trade Corridors & Tariff Impact
- 3.9 Impact of AI & Generative AI on the Market
- 3.9.1 AI-driven disruption of existing business models
- 3.9.2 GenAI use cases & adoption roadmap by segment
- 3.9.3 Risks, limitations & regulatory considerations
- 3.10 Supply chain analysis
- 3.10.1 Key component sourcing dynamics
- 3.10.2 Lead time analysis
- 3.10.3 Supply chain disruptions & mitigation strategies
- 3.10.4 Localization vs. Global sourcing trends
- 3.11 Capacity & production landscape
- 3.11.1 Installed capacity by region & key producer
- 3.11.2 Capacity utilization rates & expansion pipelines
- 3.12 Porter's analysis
- 3.13 PESTEL analysis
Chapter 4 Competitive Landscape, 2025
- 4.1 Introduction
- 4.2 Company market share analysis
- 4.2.1 By Region
- 4.2.1.1 North America
- 4.2.1.2 Europe
- 4.2.1.3 Asia Pacific
- 4.2.1.4 Latin America
- 4.2.1.5 Middle East & Africa
- 4.2.1 By Region
- 4.3 Company matrix analysis
- 4.4 Competitive analysis of major market players
- 4.5 Competitive positioning matrix
- 4.6 Key developments
- 4.6.1 Mergers & acquisitions
- 4.6.2 Partnerships & collaborations
- 4.6.3 New product launches
- 4.6.4 Expansion plans
Chapter 5 Market Estimates & Forecast, By Type, 2022 - 2035, (USD Million) (Thousand Units)
- 5.1 Key trends
- 5.2 Constant center line (CCL) rotator
- 5.2.1 Light-Duty CCL Rotators
- 5.2.2 Heavy-Duty CCL Rotators
- 5.3 Hydraulic fit up rotator
- 5.3.1 Mobile hydraulic rotators
- 5.3.2 Stationary hydraulic rotators
- 5.4 Self-aligning rotator
- 5.4.1 Manual adjustment self-aligning
- 5.4.2 Automatic self-aligning
Chapter 6 Market Estimates & Forecast, By Welding Type, 2022 - 2035, (USD Million) (Thousand Units)
- 6.1 Key trends
- 6.2 Submerged arc welding (SAW)
- 6.2.1 Single-Wire SAW
- 6.2.2 Multi-Wire SAW
- 6.3 Tungsten Inert Gas (TIG) Welding
- 6.3.1 Manual TIG
- 6.3.2 Automated TIG
- 6.4 Metal Inert Gas (MIG) Welding
- 6.4.1 Short Circuit MIG
- 6.4.2 Spray Transfer MIG
- 6.5 Arc Welding
- 6.5.1 Shielded Metal Arc Welding (SMAW)
- 6.5.2 Flux-Cored Arc Welding (FCAW)
- 6.6 Others
Chapter 7 Market Estimates & Forecast, By Load Capacity, 2022 - 2035, (USD Million) (Thousand Units)
- 7.1 Key trends
- 7.2 Up to 2 tons to 100 tons
- 7.3 100 tons to 500 ton
- 7.4 5000 ton to 2000 ton
- 7.5 More than 2000 tons
Chapter 8 Market Estimates & Forecast, By Application, 2022 - 2035, (USD Million) (Thousand Units)
- 8.1 Key trends
- 8.2 Pressure vessel manufacturing
- 8.2.1 Industrial pressure vessels
- 8.2.2 LPG/ING storage vessels
- 8.3 Heat exchangers manufacturing
- 8.3.1 Shell & tube heat exchangers
- 8.3.2 Plate heat exchangers
- 8.4 Shipbuilding & offshore fabrication
- 8.4.1 Commercial shipbuilding
- 8.4.2 Offshore platforms & structures
- 8.5 Pipe welding
- 8.5.1 Oil & gas pipelines
- 8.5.2 Water & wastewater pipelines
- 8.6 Boilers & tanks
- 8.6.1 Industrial boilers
- 8.6.2 Storage tanks
- 8.7 Wind towers
- 8.7.1 Onshore wind towers
- 8.7.2 Offshore wind towers
- 8.8 Power generation equipment
- 8.8.1 Turbine components
- 8.8.2 Generator casings
- 8.9 Others (heavy equipment fabrication, plant construction, etc.)
Chapter 9 Market Estimates & Forecast, By End Use Industry, 2022 - 2035, (USD Million) (Thousand Units)
- 9.1 Key trends
- 9.2 Oil & Gas
- 9.2.1 Upstream
- 9.2.2 Midstream
- 9.2.3 Downstream
- 9.3 Shipbuilding
- 9.3.1 Commercial vessels
- 9.3.2 Defense vessels
- 9.4 Wind energy
- 9.4.1 Onshore wind
- 9.4.2 Offshore wind
- 9.5 Power generation
- 9.5.1 Thermal power
- 9.5.2 Nuclear power
- 9.5.3 Renewable power
- 9.6 Automotive
- 9.6.1 Heavy commercial vehicles
- 9.6.2 Component manufacturing
- 9.7 Aerospace
- 9.7.1 Aircraft manufacturing
- 9.7.2 Space & defense
- 9.8 General manufacturing
- 9.8.1 Heavy equipment fabrication
- 9.8.2 Plant & construction equipment
- 9.9 Others
Chapter 10 Market Estimates & Forecast, By Distribution Channel, 2022 - 2035, (USD Million) (Thousand Units)
- 10.1 Key trends
- 10.2 Direct
- 10.3 Indirect
Chapter 11 Market Estimates & Forecast, By Region, 2022 - 2035, (USD Million) (Thousand Units)
- 11.1 Key trends
- 11.2 North America
- 11.2.1 U.S.
- 11.2.2 Canada
- 11.3 Europe
- 11.3.1 Germany
- 11.3.2 UK
- 11.3.3 France
- 11.3.4 Italy
- 11.3.5 Spain
- 11.4 Asia Pacific
- 11.4.1 China
- 11.4.2 India
- 11.4.3 Japan
- 11.4.4 South Korea
- 11.4.5 Australia
- 11.5 Latin America
- 11.5.1 Brazil
- 11.5.2 Mexico
- 11.5.3 Argentina
- 11.6 MEA
- 11.6.1 Saudi Arabia
- 11.6.2 UAE
- 11.6.3 South Africa
Chapter 12 Company Profiles
- 12.1 Amin Machinery
- 12.2 Anvin Engineers
- 12.3 Cascade Corporation
- 12.4 Cubuilt Engineers
- 12.5 Huaheng Automation
- 12.6 Indexator
- 12.7 Innovic Technology
- 12.8 Intermercato
- 12.9 Key Plant Automation
- 12.10 KUKA Robotics
- 12.11 MG Welding
- 12.12 Mogra Engineering
- 12.13 Redrock Automation
- 12.14 SENLISWELD
- 12.15 V-Weld
