

 |
市場調查報告書
商品編碼
2038407
2026 年至 2035 年手持式 3D 掃描器的市場機會、成長要素、產業趨勢分析與預測。Handheld 3D Scanners Market Opportunity, Growth Drivers, Industry Trend Analysis, and Forecast 2026 - 2035 |
||||||
2025年全球手持式3D掃描器市場價值為18億美元,預計2035年將以6.9%的複合年成長率成長至34億美元。
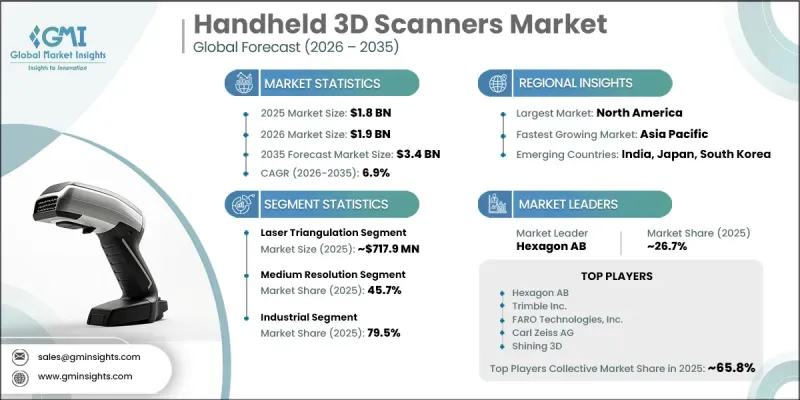
市場成長主要得益於3D掃描技術在製造流程中日益廣泛的應用,尤其是在精密測量和品質保證領域。手持式3D掃描器透過實現即時檢測並減少對傳統手動測量技術的依賴,正被擴大用於提高生產精度。汽車、航太和電子等行業正穩步將這些設備應用於檢測和合規流程,以滿足嚴格的品質標準。這些設備的便攜性、柔軟性和易操作性使其能夠有效地現場掃描複雜形狀,從而提高營運效率。對更短產品開發週期的需求不斷成長,進一步加速了3D掃描技術的應用,因為數位掃描可以幫助工程師創建用於設計檢驗和原型製作的精確模型。這不僅能夠提高產品效能,還能縮短開發時間和降低整體成本。各行業對創新、客製化和數位轉型的日益重視也推動了市場擴張,因為企業正在優先採用先進的掃描解決方案來增強自身競爭力並簡化工作流程。
| 市場範圍 | |
|---|---|
| 開始年份 | 2025 |
| 預測期 | 2026-2035 |
| 上市時的市場規模 | 18億美元 |
| 預測市場規模 | 34億美元 |
| 複合年成長率 | 6.9% |
預計到2025年,雷射三角測量市場規模將達到7.179億美元,並在2026年至2035年間以6.2%的複合年成長率成長。此市場成長的主要驅動力在於其強大的高精度3D測量和精細表面幾何形狀獲取能力。這項技術的工作原理是:將雷射照射到物體上,並採集反射光數據以建立精確的數位模型。它被廣泛應用於對尺寸精度要求極高的工業環境。雷射三角測量能夠有效掃描小型、複雜精密的零件,使其在品質檢測、逆向工程和製造應用中極具價值。速度、精度和可靠性的完美結合進一步鞏固了雷射三角測量技術的市場地位。
預計到2025年,中等解析度掃描器的市佔率將達到45.7%,並在2026年至2035年間以9.6%的複合年成長率成長。這個細分市場佔據主導地位的原因在於,它在掃描精度、處理速度和資料量之間實現了最佳平衡,使其適用於廣泛的工業和商用應用。中等解析度掃描器廣泛應用於檢測、產品開發和設計檢驗流程,這些流程需要穩定的精度,同時避免資料過於複雜。其高效性和成本效益使其成為尋求可靠性能和高效工作流程的工程師和製造商的理想選擇。這些優勢持續推動著中等解析度掃描器在各工業領域的廣泛應用。
美國手持式3D掃描儀市場預計到2025年將達到5.638億美元,並在2026年至2035年間以5.6%的複合年成長率成長。美國市場成長的主要驅動力是製造業、醫療業、航太業和汽車業的強勁需求。手持式3D掃描器廣泛應用於逆向工程、快速原型製作、品質檢測和客製化零件設計等領域。市場對兼具便攜性和高精度性能的緊湊型設備的需求日益成長。製造商正致力於開發更易於使用、具備無線連接功能並與CAD平台無縫整合的系統,以簡化工作流程。分銷管道包括企業直接採購、工業供應商和數位銷售平台,確保了產品的廣泛市場覆蓋。
目錄
第1章:調查方法和範圍
第2章執行摘要
第3章業界考察
- 生態系分析
- 供應商情況
- 利潤率
- 每個階段增加的價值
- 影響價值鏈的因素
- 影響產業的因素
- 促進因素
- 擴大 3D 掃描技術在製造業和品質檢測的應用。
- 擴大 3D 掃描技術在製造業和品質檢測的應用。
- 對快速原型製作和產品開發的需求日益成長
- 陷阱與挑戰
- 先進的手持式3D掃描設備高成本
- 資料處理和軟體整合的複雜性
- 機會
- 擴大其在文化遺產保護和考古領域的應用
- 與擴增實境(AR) 和虛擬實境 (VR) 平台整合
- 促進因素
- 成長潛力分析
- 未來市場趨勢
- 科技與創新趨勢
- 當前技術趨勢
- 新興技術
- 監理情勢
- 標準和合規要求
- 區域法規結構
- 認證標準
- 波特五力分析
- PESTEL 分析
- 價格分析(基於初步調查)
- 對過去價格趨勢的分析(基於初步研究)
- 根據球員類型(高階/超值/成本加成)制定的定價策略(基於初步研究)
- 區域價格波動及其決定因素
- 總擁有成本 (TCO) 分析
- 貿易資料分析(HS編碼9031.49)(基於初步調查)
- 進出口數量和價值的變化趨勢(基於初步調查)
- 主要貿易走廊及關稅影響(基於初步調查)
- 區域貿易趨勢和跨境物流
- 人工智慧和生成式人工智慧對市場的影響
- 利用人工智慧改造現有經營模式
- 針對特定領域的生成式人工智慧應用案例和實施藍圖
- 風險、限制和監管考量
- 基礎設施和實施情況(基於初步調查)
- 按地區和購買者群體分類的採用率和滲透率(基於初步調查)
- 基礎設施投資的可擴展性限制和趨勢(基於初步調查)
第4章 競爭情勢
- 介紹
- 企業市佔率分析
- 按地區
- 企業矩陣分析
- 主要市場公司的競爭分析
- 競爭定位矩陣
- 主要進展
- 併購
- 夥伴關係與合作
- 新產品發布
- 業務拓展計劃
第5章 市場估算與預測:依產品類型分類,2022-2035年
- 雷射三角測量
- 結構光
- 攝影測量
- 飛行時間(ToF)
第6章 市場估計與預測:依解析度分類,2022-2035年
- 低解析度
- 中等解析度
- 高解析度
第7章 市場估算與預測:ScanScope 數據,2022-2035 年
- 短距離(小於1公尺)
- 中距離(1-3公尺)
- 遠距離(3公尺或以上)
第8章 市場估算與預測:依色彩捕捉技術分類,2022-2035年
- 形狀特定掃描儀
- 彩色掃描儀
第9章 市場估計與預測:依性別分類的攜帶式設備市場,2022-2035年
- 電池供電
- 電源
第10章 市場估價與預測:依連結方式分類,2022-2035年
- 無線的
- 有線
第11章 市場估計與預測:依應用領域分類,2022-2035年
- 住宅
- 商業的
- 工業的
第12章 市場估計與預測:依通路分類,2022-2035年
- 離線
- 線上
第13章 市場估計與預測:依地區分類,2022-2035年
- 北美洲
- 美國
- 加拿大
- 歐洲
- 德國
- 英國
- 法國
- 義大利
- 西班牙
- 亞太地區
- 中國
- 印度
- 日本
- 韓國
- 澳洲
- 拉丁美洲
- 巴西
- 墨西哥
- 阿根廷
- 中東和非洲(MEA)
- 沙烏地阿拉伯
- 阿拉伯聯合大公國
- 南非
第14章:公司簡介
- 3DMakerpro
- Artec 3D
- Carl Zeiss AG
- Creaform
- Einstar
- FARO Technologies, Inc.
- Hexagon AB
- Kreon Technologies
- Nikon Corporation
- Peel 3D
- Polyga Inc.
- Revopoint 3D Technologies Inc.
- Scantech(Hangzhou)Co., Ltd.
- Shining 3D Tech Co., Ltd.
- Trimble Inc.
The Global Handheld 3D Scanners Market was valued at USD 1.8 billion in 2025 and is estimated to grow at a CAGR of 6.9% to reach USD 3.4 billion by 2035.
Growth in this market is supported by the increasing integration of 3D scanning technologies into manufacturing workflows, especially for precision measurement and quality assurance applications. Handheld 3D scanners are increasingly used to improve production accuracy by enabling real-time inspection and reducing dependency on traditional manual measurement techniques. Industries such as automotive, aerospace, and electronics are steadily incorporating these devices into inspection and compliance processes to meet strict quality standards. Their portability, flexibility, and ease of operation allow efficient scanning of complex geometries directly on-site, which improves operational efficiency. Rising demand for faster product development cycles is further accelerating adoption, as digital scanning helps engineers create precise models for design validation and prototyping. This reduces development time and overall costs while improving product performance. Increasing focus on innovation, customization, and digital transformation across industrial sectors is also strengthening market expansion, as businesses prioritize advanced scanning solutions to enhance competitiveness and streamline workflows.
| Market Scope | |
|---|---|
| Start Year | 2025 |
| Forecast Year | 2026-2035 |
| Start Value | $1.8 Billion |
| Forecast Value | $3.4 Billion |
| CAGR | 6.9% |
The laser triangulation segment generated USD 717.9 million in 2025 and is expected to grow at a CAGR of 6.2% from 2026 to 2035. This segment leads the market due to its strong capability to capture highly accurate 3D measurements and detailed surface geometry. The technology works by projecting a laser onto an object and capturing reflected light data to construct precise digital models. It is widely adopted in industrial environments where dimensional precision is essential. Its ability to efficiently scan small, intricate, and complex components makes it highly valuable for quality inspection, reverse engineering, and manufacturing applications. The combination of speed, accuracy, and reliability continues to reinforce the strong market position of laser triangulation technology.
The medium resolution segment accounted for 45.7% share in 2025 and is projected to grow at a CAGR of 9.6% from 2026 to 2035. This segment dominates because it provides an optimal balance between scanning accuracy, processing speed, and data size, making it suitable for a wide range of industrial and professional applications. Medium-resolution scanners are widely used in inspection, product development, and design validation processes where consistent accuracy is required without excessive data complexity. Their efficiency and cost-effectiveness make them highly attractive to engineers and manufacturers seeking dependable performance and streamlined workflows. These advantages continue to support strong adoption across multiple industries.
U.S. Handheld 3D Scanners Market captured USD 563.8 million in 2025 and is projected to grow at a CAGR of 5.6% from 2026 to 2035. Market growth in the country is driven by strong adoption across manufacturing, healthcare, aerospace, and automotive industries. Handheld 3D scanners are widely used for applications such as reverse engineering, rapid prototyping, quality inspection, and customized component design. Demand is increasing for compact, high-accuracy devices that combine portability with precision performance. Manufacturers are focusing on developing systems with improved usability, wireless connectivity, and seamless integration with CAD platforms to enhance workflow efficiency. Distribution channels include direct enterprise procurement, industrial suppliers, and digital sales platforms, ensuring broad market accessibility.
Key companies operating in the Global Handheld 3D Scanners Market include Artec 3D, FARO Technologies, Inc., Hexagon AB, Trimble Inc., and Carl Zeiss AG. Other prominent players are Creaform, Shining 3D Tech Co., Ltd., Revopoint 3D Technologies Inc., Scantech (Hangzhou) Co., Ltd., Nikon Corporation, Kreon Technologies, Polyga Inc., Peel 3D, 3DMakerpro, and Einstar. Companies in the Handheld 3D Scanners Market are actively strengthening their position through continuous product innovation focused on improving scanning speed, resolution accuracy, and device portability. Manufacturers are investing in advanced software integration, especially CAD compatibility and AI-powered processing tools, to enhance usability and workflow efficiency. Strategic collaborations with industrial sectors such as automotive and aerospace are helping expand application areas. Firms are also prioritizing wireless and cloud-enabled solutions to support real-time data sharing and remote operations. Cost optimization and scalable production strategies are being used to improve global competitiveness. Additionally, companies are expanding distribution networks through direct enterprise sales, digital platforms, and industrial partnerships.
Table of Contents
Chapter 1 Methodology & Scope
- 1.1 Market scope and definition
- 1.2 Research design
- 1.2.1 Research approach
- 1.2.2 Data collection methods
- 1.3 Data mining sources
- 1.3.1 Global
- 1.3.2 Regional/Country
- 1.4 Base estimates and calculations
- 1.4.1 Base year calculation
- 1.4.2 Key trends for market estimation
- 1.5 Primary research and validation
- 1.5.1 Primary sources
- 1.6 Forecast model
- 1.7 Research assumptions and limitations
Chapter 2 Executive Summary
- 2.1 Industry 360° synopsis
- 2.2 Key market trends
- 2.2.1 Regional
- 2.2.2 Type
- 2.2.3 Resolution
- 2.2.4 Scanning Range
- 2.2.5 Color Capture
- 2.2.6 Portability
- 2.2.7 Connectivity
- 2.2.8 Application
- 2.2.9 Distribution channel
Chapter 3 Industry Insights
- 3.1 Industry ecosystem analysis
- 3.1.1 Supplier landscape
- 3.1.2 Profit margin
- 3.1.3 Value addition at each stage
- 3.1.4 Factor affecting the value chain
- 3.2 Industry impact forces
- 3.2.1 Growth drivers
- 3.2.1.1 Increasing adoption of 3D scanning in manufacturing and quality inspection
- 3.2.1.2 Increasing adoption of 3D scanning in manufacturing and quality inspection
- 3.2.1.3 Rising demand for rapid prototyping and product development
- 3.2.2 Pitfalls & Challenges
- 3.2.2.1 High cost of advanced handheld 3D scanning devices
- 3.2.2.2 Complexity in data processing and software integration
- 3.2.3 Opportunities
- 3.2.3.1 Growing adoption in cultural heritage preservation and archaeology
- 3.2.3.2 Integration with augmented reality (AR) and virtual reality (VR) platforms
- 3.2.1 Growth drivers
- 3.3 Growth potential analysis
- 3.4 Future market trends
- 3.5 Technology and innovation landscape
- 3.5.1 Current technological trends
- 3.5.2 Emerging technologies
- 3.6 Regulatory landscape
- 3.6.1 Standards and compliance requirements
- 3.6.2 Regional regulatory frameworks
- 3.6.3 Certification standards
- 3.7 Porter's analysis
- 3.8 PESTEL analysis
- 3.9 Pricing analysis (driven by primary research)
- 3.9.1 Historical price trend analysis (driven by primary research)
- 3.9.2 Pricing strategy by player type (premium / value / cost-plus) (driven by primary research)
- 3.9.3 Regional price variations and determinants
- 3.9.4 Total cost of ownership analysis
- 3.10 Trade data analysis (HS Code 9031.49) (driven by primary research)
- 3.10.1 Import/export volume and value trends (driven by primary research)
- 3.10.2 Key trade corridors and tariff impact (driven by primary research)
- 3.10.3 Regional trade dynamics and cross-border flows
- 3.11 Impact of AI and generative AI on the market
- 3.11.1 AI-driven disruption of existing business models
- 3.11.2 GenAI use cases and adoption roadmap by segment
- 3.11.3 Risks, limitations, and regulatory considerations
- 3.12 Infrastructure and deployment landscape (driven by primary research)
- 3.12.1 Deployment penetration by region and buyer segment (driven by primary research)
- 3.12.2 Scalability constraints and infrastructure investment trends (driven by primary research)
Chapter 4 Competitive Landscape, 2025
- 4.1 Introduction
- 4.2 Company market share analysis
- 4.2.1 By Region
- 4.2.1.1 North America
- 4.2.1.2 Europe
- 4.2.1.3 Asia Pacific
- 4.2.1.4 Latin America
- 4.2.1.5 Middle East & Africa
- 4.2.1 By Region
- 4.3 Company matrix analysis
- 4.4 Competitive analysis of major market players
- 4.5 Competitive positioning matrix
- 4.6 Key developments
- 4.6.1 Mergers & acquisitions
- 4.6.2 Partnerships & collaborations
- 4.6.3 New product launches
- 4.6.4 Expansion plans
Chapter 5 Market Estimates & Forecast, By Product Type, 2022 - 2035, (USD Billion) (Thousand Units)
- 5.1 Key trends
- 5.2 Laser triangulation
- 5.3 Structured light
- 5.4 Photogrammetry
- 5.5 Time-of-flight (ToF)
Chapter 6 Market Estimates & Forecast, By Resolution, 2022 - 2035, (USD Billion) (Thousand Units)
- 6.1 Key trends
- 6.2 Low resolution
- 6.3 Medium resolution
- 6.4 High-resolution
Chapter 7 Market Estimates & Forecast, By Scanning Range, 2022 - 2035, (USD Billion) (Thousand Units)
- 7.1 Key trends
- 7.2 Short-range (up to 1 meter)
- 7.3 Medium-range (1-3 meters)
- 7.4 Long-range (3+ meters)
Chapter 8 Market Estimates & Forecast, By Color Capture, 2022 - 2035, (USD Billion) (Thousand Units)
- 8.1 Key trends
- 8.2 Geometry-only scanners
- 8.3 Color-capable scanners
Chapter 9 Market Estimates & Forecast, By Portability, 2022 - 2035, (USD Billion) (Thousand Units)
- 9.1 Key trends
- 9.2 Battery-powered
- 9.3 Power source
Chapter 10 Market Estimates & Forecast, By Connectivity, 2022 - 2035, (USD Billion) (Thousand Units)
- 10.1 Key trends
- 10.2 Wireless
- 10.3 Wired
Chapter 11 Market Estimates & Forecast, By Application, 2022 - 2035, (USD Billion) (Thousand Units)
- 11.1 Key trends
- 11.2 Residential
- 11.3 Commercial
- 11.4 Industrial
Chapter 12 Market Estimates & Forecast, By Distribution Channel, 2022 - 2035, (USD Billion) (Thousand Units)
- 12.1 Key trends
- 12.2 Offline
- 12.3 Online
Chapter 13 Market Estimates & Forecast, By Region, 2022 - 2035, (USD Billion) (Thousand Units)
- 13.1 Key trends
- 13.2 North America
- 13.2.1 U.S.
- 13.2.2 Canada
- 13.3 Europe
- 13.3.1 Germany
- 13.3.2 UK
- 13.3.3 France
- 13.3.4 Italy
- 13.3.5 Spain
- 13.4 Asia Pacific
- 13.4.1 China
- 13.4.2 India
- 13.4.3 Japan
- 13.4.4 South Korea
- 13.4.5 Australia
- 13.5 Latin America
- 13.5.1 Brazil
- 13.5.2 Mexico
- 13.5.3 Argentina
- 13.6 MEA
- 13.6.1 Saudi Arabia
- 13.6.2 UAE
- 13.6.3 South Africa
Chapter 14 Company Profiles
- 14.1 3DMakerpro
- 14.2 Artec 3D
- 14.3 Carl Zeiss AG
- 14.4 Creaform
- 14.5 Einstar
- 14.6 FARO Technologies, Inc.
- 14.7 Hexagon AB
- 14.8 Kreon Technologies
- 14.9 Nikon Corporation
- 14.10 Peel 3D
- 14.11 Polyga Inc.
- 14.12 Revopoint 3D Technologies Inc.
- 14.13 Scantech (Hangzhou) Co., Ltd.
- 14.14 Shining 3D Tech Co., Ltd.
- 14.15 Trimble Inc.
 2026年全球印表機、掃描器和影像市場報告
 條碼掃描器市場:按產品類型、應用和技術分類
 工業條碼掃描器市場:依產品、產業、技術、連接方式及銷售管道分類-2026-2032年全球市場預測條碼掃描器市場:2026-2032年全球市場預測(按應用、最終用戶、技術、類型和分銷管道分類)2026年全球櫃檯條碼掃描器市場報告
 條碼掃描器市場分析及預測(至2035年):類型、產品類型、技術、應用、組件、最終用戶、部署模式、功能、外形及設備
 條碼掃描器市場報告:按產品、類型、掃描器類型、技術、組件、最終用途行業和地區分類,2026-2034 年環形條碼掃描器市場按掃描器類型、掃描技術、有線、藍牙、Wi-Fi、大型企業、中小企業和應用領域分類-2026-2032年全球預測穿戴式條碼掃描器市場:按產品類型、技術、連接方式、終端用戶產業、應用、銷售管道分類 - 全球預測 2026-2032
 條碼掃描器市場 - 2026-2031 年預測