

 |
市場調查報告書
商品編碼
2038324
搭乘用電動車市場商機、成長要素、產業趨勢分析及2026-2035年預測。Passenger Electric Vehicle Market Opportunity, Growth Drivers, Industry Trend Analysis, and Forecast 2026 - 2035 |
||||||

預計到 2025 年,全球搭乘用電動車市場規模將達到 7,777 億美元,年複合成長率為 8.6%,到 2035 年將達到 1.75 兆美元。
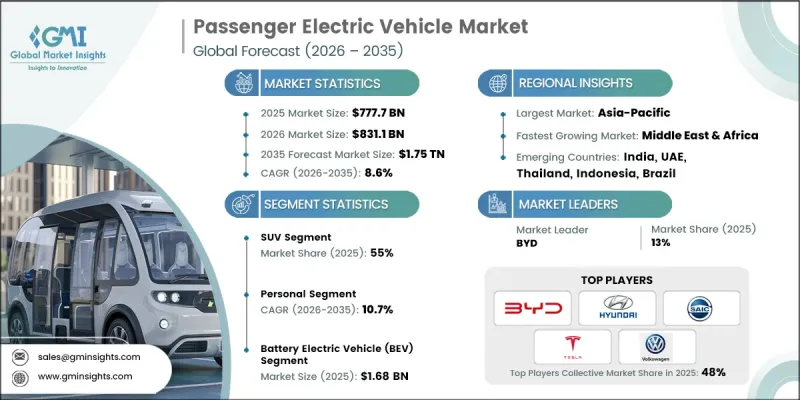
這一成長勢頭得益於電池成本的下降、車輛性能的提升以及重點地區充電基礎設施的快速發展。汽車製造商正增加對專用電動車平台、電池供應鏈和以軟體為中心的車輛架構的投資,從而減少對傳統內燃機技術的依賴,因為後者長期回報有限。排放氣體監管壓力進一步加速了這項轉型,而消費者對效率和永續性的日益成長的期望也進一步強化了市場需求。隨著電池系統和車輛工程技術的不斷創新,續航里程、性能可靠性和整體用車體驗都在不斷提升,電動乘用車正逐漸成為未來出行生態系統的核心組成部分。
| 市場範圍 | |
|---|---|
| 開始年份 | 2025 |
| 預測期 | 2026-2035 |
| 初始市場規模 | 7777億美元 |
| 預計金額 | 1.75兆美元 |
| 複合年成長率 | 8.6% |
多地政府日益嚴格的監管正在加速向低排放量交通解決方案的轉型。補貼和稅收減免等財政獎勵在促進電動車普及方面發揮重要作用。同時,電池技術的進步提高了能量密度、成本效益和整體性能,使電動車更容易被更廣泛的消費者群體所接受。這些趨勢共同造就了一個競爭更加激烈、瞬息萬變的市場格局。
搭乘用電動車市場也受到全球供應鏈中斷的影響,導致生產計畫和原料供應受到影響。這些挑戰促使製造商更加重視在地採購和供應鏈韌性。向區域製造生態系統的轉變有望增強長期穩定性,並降低對外部供應鏈的依賴。
預計到2025年,SUV市佔率將達到55%,並在2026年至2035年間以9.8%的複合年成長率成長。由於消費者偏好強勁且製造商利潤空間可觀,該細分市場持續保持成長動能。汽車製造商正優先研發電動SUV,以應對不斷變化的需求模式並最大限度地提高利潤潛力,這進一步推動了該細分市場的成長。
預計到2025年,個人用戶市場將佔82%的市場佔有率,並在2026年至2035年間以10.7%的複合年成長率成長。價格優勢、車型選擇範圍的擴大以及政策支援措施正在推動個人消費者的購買。營運成本的降低、環境影響的減少以及充電基礎設施的不斷改善是影響購買決策並推動該市場持續成長的關鍵因素。
預計到2025年,中國搭乘用電動車市場規模將達到2,849億美元,繼續維持在全球市場的領先地位。中國強大的製造能力、龐大的國內需求基礎以及積極拓展國際市場,為其主導地位提供了有力支撐。持續增加對產能和技術創新的投入,進一步鞏固了中國在全球電動車產業格局中的角色。
目錄
第1章:調查方法和範圍
第2章執行摘要
第3章業界考察
- 生態系分析
- 供應商情況
- 電池製造商
- 零件供應商
- OEM(Original Equipment Manufacturer)
- 銷售代理商/經銷商
- 電池製造商
- 最終用戶
- 成本結構
- 利潤率
- 每個階段增加的價值
- 垂直整合趨勢
- 顛覆者
- 供應商情況
- 影響因素
- 促進因素
- 強而有力的政府獎勵、補貼和排放法規
- 電池成本的持續下降使得電動車的價格競爭力更強。
- 公共和私人充電基礎設施的快速擴張
- 人們環保意識的增強和對永續發展的承諾日益增強。
- 產業潛在風險與挑戰
- 電動車初始購置成本高
- 部分地區缺乏充電基礎設施
- 市場機遇
- 新興市場蘊藏著巨大的、尚未開發的成長潛力
- 電池技術和快速充電解決方案的進步
- 促進因素
- 技術趨勢與創新生態系統
- 目前技術
- 新興技術
- 成長潛力分析
- 監理情勢
- 北美洲
- 通貨膨脹控制法
- 空氣清淨法
- 歐洲
- 歐洲綠色新政
- 歐7排放氣體標準
- 亞太地區
- 新能源汽車(NEV)信用政策
- 汽車業標準 (AIS) 156
- 拉丁美洲
- 2030號路線計劃
- 墨西哥的NOM排放標準
- 中東和非洲
- 阿拉伯聯合大公國2050年淨零排放策略
- 南非綠色交通戰略
- 北美洲
- 波特五力分析
- PESTEL 分析
- 專利分析(基於初步研究)
- 價格分析(基於初步調查)
- 對過去價格趨勢的分析
- 按玩家類型分類的定價策略
- 生產能力和生產趨勢(基於初步調查)
- 按地區和主要生產商分類的已安裝產能
- 設備運轉率和擴建計劃
- 交易數據分析(基於初步調查)
- 進出口量及進口額趨勢
- 主要貿易走廊及關稅的影響
- 永續性和環境方面
- 永續計劃
- 減少廢棄物策略
- 生產中的能源效率
- 具有環保意識的舉措
- 關於碳足跡的考量
- 人工智慧和生成式人工智慧對市場的影響
- 利用人工智慧改造現有經營模式
- 針對特定領域的生成式人工智慧應用案例和實施藍圖
- 風險、限制和監管考量
- 預測假設和情境分析(基於初步研究)
- 基本案例-驅動複合年成長率的關鍵宏觀經濟與產業變量
- 樂觀情境-宏觀經濟與產業的順風
- 悲觀情景-宏觀經濟放緩或產業逆風
第4章 競爭情勢
- 介紹
- 企業市佔率分析
- 主要市場公司的競爭分析
- 競爭定位矩陣
- 企業級分層基準測試
- 層級分類標準與選擇標準
- 按銷售額、地區和創新能力分類的層級定位矩陣。
- 主要進展
- 併購
- 夥伴關係和聯盟
- 新產品發布
- 業務拓展計劃及資金籌措
第5章 市場估價與預測:依車輛類型分類,2022-2035年
- 掀背車
- 轎車
- SUV
- 其他
第6章 市場估計與預測:依驅動系統分類,2022-2035年
- 前輪驅動
- 後輪驅動
- 全輪驅動
第7章 市場估計與預測:依促進因素分類,2022-2035年
- 電池式電動車(BEV)
- 燃料電池汽車(FCEV)
- 插電式混合動力汽車(PHEV)
第8章 市場估計與預測:依應用領域分類,2022-2035年
- 對於個人
- 商業的
第9章 市場估計與預測:依價格分類,2022-2035年
- 介紹
- 中價位
- 奢華
第10章 市場估價與預測:依地區分類,2022-2035年
- 北美洲
- 美國
- 加拿大
- 歐洲
- 英國
- 德國
- 法國
- 義大利
- 西班牙
- 比利時
- 荷蘭
- 瑞典
- 俄羅斯
- 亞太地區
- 中國
- 印度
- 日本
- 澳洲
- 新加坡
- 韓國
- 越南
- 印尼
- 拉丁美洲
- 巴西
- 墨西哥
- 阿根廷
- 中東和非洲(MEA)
- 南非
- 沙烏地阿拉伯
- 阿拉伯聯合大公國
第11章:公司簡介
- 世界公司
- Audi
- BMW
- Ford
- General Motors
- Hyundai
- Kia
- Mercedes-Benz
- Nissan
- Renault
- Tesla
- Toyota
- Volkswagen
- 本地球員
- BYD
- Chery
- Geely
- JAC Motors
- SAIC Motor
- 新興企業
- Chery Automobile
- Great Wall Motors
- Quantum Motors
The Global Passenger Electric Vehicle Market was valued at USD 777.7 billion in 2025 and is estimated to grow at a CAGR of 8.6% to reach USD 1.75 trillion by 2035.
Growth momentum is supported by declining battery costs, improved vehicle performance, and the rapid development of charging infrastructure across key regions. Automakers are increasingly allocating investments toward dedicated electric platforms, battery supply chains, and software-centric vehicle architectures, reducing reliance on traditional internal combustion technologies that offer limited long-term returns. Regulatory pressure related to emissions is further accelerating the transition, while evolving consumer expectations around efficiency and sustainability continue to strengthen demand. Continuous innovation in battery systems and vehicle engineering is enhancing driving range, performance reliability, and overall ownership experience, positioning electric passenger vehicles as a central component of the future mobility ecosystem.
| Market Scope | |
|---|---|
| Start Year | 2025 |
| Forecast Year | 2026-2035 |
| Start Value | $777.7 Billion |
| Forecast Value | $1.75 Trillion |
| CAGR | 8.6% |
Government regulations across multiple regions are becoming more stringent, encouraging a shift toward low-emission transportation solutions. Financial incentives, including subsidies and tax benefits, are playing a key role in supporting adoption. At the same time, advancements in battery technologies are improving energy density, cost efficiency, and overall performance, making electric vehicles more accessible to a broader consumer base. These developments are contributing to a more competitive and rapidly evolving market landscape.
The passenger electric vehicle market has also been influenced by disruptions in global supply chains, which have impacted production timelines and material availability. These challenges have encouraged manufacturers to focus more on localized sourcing and supply chain resilience. The transition toward regional manufacturing ecosystems is expected to strengthen long-term stability and reduce dependency on external supply networks.
The SUV segment accounted for 55% share in 2025 and is projected to grow at a CAGR of 9.8% from 2026 to 2035. This segment continues to gain traction due to strong consumer preference and favorable profit margins for manufacturers. Automakers are prioritizing the development of electric SUVs to align with evolving demand patterns and maximize revenue potential, further reinforcing segment growth.
The personal use segment held an 82% share in 2025 and is expected to grow at a CAGR of 10.7% between 2026 and 2035. Increasing affordability, wider model availability, and supportive policy measures are driving adoption among individual consumers. Lower operating costs, reduced environmental impact, and ongoing improvements in charging infrastructure are key factors influencing purchasing decisions, contributing to sustained growth in this segment.
China Passenger Electric Vehicle Market reached USD 284.9 billion in 2025, maintaining a strong position in the global landscape. The country's leadership is supported by its extensive manufacturing capabilities, large domestic demand base, and strategic expansion into international markets. Continuous investments in production capacity and technological innovation are further strengthening its role in shaping the global electric vehicle industry.
Key players operating in the Global Passenger Electric Vehicle Market include Tesla, BYD, Volkswagen, General Motors, Ford, Hyundai, BMW, Mercedes-Benz, SAIC Motor, and Geely. Companies in the Passenger Electric Vehicle Market are reinforcing their competitive position through large-scale investments in research and development, particularly in battery innovation and software integration. They are focusing on expanding electric vehicle portfolios across multiple segments to address diverse consumer needs. Strategic partnerships are being formed to secure battery supply chains and accelerate technological advancements. Manufacturers are also enhancing production capabilities through localized manufacturing to improve efficiency and reduce costs. In addition, companies are strengthening charging infrastructure collaborations and digital ecosystems to improve user experience. Branding strategies emphasize sustainability, performance, and innovation, helping companies attract environmentally conscious consumers while maintaining long-term market relevance.
Table of Contents
Chapter 1 Methodology & Scope
- 1.1 Research approach
- 1.2 Quality Commitments
- 1.2.1 GMI AI policy & data integrity commitment
- 1.2.1.1 Source consistency protocol
- 1.2.1 GMI AI policy & data integrity commitment
- 1.3 Research Trail & Confidence Scoring
- 1.3.1 Research Trail Components
- 1.3.2 Scoring Components
- 1.4 Data Collection
- 1.4.1 Partial list of primary sources
- 1.5 Data mining sources
- 1.5.1 Paid sources
- 1.5.1.1 Sources, by region
- 1.5.1 Paid sources
- 1.6 Base estimates and calculations
- 1.6.1 Base year calculation for any one approach
- 1.7 Forecast
- 1.7.1 Quantified market impact analysis
- 1.7.1.1 Mathematical impact of growth parameters on forecast
- 1.7.1 Quantified market impact analysis
- 1.8 Research transparency addendum
- 1.8.1 Source attribution framework
- 1.8.2 Quality assurance metrics
- 1.8.3 Our commitment to trust
Chapter 2 Executive Summary
- 2.1 Industry 360° synopsis
- 2.2 Key market trends
- 2.2.1 Regional
- 2.2.2 Drive
- 2.2.3 Propulsion
- 2.2.4 Vehicle
- 2.2.5 Application
- 2.2.6 Price
- 2.3 TAM Analysis, 2026-2035
- 2.4 CXO perspectives: Strategic imperatives
Chapter 3 Industry Insights
- 3.1 Industry ecosystem analysis
- 3.1.1 Supplier landscape
- 3.1.1.1 Battery Manufacturer
- 3.1.1.2 Component Supplier
- 3.1.1.3 OEM (Original Equipment Manufacturer)
- 3.1.1.4 Distributor / Dealer
- 3.1.1.5 Battery Manufacturer
- 3.1.1.6 End user
- 3.1.2 Cost structure
- 3.1.3 Profit margin
- 3.1.4 Value addition at each stage
- 3.1.5 Vertical integration trends
- 3.1.6 Disruptors
- 3.1.1 Supplier landscape
- 3.2 Impact on forces
- 3.2.1 Growth drivers
- 3.2.1.1 Strong government incentives, subsidies, and emission regulations
- 3.2.1.2 Continuous decline in battery costs improving EV affordability
- 3.2.1.3 Rapid expansion of public and private charging infrastructure
- 3.2.1.4 Rising environmental awareness and sustainability commitments
- 3.2.2 Industry pitfalls & challenges
- 3.2.2.1 High upfront purchase cost of electric vehicles
- 3.2.2.2 Underdeveloped charging infrastructure in several regions
- 3.2.3 Market opportunities
- 3.2.3.1 Significant untapped growth potential in emerging markets
- 3.2.3.2 Advancements in battery technology and fast charging solutions
- 3.2.1 Growth drivers
- 3.3 Technology trends & innovation ecosystem
- 3.3.1 Current technologies
- 3.3.2 Emerging technologies
- 3.4 Growth potential analysis
- 3.5 Regulatory landscape
- 3.5.1 North America
- 3.5.1.1 Inflation Reduction Act
- 3.5.1.2 Clean Air Act
- 3.5.2 Europe
- 3.5.2.1 European Green Deal
- 3.5.2.2 Euro 7 Emission Standards
- 3.5.3 Asia-Pacific
- 3.5.3.1 New Energy Vehicle (NEV) Credit Policy
- 3.5.3.2 Automotive Industry Standard (AIS) 156
- 3.5.4 Latin America
- 3.5.4.1 Programa Rota 2030
- 3.5.4.2 Mexican NOM Emissions Standards
- 3.5.5 Middle East & Africa
- 3.5.5.1 UAE Net Zero 2050 Strategy
- 3.5.5.2 South Africa Green Transport Strategy
- 3.5.1 North America
- 3.6 Porter's analysis
- 3.7 PESTEL analysis
- 3.8 Patent analysis (Driven by Primary Research)
- 3.9 Pricing Analysis (Driven by Primary Research)
- 3.9.1 Historical Price Trend Analysis
- 3.9.2 Pricing Strategy by Player Type
- 3.10 Capacity & Production Landscape (Driven by Primary Research)
- 3.10.1 Installed Capacity by Region & Key Producer
- 3.10.2 Capacity Utilization Rates & Expansion Pipelines
- 3.11 Trade Data Analysis (Driven by Primary Research)
- 3.11.1 Import/Export Volume & Value Trends
- 3.11.2 Key Trade Corridors & Tariff Impact
- 3.12 Sustainability and environmental aspects
- 3.12.1 Sustainable practices
- 3.12.2 Waste reduction strategies
- 3.12.3 Energy efficiency in production
- 3.12.4 Eco-friendly initiatives
- 3.12.5 Carbon footprint considerations
- 3.13 Impact of AI & generative AI on the market
- 3.13.1 AI-driven disruption of existing business models
- 3.13.2 GenAI use cases & adoption roadmap by segment
- 3.13.3 Risks, limitations & regulatory considerations
- 3.14 Forecast assumptions & scenario analysis (Driven by Primary Research)
- 3.14.1 Base Case - key macro & industry variables driving CAGR
- 3.14.2 Optimistic Scenarios - Favorable Macro and Industry Tailwinds
- 3.14.3 Pessimistic Scenario - Macroeconomic slowdown or industry headwinds
Chapter 4 Competitive Landscape, 2025
- 4.1 Introduction
- 4.2 Company market share analysis
- 4.2.1 North America
- 4.2.2 Europe
- 4.2.3 Asia Pacific
- 4.2.4 Latin America
- 4.2.5 MEA
- 4.3 Competitive analysis of major market players
- 4.4 Competitive positioning matrix
- 4.5 Company Tier Benchmarking
- 4.5.1 Tier Classification Criteria & Qualifying Thresholds
- 4.5.2 Tier Positioning Matrix by Revenue, Geography & Innovation
- 4.6 Key developments
- 4.6.1 Mergers & acquisitions
- 4.6.2 Partnerships & collaborations
- 4.6.3 New product launches
- 4.6.4 Expansion plans and funding
Chapter 5 Market Estimates & Forecast, By Vehicle, 2022 - 2035 ($ Bn, Units)
- 5.1 Key trends
- 5.2 Hatchback
- 5.3 Sedan
- 5.4 SUV
- 5.5 Others
Chapter 6 Market Estimates & Forecast, By Drive , 2022 - 2035 ($ Bn, Units)
- 6.1 Key trends
- 6.2 Front-wheel drive
- 6.3 Rear-wheel drive
- 6.4 All-wheel drive
Chapter 7 Market Estimates & Forecast, By Propulsion, 2022 - 2035 ($ Bn, Units)
- 7.1 Key trends
- 7.2 Battery Electric Vehicle (BEV)
- 7.3 Fuel Cell Electric Vehicle (FCEV)
- 7.4 Plug-in Hybrid Electric Vehicle (PHEV)
Chapter 8 Market Estimates & Forecast, By Application, 2022 - 2035 ($ Bn, Units)
- 8.1 Key trends
- 8.2 Personal
- 8.3 Commercial
Chapter 9 Market Estimates & Forecast By Price, 2022 - 2035 ($ Bn, Units)
- 9.1 Key trends
- 9.2 Entry
- 9.3 Mid-Range
- 9.4 Luxury
Chapter 10 Market Estimates & Forecast, By Region, 2022 - 2035 ($ Bn, Units)
- 10.1 Key trends
- 10.2 North America
- 10.2.1 US
- 10.2.2 Canada
- 10.3 Europe
- 10.3.1 UK
- 10.3.2 Germany
- 10.3.3 France
- 10.3.4 Italy
- 10.3.5 Spain
- 10.3.6 Belgium
- 10.3.7 Netherlands
- 10.3.8 Sweden
- 10.3.9 Russia
- 10.4 Asia Pacific
- 10.4.1 China
- 10.4.2 India
- 10.4.3 Japan
- 10.4.4 Australia
- 10.4.5 Singapore
- 10.4.6 South Korea
- 10.4.7 Vietnam
- 10.4.8 Indonesia
- 10.5 Latin America
- 10.5.1 Brazil
- 10.5.2 Mexico
- 10.5.3 Argentina
- 10.6 MEA
- 10.6.1 South Africa
- 10.6.2 Saudi Arabia
- 10.6.3 UAE
Chapter 11 Company Profiles
- 11.1 Global players
- 11.1.1 Audi
- 11.1.2 BMW
- 11.1.3 Ford
- 11.1.4 General Motors
- 11.1.5 Hyundai
- 11.1.6 Kia
- 11.1.7 Mercedes-Benz
- 11.1.8 Nissan
- 11.1.9 Renault
- 11.1.10 Tesla
- 11.1.11 Toyota
- 11.1.12 Volkswagen
- 11.2 Regional players
- 11.2.1 BYD
- 11.2.2 Chery
- 11.2.3 Geely
- 11.2.4 JAC Motors
- 11.2.5 SAIC Motor
- 11.3 Emerging players
- 11.3.1 Chery Automobile
- 11.3.2 Great Wall Motors
- 11.3.3 Quantum Motors

 電動車性能指標市場:預測(至2034年)-按車輛類型、驅動系統、性能指標、最終用戶和地區分類的全球分析
 高性能電動車市場:按車輛類型、電池容量、動力傳動系統和最終用戶分類-2026-2032年全球市場預測小型電動車市場:按車輛類型、動力系統、電池容量、最終用戶和銷售管道分類-2026-2032年全球市場預測電動車市場:2026-2032年全球市場預測(按車輛類型、驅動系統、零件、電池技術、電池容量、續航里程、最終用戶和銷售管道)
 電動車市場規模、佔有率、趨勢和預測:按組件、充電方式、驅動系統、車輛類型和地區分類,2026-2034 年
 電動車市場(至2035年):產業趨勢與全球預測
 2026年全球小型電動車市場報告2026年全球搭乘用電動車市場報告2026年全球電動車市場報告2026年全球電動車虛擬原型製作市場報告