

 |
市場調查報告書
商品編碼
2038270
量子點顯示市場機會、成長要素、產業趨勢分析及2026-2035年預測。Quantum Dot Display Market Opportunity, Growth Drivers, Industry Trend Analysis, and Forecast 2026 - 2035 |
||||||

全球量子點顯示器市場預計到 2025 年將達到 17 億美元,並將以 13.3% 的複合年成長率成長,到 2035 年達到 59 億美元。
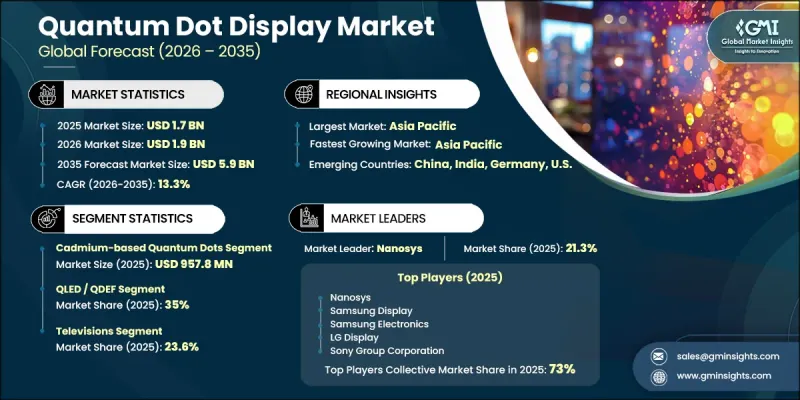
量子點顯示器產業的成長主要得益於消費者對更高品質顯示器和更佳觀看體驗日益成長的需求。製造商正加速將量子點材料整合到各種設備中,以提高效率和整體性能。顯示架構的持續創新和高解析度內容的日益普及進一步推動了市場擴張。此外,下一代顯示格式的演進以及娛樂和商用應用領域需求的成長,正在加速向量子點技術的轉型,使量子點顯示市場走上長期永續成長的道路。
| 市場範圍 | |
|---|---|
| 開始年份 | 2025 |
| 預測期 | 2026-2035 |
| 上市時的市場規模 | 17億美元 |
| 預計金額 | 59億美元 |
| 複合年成長率 | 13.3% |
量子點顯示市場也受益於互聯和智慧技術的日益普及,這推動了對高品質顯示解決方案的需求。消費者對更佳視覺性能的日益成長的期望,促使製造商提高產能並推進顯示技術的發展。對更高亮度、對比和色彩準確度的日益重視,進一步加速了量子點解決方案在全球消費性電子市場的應用。
預計到2025年,鎘基量子點市場規模將達到9.578億美元。該細分市場憑藉其卓越的性能特性,例如高亮度、精準的色彩還原,持續佔據市場主導地位。其強大的大規模生產能力和可靠的效率使其成為先進顯示器生產的首選,鞏固了其市場主導地位。
受高階顯示器設備廣泛應用的推動,QLED/QDEF 細分市場預計到 2025 年將佔據 35% 的市場佔有率。這些技術之所以被廣泛採用,是因為它們能夠實現更高的擴充性、更廣的色域和更高的能源效率。此外,它們與現有生產基礎設施的兼容性使其能夠以經濟高效的方式進行規模化生產,從而確保各類設備持續的需求。
預計到2025年,北美量子點顯示器市場佔有率將達到28.5%,這主要得益於對高性能顯示設備的強勁需求以及先進技術的快速普及。該地區對高階視覺體驗日益成長的興趣正促使製造商採用更先進的顯示解決方案。持續加大研發投入和產能提升也將進一步推動北美市場的成長。
目錄
第1章:調查方法和範圍
第2章執行摘要
第3章業界考察
- 生態系分析
- 供應商情況
- 利潤率
- 成本結構
- 每個階段增加的價值
- 影響價值鏈的因素
- 中斷
- 影響產業的因素
- 促進因素
- 人們對更鮮豔的色彩和更明亮的螢幕的需求日益成長。
- 量子點在家用電子電器的應用日益廣泛
- 提高下一代顯示架構的效率
- 開發下一代顯示技術,例如 QD-OLED 和 QD-miniLED
- 遊戲、內容創作和專業應用領域對高品質顯示器的需求不斷成長。
- 產業潛在風險與挑戰
- 量子點顯示器的材料成本和製造成本都很高
- 對數量有限的量子點材料供應商的依賴
- 市場機遇
- 量子點材料在汽車和工業顯示器領域的興起
- 量子點在擴增實境/虛擬實境和穿戴式顯示器中的應用日益廣泛
- 促進因素
- 成長潛力分析
- 監理情勢
- 北美洲
- 歐洲
- 亞太地區
- 拉丁美洲
- 中東和非洲
- 波特五力分析
- PESTEL 分析
- 科技與創新趨勢
- 當前技術趨勢
- 新興技術
- 價格趨勢
- 按地區
- 依產品
- 定價策略
- 新興經營模式
- 合規要求
- 專利和智慧財產權分析
第4章 競爭情勢
- 介紹
- 企業市佔率分析
- 按地區
- 北美洲
- 歐洲
- 亞太地區
- 拉丁美洲
- 中東和非洲
- 市場集中度分析
- 按地區
- 主要公司的競爭標竿分析
- 財務績效比較
- 銷售量
- 利潤率
- 研究與開發
- 產品系列比較
- 產品線寬度
- 科技
- 創新
- 區域擴張比較
- 全球擴張分析
- 服務網路覆蓋
- 按地區分類的市場滲透率
- 競爭定位矩陣
- 領導者
- 挑戰者
- 追蹤者
- 小眾玩家
- 戰略展望矩陣
- 財務績效比較
- 主要進展
- 併購
- 夥伴關係和聯盟
- 技術進步
- 業務拓展與投資策略
- 數位轉型計劃
- 新興/新創競爭對手的發展趨勢
第5章 市場估算與預測:依顯示技術架構分類,2022-2035年
- QLED/QDEF
- 側光式量子點
- 直射光型 QDEF
- 片上量子點解決方案
- QD-OLED
- RGB QD-OLED
- 混合量子點-OLED結構
- QDEL/QD-LED
- 直視式 QDEL 顯示器
- QDEL面板整合技術
- QD-microLED
- 顏色轉換層的整合
- 混合型微型LED-QD架構
- 其他
第6章 市場估算與預測:依量子點材料類型分類,2022-2035年
- 鎘基量子點
- 硒化鎘 (CdSe)
- 硫化鎘 (CdS)
- 其他鎘基配方
- 無鎘量子點
- 磷酸銦 (InP)
- 鈣鈦礦量子點
- 碳基量子點
- ZnSe 和 ZnTeSe 量子點
- 其他新興的無鎘材料
第7章 市場估計與預測:依應用領域分類,2022-2035年
- 電視機
- 資訊科技和電腦顯示器
- 智慧型手機
- 汽車顯示器
- 商業指示牌和數位顯示螢幕
- 醫療展示
- 工業的
- 其他
第8章 市場估計與預測:依地區分類,2022-2035年
- 北美洲
- 美國
- 加拿大
- 歐洲
- 德國
- 英國
- 法國
- 西班牙
- 義大利
- 俄羅斯
- 亞太地區
- 中國
- 印度
- 日本
- 澳洲
- 韓國
- 拉丁美洲
- 巴西
- 墨西哥
- 阿根廷
- 中東和非洲
- 南非
- 沙烏地阿拉伯
- 阿拉伯聯合大公國
第9章:公司簡介
- 全球主要公司
- Nanosys
- Samsung Display
- Samsung Electronics
- LG Display
- Sony Group Corporation
- 按地區分類的主要公司
- 北美洲
- Quantum Materials Corp.
- 亞太地區
- TCL Technology
- Hisense
- BOE Technology Group
- 歐洲
- Nanoco Group plc
- Merck KGaA
- OSRAM Opto Semiconductors
- Avantama AG
- 北美洲
- 特殊玩家/干擾者
- UbiQD
- Ocean NanoTech
The Global Quantum Dot Display Market was valued at USD 1.7 billion in 2025 and is estimated to grow at a CAGR of 13.3% to reach USD 5.9 billion by 2035.
Growth in the quantum dot display industry is driven by increasing consumer preference for advanced display quality and enhanced viewing experiences. Manufacturers are accelerating the integration of quantum dot materials into a wide range of devices to improve efficiency and overall performance. Continuous innovation in display architectures and the rising adoption of high-resolution content are further strengthening market expansion. In addition, the evolution of next-generation display formats and increasing demand across entertainment and professional applications are reinforcing the transition toward quantum dot-enabled technologies, positioning the quantum dot display market for sustained long-term growth.
| Market Scope | |
|---|---|
| Start Year | 2025 |
| Forecast Year | 2026-2035 |
| Start Value | $1.7 Billion |
| Forecast Value | $5.9 Billion |
| CAGR | 13.3% |
The quantum dot display market is also benefiting from the expanding adoption of connected and smart technologies, which is increasing demand for high-quality display solutions. Rising consumer expectations for enhanced visual performance are encouraging manufacturers to advance production capabilities and improve display technologies. The growing emphasis on delivering better brightness, contrast, and color accuracy is further accelerating the adoption of quantum dot-based solutions across global consumer electronics markets.
The cadmium-based quantum dots segment reached USD 957.8 million in 2025. This segment continues to dominate due to its strong performance characteristics, including high brightness and precise color output. Its established presence in large-scale manufacturing and reliable efficiency make it a preferred choice for advanced display production, supporting its leading market position.
The QLED/QDEF segment accounted for 35% share in 2025, driven by its broad adoption in premium display devices. These technologies are widely utilized due to their ability to deliver high brightness, a wide color range, and improved energy efficiency. Their compatibility with existing production infrastructure also enables cost-effective scalability, ensuring continued demand across various device categories.
North America Quantum Dot Display Market held a 28.5% share in 2025, supported by strong demand for high-performance display devices and rapid adoption of advanced technologies. The region is witnessing increasing interest in premium visual experiences, which is encouraging manufacturers to introduce more advanced display solutions. Continued investments in research, development, and production capabilities are further strengthening market growth across North America.
Key players operating in the Global Quantum Dot Display Market include Samsung Electronics, LG Display, Sony Group Corporation, TCL Technology, Hisense, BOE Technology Group, Nanosys, Nanoco Group plc, Merck KGaA, OSRAM Opto Semiconductors, Avantama AG, UbiQD, Quantum Materials Corp., Ocean NanoTech, and Samsung Display. Companies in the Quantum Dot Display Market are focusing on innovation, partnerships, and capacity expansion to strengthen their competitive position. They are investing in advanced material development and next-generation display technologies to improve efficiency, brightness, and color performance. Strategic collaborations with device manufacturers are helping companies integrate quantum dot solutions into a broader range of products. Many players are also expanding production capabilities to meet rising global demand. Additionally, continuous research and development efforts aimed at improving sustainability and reducing production costs are enabling companies to enhance product offerings, differentiate themselves in the market, and maintain long-term growth.
Table of Contents
Chapter 1 Methodology and Scope
- 1.1 Market scope and definition
- 1.2 Research design
- 1.2.1 Research approach
- 1.2.2 Data collection methods
- 1.3 Data mining sources
- 1.3.1 Global
- 1.3.2 Regional/Country
- 1.4 Base estimates and calculations
- 1.4.1 Base year calculation
- 1.4.2 Key trends for market estimation
- 1.5 Primary research and validation
- 1.5.1 Primary sources
- 1.6 Forecast model
- 1.7 Research assumptions and limitations
Chapter 2 Executive Summary
- 2.1 Industry 360° synopsis, 2022 - 2035
- 2.2 Key market trends
- 2.2.1 Display technology architecture trends
- 2.2.2 Quantum dot material type trends
- 2.2.3 Application trends
- 2.2.4 Regional trends
- 2.3 TAM Analysis, 2026-2035
- 2.4 CXO perspectives: Strategic imperatives
Chapter 3 Industry Insights
- 3.1 Industry ecosystem analysis
- 3.1.1 Supplier Landscape
- 3.1.2 Profit Margin
- 3.1.3 Cost structure
- 3.1.4 Value addition at each stage
- 3.1.5 Factor affecting the value chain
- 3.1.6 Disruptions
- 3.2 Industry impact forces
- 3.2.1 Growth drivers
- 3.2.1.1 Growing demand for better color and brighter screens
- 3.2.1.2 Expanding use of quantum dots in consumer electronics
- 3.2.1.3 Improved efficiency in next-generation display architectures
- 3.2.1.4 Development of next-generation display technologies like QD-OLED and QD-miniLED
- 3.2.1.5 Rising need for high-quality displays in gaming, content creation, and professional use
- 3.2.2 Industry pitfalls and challenges
- 3.2.2.1 High material and production cost of quantum dot displays
- 3.2.2.2 Dependence on limited quantum dot material suppliers
- 3.2.3 Market opportunities
- 3.2.3.1 Emergence of quantum-dot materials in automotive and industrial displays
- 3.2.3.2 Growth of quantum-dot applications in AR/VR and wearable displays
- 3.2.1 Growth drivers
- 3.3 Growth potential analysis
- 3.4 Regulatory landscape
- 3.4.1 North America
- 3.4.2 Europe
- 3.4.3 Asia Pacific
- 3.4.4 Latin America
- 3.4.5 Middle East & Africa
- 3.5 Porter's analysis
- 3.6 PESTEL analysis
- 3.7 Technology and Innovation landscape
- 3.7.1 Current technological trends
- 3.7.2 Emerging technologies
- 3.8 Price trends
- 3.8.1 By region
- 3.8.2 By product
- 3.9 Pricing Strategies
- 3.10 Emerging Business Models
- 3.11 Compliance Requirements
- 3.12 Patent and IP analysis
Chapter 4 Competitive Landscape, 2025
- 4.1 Introduction
- 4.2 Company market share analysis
- 4.2.1 By region
- 4.2.1.1 North America
- 4.2.1.2 Europe
- 4.2.1.3 Asia Pacific
- 4.2.1.4 Latin America
- 4.2.1.5 Middle East & Africa
- 4.2.2 Market concentration analysis
- 4.2.1 By region
- 4.3 Competitive benchmarking of key players
- 4.3.1 Financial performance comparison
- 4.3.1.1 Revenue
- 4.3.1.2 Profit margin
- 4.3.1.3 R&D
- 4.3.2 Product portfolio comparison
- 4.3.2.1 Product range breadth
- 4.3.2.2 Technology
- 4.3.2.3 Innovation
- 4.3.3 Geographic presence comparison
- 4.3.3.1 Global footprint analysis
- 4.3.3.2 Service network coverage
- 4.3.3.3 Market penetration by region
- 4.3.4 Competitive positioning matrix
- 4.3.4.1 Leaders
- 4.3.4.2 Challengers
- 4.3.4.3 Followers
- 4.3.4.4 Niche players
- 4.3.5 Strategic outlook matrix
- 4.3.1 Financial performance comparison
- 4.4 Key developments
- 4.4.1 Mergers and acquisitions
- 4.4.2 Partnerships and collaborations
- 4.4.3 Technological advancements
- 4.4.4 Expansion and investment strategies
- 4.4.5 Digital transformation initiatives
- 4.5 Emerging/ startup competitors landscape
Chapter 5 Market Estimates and Forecast, By Display Technology Architecture, 2022 - 2035 (USD Million)
- 5.1 Key trends
- 5.2 QLED / QDEF
- 5.2.1 Edge-lit QDEF
- 5.2.2 Direct-lit QDEF
- 5.2.3 On-chip quantum dot solutions
- 5.3 QD-OLED
- 5.3.1 RGB QD-OLED
- 5.3.2 Hybrid QD-OLED configurations
- 5.4 QDEL / QD-LED
- 5.4.1 Direct-view QDEL displays
- 5.4.2 QDEL panel integration technologies
- 5.5 QD-microLED
- 5.5.1 Color conversion layer integration
- 5.5.2 Hybrid microLED-QD architectures
- 5.5.3 Others
Chapter 6 Market Estimates and Forecast, By Quantum Dot Material Type, 2022 - 2035 (USD Million)
- 6.1 Key trends
- 6.2 Cadmium-based quantum dots
- 6.2.1 CdSe (cadmium selenide)
- 6.2.2 CdS (cadmium sulfide)
- 6.2.3 Other cadmium-based formulations
- 6.3 Cadmium-free quantum dots
- 6.3.1 InP (Indium Phosphide)
- 6.3.2 Perovskite quantum dots
- 6.3.3 Carbon-based quantum dots
- 6.3.4 ZnSe & ZnTeSe quantum dots
- 6.3.5 Other emerging cadmium-free materials
Chapter 7 Market Estimates and Forecast, By Application, 2022 - 2035 (USD Million)
- 7.1 Key trends
- 7.2 Televisions
- 7.3 IT & Computing Displays
- 7.4 Smartphones
- 7.5 Automotive Displays
- 7.6 Commercial Signage & Digital Displays
- 7.7 Medical Displays
- 7.8 Industrial
- 7.9 Others
Chapter 8 Market Estimates and Forecast, By Region, 2022 - 2035 (USD Million)
- 8.1 Key trends
- 8.2 North America
- 8.2.1 U.S.
- 8.2.2 Canada
- 8.3 Europe
- 8.3.1 Germany
- 8.3.2 UK
- 8.3.3 France
- 8.3.4 Spain
- 8.3.5 Italy
- 8.3.6 Russia
- 8.4 Asia Pacific
- 8.4.1 China
- 8.4.2 India
- 8.4.3 Japan
- 8.4.4 Australia
- 8.4.5 South Korea
- 8.5 Latin America
- 8.5.1 Brazil
- 8.5.2 Mexico
- 8.5.3 Argentina
- 8.6 Middle East and Africa
- 8.6.1 South Africa
- 8.6.2 Saudi Arabia
- 8.6.3 UAE
Chapter 9 Company Profiles
- 9.1 Global Key Players
- 9.1.1 Nanosys
- 9.1.2 Samsung Display
- 9.1.3 Samsung Electronics
- 9.1.4 LG Display
- 9.1.5 Sony Group Corporation
- 9.2 Regional key players
- 9.2.1 North America
- 9.2.1.1 Quantum Materials Corp.
- 9.2.2 Asia Pacific
- 9.2.2.1 TCL Technology
- 9.2.2.2 Hisense
- 9.2.2.3 BOE Technology Group
- 9.2.3 Europe
- 9.2.3.1 Nanoco Group plc
- 9.2.3.2 Merck KGaA
- 9.2.3.3 OSRAM Opto Semiconductors
- 9.2.3.4 Avantama AG
- 9.2.1 North America
- 9.3 Niche Players/Disruptors
- 9.3.1 UbiQD
- 9.3.2 Ocean NanoTech

 全球量子點顯示器市場預測至2034年:依產品類型、組件、材料、應用、最終用戶和地區分類
 全球QD-OLED顯示器市場:市場規模、佔有率和趨勢分析(按產品類型、面板尺寸、技術、應用和地區分類),細分市場預測(2026-2033年)
 2026年量子點(QD)顯示器全球市場報告
 量子點顯示器市場:按組件、材料、應用、國家和地區分類-全球產業分析、市場規模、市場佔有率及2025-2032年預測
 量子點顯示市場-全球產業規模、佔有率、趨勢、機會及預測,依產品類型(QLED電視、QLED顯示器及其他)、材料類型、終端用戶產業、地區及競爭格局分類,2020-2030年預測量子點顯示器市場報告:趨勢、預測與競爭分析(至2031年)
 量子點顯示器(QLED):全球市場佔有率和排名、總收入和需求預測(2025-2031 年)
 量子點顯示器的全球市場 - 市場規模,佔有率,趨勢,產業分析:各零件,各材料,各用途,各地區 - 市場預測(2025年~2034年)
 量子點顯示全球市場規模、佔有率、趨勢分析:按材料、組件、應用、地區、展望和預測,2024-2031