

 |
市場調查報告書
商品編碼
2027637
智慧家庭產品市場:商機、成長要素、產業趨勢分析及2026-2035年預測Smart Home Products Market Opportunity, Growth Drivers, Industry Trend Analysis, and Forecast 2026 - 2035 |
||||||
全球智慧家庭產品市場預計到 2025 年將達到 1,690 億美元,並預計以 8.5% 的複合年成長率成長,到 2035 年達到 3,850 億美元。
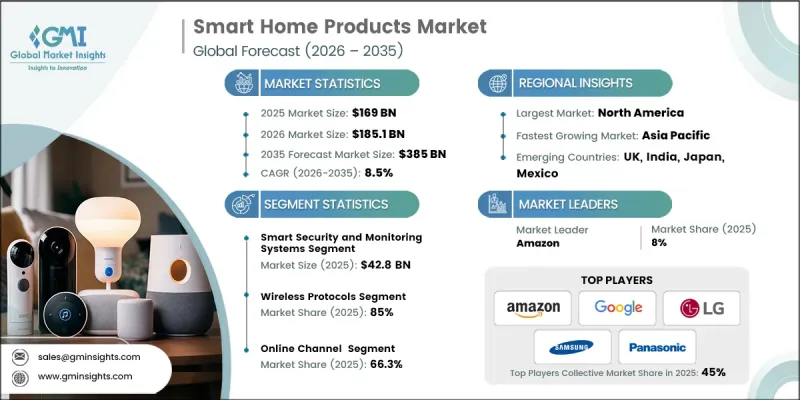
隨著消費者越來越重視節能、連網和自動化家居解決方案,市場呈現強勁的成長動能。可再生能源與智慧家庭系統的整合正成為推動市場發展的主要動力,不僅能夠實現永續生活,還能減少對傳統能源的依賴。語音辨識、人工智慧和智慧型設備互通性的創新正在改變住宅與生活空間的互動方式,帶來便利、安全和能源最佳化。人們對綠建築標準和智慧型能源管理的日益關注也進一步促進了智慧家庭的普及。如今,智慧家庭技術涵蓋了安防、照明、暖通空調和健康管理等各個領域的設備,所有這些設備都透過一個直覺的平台連接起來,提供無縫的控制、監控和預測功能。便利性、永續性和先進技術的融合,正使智慧家庭產品成為全球現代住宅的核心組成部分。
| 市場範圍 | |
|---|---|
| 開始年份 | 2025 |
| 預測期 | 2026-2035 |
| 上市時的市場規模 | 1690億美元 |
| 預測金額 | 3850億美元 |
| 複合年成長率 | 8.5% |
智慧安防監控系統目前佔據25.3%的市場佔有率,預計到2025年市場規模將達到428億美元。由於安全問題日益突出以及物聯網設備的普及,這些解決方案的需求量很大。住宅可以利用即時警報、雲端影片儲存和遠端監控功能,實現主動式安全管理。
無線協議領域佔據85%的市場佔有率,預計2025年市場規模將達到1,436億美元。 Wi-Fi、Zigbee和Z-Wave等通用物聯網標準因其柔軟性和易用性,對智慧家庭整合至關重要。行動和雲端應用的發展進一步推動了無線技術的普及,使消費者能夠遠端控制照明、安防系統和家用電器,同時提高能源效率。無線解決方案還支援輕鬆升級和互通性,滿足了現代消費者對便利性和效率的需求。
美國智慧家居產品市場佔84%的市場佔有率,預計到2025年市場規模將達到585億美元。這一強勁的市場地位得益於較高的可支配收入、不斷變化的消費者偏好以及領先技術創新者的存在。亞馬遜、Google和Ecobee等美國領導企業憑藉其豐富的產品系列、技術進步以及為連網家庭制定全球標準,持續推動著產業發展。這些企業的領導地位確保了市場的強勁成長,並進一步推動了節能智慧家庭解決方案的普及。
目錄
第1章:調查方法和範圍
第2章執行摘要
第3章業界考察
- 生態系分析
- 供應商情況
- 利潤率
- 每個階段增加的價值
- 影響價值鏈的因素
- 影響產業的因素
- 促進因素
- 節能的需求日益成長
- 物聯網和無線連接的擴展
- 安全問題
- 產業潛在風險與挑戰
- 資料隱私與網路安全風險
- 前期成本高且生態系分散。
- 機會
- 新興市場的成長
- 與健康和醫療保健的融合
- 促進因素
- 成長潛力分析
- 未來市場趨勢
- 科技與創新趨勢
- 當前技術趨勢
- 新興技術
- 價格分析(基於初步調查)
- 對過去價格趨勢的分析(基於初步研究)
- 根據業務類型分類的定價策略(高階/價值/成本加成)(基於初步調查)
- 按產品類型的價格彈性
- 區域價格波動與購買力平價
- 監理情勢
- 標準和合規要求
- 區域法規結構
- 認證標準
- 波特五力分析
- PESTEL 分析
- 消費行為分析
- 購買模式
- 偏好分析
- 不同地區的消費行為差異
- 電子商務對購買決策的影響
- 交易數據分析(基於付費資料庫)
- 進出口數量和價值的變化趨勢
- 主要貿易走廊及關稅的影響
- 貿易政策對市場動態的影響
- 人工智慧和生成式人工智慧對市場的影響
- 利用人工智慧改造現有經營模式
- 針對特定領域的生成式人工智慧應用案例和實施藍圖
- 風險、限制和監管考量
- 人工智慧驅動的個人化和預測自動化
- 分銷基礎設施和通路滲透狀況(基於初步調查)
- 按地區和類型分類的通路網路(現代分銷與傳統分銷)(基於初步調查)
- 最後一公里基礎設施缺口和新興管道變化(基於初步研究)
- 電子商務平台的集中度與市場主導地位
第4章 競爭情勢
- 介紹
- 企業市佔率分析
- 按地區
- 企業矩陣分析
- 主要市場公司的競爭分析
- 競爭定位矩陣
- 主要進展
- 併購
- 夥伴關係與合作
- 新產品發布
- 業務拓展計劃
第5章 市場估算與預測:依產品類型分類,2022-2035年
- 智慧安防監控系統
- 監視器
- 嬰兒監視器
- 智慧門鎖
- 其他(智慧型煙霧偵測器等)
- 智慧照明和電氣系統
- 智慧燈泡
- 智慧照明開關
- 智慧照明設備
- 其他(例如,智慧配電盤)
- 智慧空調/暖通空調系統
- 智慧型恆溫器
- 智慧型空調控制器
- 智慧型空氣清淨機
- 智慧加濕器和除濕器
- 其他(例如,智慧空氣品質監測器)
- 智慧娛樂媒體系統
- 智慧音箱
- 智慧型串流媒體設備
- 智慧投影儀
- 智慧型遊戲機
- 其他(例如,智慧VR/AR系統)
- 智慧廚房和家電系統
- 智慧冷藏庫
- 智慧烤箱系列
- 智慧洗碗機
- 智慧咖啡機
- 其他(例如智慧攪拌機)
- 智慧洗衣清潔系統
- 智慧型洗衣機
- 智慧型烘乾機
- 智慧機器人吸塵器
- 其他(例如,智慧窗戶清潔器)
- 智慧戶外花園系統
- 智慧噴灌控制器
- 智慧滴灌
- 智慧割草機
- 其他(例如,智慧氣象觀測設備)
- 智慧健康與保健系統
- 智慧空氣品質監測器
- 智慧睡眠監測器
- 智慧藥品發放器
- 其他(例如,智慧跌倒偵測系統)
- 智慧型能源公用事業系統
- 智慧電錶
- 智慧太陽能發電系統
- 智慧電池儲存
- 其他(例如,智慧負載控制設備)
- 其他(智慧連接與控制系統等)
第6章 市場估算與預測:以連結方式分類,2022-2035年
- 無線協定
- ZigBee
- Wi-Fi
- Bluetooth
- Z-Wave
- 其他
- 有線協議
- 乙太網路
- 電力線路通訊(PLC)
- 混合
第7章 市場估計與預測:依價格分類,2022-2035年
- 低價位(500美元以下)
- 中價位(500美元至1000美元)
- 高價位(超過1000美元)
第8章 市場估算與預測:依安裝類型分類,2022-2035年
- 新建工程
- 維修
第9章 市場估價與預測:依通路分類,2022-2035年
- 線上
- 離線
第10章 市場估價與預測:依地區分類,2022-2035年
- 北美洲
- 美國
- 加拿大
- 歐洲
- 德國
- 英國
- 法國
- 西班牙
- 義大利
- 亞太地區
- 中國
- 日本
- 印度
- 澳洲
- 韓國
- 拉丁美洲
- 巴西
- 墨西哥
- 阿根廷
- 中東和非洲
- 南非
- 沙烏地阿拉伯
- 阿拉伯聯合大公國
第11章:公司簡介
- Amazon
- Apple
- Bosch
- Dyson
- Ecobee
- Honeywell
- LG
- Panasonic
- Ring
- Samsung
- Schneider Electric
- Siemens
- Sonos
- Xiaomi
The Global Smart Home Products Market was valued at USD 169 billion in 2025 and is estimated to grow at a CAGR of 8.5% to reach USD 385 billion by 2035.
The market is witnessing strong momentum as consumers increasingly prioritize energy-efficient, connected, and automated home solutions. The integration of renewable energy with smart home systems is emerging as a key driver, enabling sustainable living and reducing reliance on conventional power sources. Innovations in voice recognition, AI, and intelligent device interoperability are transforming how homeowners interact with their living spaces, creating convenience, safety, and energy optimization. Rising awareness of green building standards and smart energy management is further fueling adoption. Smart home technologies now encompass security, lighting, climate control, and health-focused devices, all connected through intuitive platforms that provide seamless control, monitoring, and predictive functionality. The combination of convenience, sustainability, and advanced technology is positioning smart home products as a core part of modern residences globally.
| Market Scope | |
|---|---|
| Start Year | 2025 |
| Forecast Year | 2026-2035 |
| Start Value | $169 Billion |
| Forecast Value | $385 Billion |
| CAGR | 8.5% |
The smart security and monitoring systems segment held a 25.3% share, generating USD 42.8 billion in 2025. These solutions are highly sought after due to growing safety concerns and the expanding adoption of connected IoT devices. Homeowners benefit from real-time alerts, cloud video storage, and remote monitoring capabilities, enabling proactive security management.
The wireless protocols segment held an 85% share, generating USD 143.6 billion in 2025. Popular IoT standards such as Wi-Fi, Zigbee, and Z-Wave have become integral to smart home integration due to their flexibility and ease of use. The development of mobile and cloud applications has further boosted wireless adoption, allowing consumers to control lighting, security systems, and appliances remotely while improving energy efficiency. Wireless solutions also support easy upgrades and interoperability, catering to modern consumer demands for convenience and efficiency.
U.S. Smart Home Products Market held an 84%, generating USD 58.5 billion in 2025. The strong market position is driven by high disposable incomes, evolving consumer preferences, and the presence of key technology innovators. Leading companies based in the U.S., including Amazon, Google, and Ecobee, continue to shape the industry through extensive product portfolios, technological advancements, and setting global standards for connected homes. Their leadership ensures robust market growth and drives further adoption of energy-efficient and smart home solutions.
Key players operating in the Global Smart Home Products Market include Apple, Amazon, Bosch, Dyson, Ecobee, Google, Honeywell, LG, Panasonic, Ring, Samsung, Schneider Electric, Siemens, Sonos, and Xiaomi. Companies in the Smart Home Products Market are strengthening their position through strategic innovation, expanding product portfolios, and investing in advanced technologies such as AI, voice control, and IoT integration. They are forming partnerships to enhance interoperability and cloud connectivity, allowing seamless integration of devices across ecosystems. Many firms are focusing on energy-efficient solutions to align with sustainability trends, while others are emphasizing premium offerings and user-friendly designs to appeal to high-end consumers. Strategic marketing, localized solutions, and investment in research and development are also being used to expand geographic reach and solidify brand credibility, ensuring long-term growth and competitive advantage in the rapidly evolving smart home market.
Table of Contents
Chapter 1 Methodology & Scope
- 1.1 Market scope and definition
- 1.2 Research design
- 1.2.1 Research approach
- 1.2.2 Data collection methods
- 1.3 Data mining sources
- 1.3.1 Global
- 1.3.2 Regional
- 1.4 Base estimates and calculations
- 1.4.1 Base year calculation
- 1.4.2 Key trends for market estimation
- 1.5 Primary research and validation
- 1.5.1 Primary sources
- 1.6 Forecast model
- 1.7 Research assumptions and limitations
Chapter 2 Executive Summary
- 2.1 Industry 360° synopsis
- 2.2 Key market trends
- 2.2.1 Regional
- 2.2.2 Product type
- 2.2.3 Connectivity
- 2.2.4 Price range
- 2.2.5 Installation
- 2.2.6 Distribution channel
Chapter 3 Industry Insights
- 3.1 Industry ecosystem analysis
- 3.1.1 Supplier landscape
- 3.1.2 Profit margin
- 3.1.3 Value addition at each stage
- 3.1.4 Factor affecting the value chain
- 3.2 Industry impact forces
- 3.2.1 Growth drivers
- 3.2.1.1 Rising demand for energy-efficiency
- 3.2.1.2 IoT and wireless connectivity expansion
- 3.2.1.3 Security and safety concerns
- 3.2.2 Industry pitfalls & challenges
- 3.2.2.1 Data privacy and cybersecurity risks
- 3.2.2.2 High initial costs and fragmented ecosystems
- 3.2.3 Opportunities
- 3.2.3.1 Growth in emerging markets
- 3.2.3.2 Integration with wellness and healthcare
- 3.2.1 Growth drivers
- 3.3 Growth potential analysis
- 3.4 Future market trends
- 3.5 Technology and innovation landscape
- 3.5.1 Current technological trends
- 3.5.2 Emerging technologies
- 3.6 Pricing analysis (driven by primary research)
- 3.6.1 Historical price trend analysis (driven by primary research)
- 3.6.2 Pricing strategy by player type (premium / value / cost-plus) (driven by primary research)
- 3.6.3 Price elasticity by product category
- 3.6.4 Regional price variations & purchasing power parity by region
- 3.7 Regulatory landscape
- 3.7.1 Standards and compliance requirements
- 3.7.2 Regional regulatory frameworks
- 3.7.3 Certification standards
- 3.8 Porter's analysis
- 3.9 PESTEL analysis
- 3.10 Consumer behaviour analysis
- 3.10.1 Purchasing patterns
- 3.10.2 Preference analysis
- 3.10.3 Regional variations in consumer behaviour
- 3.10.4 Impact of e-commerce on buying decision
- 3.11 Trade data analysis (driven by paid database)
- 3.11.1 Import/export volume & value trends
- 3.11.2 Key trade corridors & tariff impact
- 3.11.3 Trade policy impact on market dynamics
- 3.12 Impact of AI & generative AI on the market
- 3.12.1 AI-driven disruption of existing business models
- 3.12.2 GenAI use cases & adoption roadmap by segment
- 3.12.3 Risks, limitations & regulatory considerations
- 3.12.4 AI-powered personalization & predictive automation
- 3.13 Distribution infrastructure & channel penetration landscape (driven by primary research)
- 3.13.1 Channel coverage by region & format (modern vs. traditional trade) (driven by primary research)
- 3.13.2 Last-mile infrastructure gaps & emerging channel shifts (driven by primary research)
- 3.13.3 E-commerce platform concentration & market power
Chapter 4 Competitive Landscape, 2025
- 4.1 Introduction
- 4.2 Company market share analysis
- 4.2.1 By region
- 4.2.1.1 North America
- 4.2.1.2 Europe
- 4.2.1.3 Asia Pacific
- 4.2.1.4 Latin America
- 4.2.1.5 Middle East and Africa
- 4.2.1 By region
- 4.3 Company matrix analysis
- 4.4 Competitive analysis of major market players
- 4.5 Competitive positioning matrix
- 4.6 Key developments
- 4.6.1 Mergers & acquisitions
- 4.6.2 Partnerships & collaborations
- 4.6.3 New product launches
- 4.6.4 Expansion plans
Chapter 5 Market Estimates & Forecast, By Product type, 2022-2035 (USD Billion) (Million Units)
- 5.1 Key trends
- 5.2 Smart security & monitoring systems
- 5.2.1 Security cameras
- 5.2.2 Baby monitors
- 5.2.3 Smart door locks
- 5.2.4 Others (smart smoke detectors etc.)
- 5.3 Smart lighting & electrical systems
- 5.3.1 Smart light bulbs
- 5.3.2 Smart light switches
- 5.3.3 Smart light fixtures
- 5.3.4 Others (smart electrical panels etc.)
- 5.4 Smart climate control & HVAC systems
- 5.4.1 Smart thermostats
- 5.4.2 Smart HVAC controllers
- 5.4.3 Smart air purifiers
- 5.4.4 Smart humidifiers & dehumidifiers
- 5.4.5 Others (smart air quality monitors etc.)
- 5.5 Smart entertainment & media systems
- 5.5.1 Smart speakers
- 5.5.2 Smart streaming devices
- 5.5.3 Smart projectors
- 5.5.4 Smart gaming consoles
- 5.5.5 Others (smart VR/AR systems etc.)
- 5.6 Smart kitchen & appliance systems
- 5.6.1 Smart refrigerators
- 5.6.2 Smart ovens & ranges
- 5.6.3 Smart dishwashers
- 5.6.4 Smart coffee makers
- 5.6.5 Others (smart blenders etc.)
- 5.7 Smart laundry & cleaning systems
- 5.7.1 Smart washing machines
- 5.7.2 Smart dryers
- 5.7.3 Smart robotic vacuums
- 5.7.4 Others (smart window cleaners etc.)
- 5.8 Smart outdoor & garden systems
- 5.8.1 Smart sprinkler controllers
- 5.8.2 Smart drip irrigation
- 5.8.3 Smart lawn mowers
- 5.8.4 Others (smart weather stations etc.)
- 5.9 Smart health & wellness system
- 5.9.1 Smart air quality monitors
- 5.9.2 Smart sleep monitors
- 5.9.3 Smart medicine dispensers
- 5.9.4 Others (smart fall detection systems etc.)
- 5.10 Smart energy & utility systems
- 5.10.1 Smart meters
- 5.10.2 Smart solar systems
- 5.10.3 Smart battery storage
- 5.10.4 Others (smart load controllers etc.)
- 5.11 Others (smart connectivity & control systems etc.)
Chapter 6 Market Estimates & Forecast, By Connectivity, 2022-2035 (USD Billion) (Million Units)
- 6.1 Key trends
- 6.2 Wireless protocols
- 6.2.1 ZigBee
- 6.2.2 Wi-Fi
- 6.2.3 Bluetooth
- 6.2.4 Z Wave
- 6.2.5 Others
- 6.3 Wired protocols
- 6.3.1 Ethernet
- 6.3.2 Powerline communication (PLC)
- 6.4 Hybrid.
Chapter 7 Market Estimates & Forecast, By Price, 2022-2035 (USD Billion) (Million Units)
- 7.1 Key trends
- 7.2 Low (below USD 500)
- 7.3 Medium (between USD 500 and USD 1,000)
- 7.4 High (above USD 1,000)
Chapter 8 Market Estimates & Forecast, By Installation, 2022-2035 (USD Billion) (Million Units)
- 8.1 Key trends
- 8.2 New construction
- 8.3 Retrofit
Chapter 9 Market Estimates & Forecast, By Distribution Channel, 2022-2035 (USD Billion) (Million Units)
- 9.1 Key trends
- 9.2 Online
- 9.3 Offline
Chapter 10 Market Estimates & Forecast, By Region, 2022-2035 (USD Billion) (Million Units)
- 10.1 Key trends
- 10.2 North America
- 10.2.1 U.S.
- 10.2.2 Canada
- 10.3 Europe
- 10.3.1 Germany
- 10.3.2 UK
- 10.3.3 France
- 10.3.4 Spain
- 10.3.5 Italy
- 10.4 Asia Pacific
- 10.4.1 China
- 10.4.2 Japan
- 10.4.3 India
- 10.4.4 Australia
- 10.4.5 South Korea
- 10.5 Latin America
- 10.5.1 Brazil
- 10.5.2 Mexico
- 10.5.3 Argentina
- 10.6 Middle East and Africa
- 10.6.1 South Africa
- 10.6.2 Saudi Arabia
- 10.6.3 UAE
Chapter 11 Company Profiles
- 11.1 Amazon
- 11.2 Apple
- 11.3 Bosch
- 11.4 Dyson
- 11.5 Ecobee
- 11.6 Google
- 11.7 Honeywell
- 11.8 LG
- 11.9 Panasonic
- 11.10 Ring
- 11.11 Samsung
- 11.12 Schneider Electric
- 11.13 Siemens
- 11.14 Sonos
- 11.15 Xiaomi
