


 |
市場調查報告書
商品編碼
2027626
奈米金屬氧化物市場:商業機會、成長要素、產業趨勢分析及2026-2035年預測Nano Metal Oxide Market Opportunity, Growth Drivers, Industry Trend Analysis, and Forecast 2026 - 2035 |
||||||
全球奈米金屬氧化物市場預計到 2025 年將價值 63 億美元,預計到 2035 年將以 6.7% 的複合年成長率成長至 120 億美元。
奈米金屬氧化物的粒徑範圍為1至100奈米,具有與塊體材料截然不同的獨特性能,包括更大的比表面積、更強的化學反應活性、更優異的機械強度、更高的導電性和更優異的光學性能。這些材料在電子、醫療保健、能源、化妝品和環境修復等眾多領域有著廣泛的應用。在電子領域,奈米金屬氧化物因其卓越的導電性和催化作用而被應用於導電塗層、半導體和感測器技術。在醫療領域,其良好的生物相容性和精準的遞送能力支持標靶藥物遞送、生物醫學影像和癌症治療。在太陽能電池、燃料電池和催化製程等能源應用中,其優異的光學和催化效率被用於提高能量轉換和儲存效率,從而推動全球可再生能源技術的發展。
| 市場範圍 | |
|---|---|
| 開始年份 | 2025 |
| 預測期 | 2026-2035 |
| 上市時的市場規模 | 63億美元 |
| 預計金額 | 120億美元 |
| 複合年成長率 | 6.7% |
預計到2025年,二氧化鈦市場佔有率將達到28.5%,並在2035年之前以5.9%的複合年成長率成長。二氧化鈦憑藉其在電子、醫療保健和能源行業的廣泛應用(包括半導體製造和太陽能發電),保持著強勁的市場地位。其化學穩定性、光學透明度和優異的電學性能使其成為高性能應用的理想選擇,推動了其在各個領域的持續應用。
預計到2025年,溶膠-凝膠法將佔41%的市佔率。該技術使製造商能夠生產出粒徑、形狀和均勻性均精確控制的奈米金屬氧化物。在此過程中,首先透過金屬醇鹽的水解和縮合形成溶膠,然後進行凝膠化和熱處理,即可獲得高品質的氧化物奈米顆粒。由於溶膠-凝膠合成能夠控制形貌和結構特性,因此無論應用領域為何,都能確保性能的一致性,從而鞏固了此方法在奈米金屬氧化物生產中的優勢。
預計到2025年,北美奈米金屬氧化物市場規模將達到13億美元,並在2026年至2035年間以6.4%的複合年成長率成長。北美市場的成長主要得益於先進電子、醫療保健和儲能產業的蓬勃發展,以及強大的創新生態系統和嚴格的奈米材料法規結構的支持。美國在研發投入方面處於領先地位,而加拿大則透過環境和工業奈米技術研究舉措做出貢獻。這一強大的技術基礎使該地區在奈米金屬氧化物的商業化生產和應用方面保持著競爭優勢。
目錄
第1章:調查方法和範圍
第2章執行摘要
第3章業界考察
- 生態系分析
- 供應商情況
- 利潤率
- 每個階段增加的價值
- 影響價值鏈的因素
- 中斷
- 影響產業的因素
- 促進因素
- 對先進電子設備和半導體的需求不斷成長
- 儲能和電池技術的擴展
- 人們越來越關注環境修復
- 產業潛在風險與挑戰
- 生產成本高昂,製造流程複雜。
- 接觸奈米材料相關的健康與安全問題
- 市場機遇
- 開發永續和環境友善合成方法
- 化妝品和個人護理行業的成長潛力
- 促進因素
- 成長潛力分析
- 監理情勢
- 波特五力分析
- PESTEL 分析
- 價格趨勢
- 按地區
- 依產品類型
- 未來市場趨勢
- 科技與創新趨勢
- 當前技術趨勢
- 新興技術
- 專利趨勢
- 貿易統計(HS編碼)
- 主要進口國
- 主要出口國
- 永續性和環境方面
- 永續計劃
- 減少廢棄物策略
- 生產中的能源效率
- 環保意識的舉措
- 考慮碳足跡
第4章 競爭情勢
- 介紹
- 企業市佔率分析
- 按地區
- 北美洲
- 歐洲
- 亞太地區
- 拉丁美洲
- 中東和非洲
- 按地區
- 主要市場公司的競爭分析
- 競爭定位矩陣
- 主要進展
- 併購
- 夥伴關係與合作
- 新產品發布
- 業務拓展計劃
第5章 市場估算與預測:依產品類型分類,2022-2035年
- 氧化鈦
- 氧化鋅
- 氧化鋁
- 氧化銅
- 氧化鐵
- 氧化鉻
- 其他
第6章 市場估算與預測:依製造方法分類,2022-2035年
- 溶膠-凝膠法
- 水熱法
- 降水法
- 共沉澱法
- 直接降水法
- 化學氣相沉積(CVD)
- 其他
第7章 市場估計與預測:依粒徑分類,2022-2035年
- 奈米顆粒
- 奈米棒
- 奈米管
- 奈米線
- 其他
第8章 市場估計與預測:依應用領域分類,2022-2035年
- 電子與電機工程
- 半導體
- 感應器
- 顯示技術
- 導電膜
- 能量儲存和轉換
- 電池(鋰離子電池、全固體)
- 超級電容
- 太陽能電池
- 燃料電池
- 催化劑
- 衛生保健
- 化妝品和個人護理
- 防曬油
- 抗衰老產品
- 彩妝
- 建造
- 其他
第9章 市場估計與預測:依地區分類,2022-2035年
- 北美洲
- 美國
- 加拿大
- 歐洲
- 德國
- 英國
- 法國
- 西班牙
- 義大利
- 其他歐洲地區
- 亞太地區
- 中國
- 印度
- 日本
- 澳洲
- 韓國
- 亞太其他地區
- 拉丁美洲
- 巴西
- 墨西哥
- 阿根廷
- 其他拉丁美洲地區
- 中東和非洲
- 沙烏地阿拉伯
- 南非
- 阿拉伯聯合大公國
- 其他中東和非洲地區
第10章:公司簡介
- Advanced Nano Products Co. Ltd.
- American Elements
- BASF SE
- Evonik Industries AG
- Hongwu International Group Ltd.
- Inframat Advanced Materials LLC
- Meliorum Technologies Inc.
- nanoComposix Inc.
- Nanophase Technologies Corporation
- Nanostructured & Amorphous Materials Inc.
- PlasmaChem GmbH
- Reinste Nano Ventures Pvt. Ltd.
- Sakai Chemical Industry Co., Ltd.
- SkySpring Nanomaterials Inc.
- Tayca Corporation
- Tronox Holdings plc
- Umicore
- US Research Nanomaterials Inc.
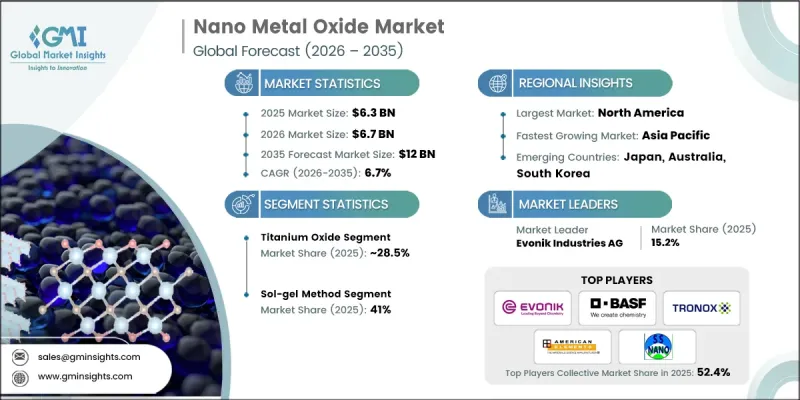
The Global Nano Metal Oxide Market was valued at USD 6.3 billion in 2025 and is estimated to grow at a CAGR of 6.7% to reach USD 12 billion by 2035.
Nano metal oxides, with particle sizes ranging from 1 to 100 nanometers, exhibit unique characteristics that differentiate them from their bulk counterparts, including increased surface area, enhanced chemical reactivity, superior mechanical strength, improved electrical conductivity, and advanced optical properties. These materials have found wide-ranging applications across electronics, healthcare, energy, cosmetics, and environmental remediation. In electronics, nano metal oxides are used for conductive coatings, semiconductors, and sensor technologies due to their exceptional conductivity and catalytic behavior. In the medical sector, they support targeted drug delivery, biomedical imaging, and cancer therapies due to their biocompatibility and precision delivery capabilities. Their use in energy applications, including solar cells, fuel cells, and catalytic processes, leverages their optical and catalytic efficiency to improve energy conversion and storage, supporting the advancement of renewable energy technologies worldwide.
| Market Scope | |
|---|---|
| Start Year | 2025 |
| Forecast Year | 2026-2035 |
| Start Value | $6.3 Billion |
| Forecast Value | $12 Billion |
| CAGR | 6.7% |
The titanium oxide segment held 28.5% in 2025 and is expected to grow at a CAGR of 5.9% through 2035. Titanium oxide maintains a strong market presence due to its extensive utilization across electronics, healthcare, and energy industries, including semiconductor fabrication and solar energy applications. Its chemical stability, optical clarity, and electrical properties make it a preferred choice for high-performance applications, driving continuous adoption in multiple sectors.
The sol-gel method accounted for 41% share in 2025. This technique allows manufacturers to produce nano metal oxides with precise particle sizes, shapes, and uniformity. The process involves hydrolysis and condensation of metal alkoxides to form a sol, followed by gelation and thermal treatment, resulting in high-quality oxide nanoparticles. The ability to control morphological and structural features through sol-gel synthesis ensures consistent performance across applications, which has solidified its dominance in nano metal oxide production.
North America Nano Metal Oxide Market was valued at USD 1.3 billion in 2025 and is expected to grow at a CAGR of 6.4% from 2026 to 2035. North America's growth is driven by advanced electronics, healthcare, and energy storage sectors, supported by a robust innovation ecosystem and a stringent regulatory framework for nanomaterials. The U.S. leads the region due to significant research and development investments, while Canada contributes through environmental and industrial nanotechnology research initiatives. This strong technological foundation enables the region to maintain a competitive edge in commercial production and application of nanometal oxides.
Key players operating in the Global Nano Metal Oxide Market include American Elements, SkySpring Nanomaterials Inc., Inframat Advanced Materials LLC, Advanced Nano Products Co. Ltd., Nanostructured & Amorphous Materials Inc., BASF SE, Tronox Holdings plc, Meliorum Technologies Inc., Sakai Chemical Industry Co., Ltd., Evonik Industries AG, NanoComposix Inc., Tayca Corporation, Reinste Nano Ventures Pvt. Ltd., PlasmaChem GmbH, Umicore, Hongwu International Group Ltd., and US Research Nanomaterials Inc. Companies in the Nano Metal Oxide Market are implementing strategies to strengthen their market presence through investment in high-precision manufacturing technologies that ensure particle size consistency, purity, and optimized functional performance. They are expanding regional operations via joint ventures, strategic partnerships, and mergers to access new end-use sectors. R&D efforts are prioritized to develop application-specific formulations for electronics, healthcare, and energy solutions. Firms are also focusing on sustainability by creating eco-friendly production processes and enhancing the recycling of nanomaterials. Supply chain optimization, intellectual property development, and collaboration with research institutions further support market competitiveness, while providing technical services and customized solutions help secure long-term client relationships and maintain a leading position in the global market.
Table of Contents
Chapter 1 Methodology & Scope
- 1.1 Market scope and definition
- 1.2 Research design
- 1.2.1 Research approach
- 1.2.2 Data collection methods
- 1.3 Data mining sources
- 1.3.1 Global
- 1.3.2 Regional/Country
- 1.4 Base estimates and calculations
- 1.4.1 Base year calculation
- 1.4.2 Key trends for market estimation
- 1.5 Primary research and validation
- 1.5.1 Primary sources
- 1.6 Forecast model
- 1.7 Research assumptions and limitations
Chapter 2 Executive Summary
- 2.1 Industry 360° synopsis
- 2.2 Key market trends
- 2.2.1 Regional
- 2.2.2 Grade
- 2.2.3 Form
- 2.2.4 Application
- 2.2.5 End use industry
- 2.2.6 Distribution channel
- 2.3 TAM Analysis, 2026-2035
- 2.4 CXO perspectives: Strategic imperatives
Chapter 3 Industry Insights
- 3.1 Industry ecosystem analysis
- 3.1.1 Supplier landscape
- 3.1.2 Profit margin
- 3.1.3 Value addition at each stage
- 3.1.4 Factor affecting the value chain
- 3.1.5 Disruptions
- 3.2 Industry impact forces
- 3.2.1 Growth drivers
- 3.2.1.1 Growing demand for advanced electronics & semiconductors
- 3.2.1.2 Expansion of energy storage & battery technologies
- 3.2.1.3 Increasing focus on environmental remediation
- 3.2.2 Industry pitfalls and challenges
- 3.2.2.1 High production costs & complex manufacturing processes
- 3.2.2.2 Health & safety concerns related to nanomaterial exposure
- 3.2.3 Market opportunities
- 3.2.3.1 Development of sustainable & green synthesis methods
- 3.2.3.2 Growth potential in cosmetics & personal care sector
- 3.2.1 Growth drivers
- 3.3 Growth potential analysis
- 3.4 Regulatory landscape
- 3.4.1 North America
- 3.4.2 Europe
- 3.4.3 Asia Pacific
- 3.4.4 Latin America
- 3.4.5 Middle East & Africa
- 3.5 Porter's analysis
- 3.6 PESTEL analysis
- 3.7 Price trends
- 3.7.1 By region
- 3.7.2 By product type
- 3.8 Future market trends
- 3.9 Technology and innovation landscape
- 3.9.1 Current technological trends
- 3.9.2 Emerging technologies
- 3.10 Patent Landscape
- 3.11 Trade statistics (HS code)
- 3.11.1 Major importing countries
- 3.11.2 Major exporting countries
- 3.12 Sustainability and environmental aspects
- 3.12.1 Sustainable practices
- 3.12.2 Waste reduction strategies
- 3.12.3 Energy efficiency in production
- 3.12.4 Eco-friendly initiatives
- 3.13 Carbon footprint consideration
Chapter 4 Competitive Landscape, 2025
- 4.1 Introduction
- 4.2 Company market share analysis
- 4.2.1 By region
- 4.2.1.1 North America
- 4.2.1.2 Europe
- 4.2.1.3 Asia Pacific
- 4.2.1.4 LATAM
- 4.2.1.5 MEA
- 4.2.1 By region
- 4.3 Competitive analysis of major market players
- 4.4 Competitive positioning matrix
- 4.5 Key developments
- 4.5.1 Mergers & acquisitions
- 4.5.2 Partnerships & collaborations
- 4.5.3 New Product Launches
- 4.5.4 Expansion Plans
Chapter 5 Market Estimates and Forecast, By Product Type, 2022-2035 (USD Billion) (Kilo Tons)
- 5.1 Key trends
- 5.2 Titanium oxide
- 5.3 Zinc oxide
- 5.4 Aluminum oxide
- 5.5 Copper oxide
- 5.6 Iron oxide
- 5.7 Chromium oxide
- 5.8 Other
Chapter 6 Market Estimates and Forecast, By Production Method, 2022-2035 (USD Billion) (Kilo Tons)
- 6.1 Key trends
- 6.2 Sol-gel method
- 6.3 Hydrothermal method
- 6.4 Precipitation method
- 6.4.1 Co-precipitation
- 6.4.2 Direct precipitation
- 6.5 Chemical vapor deposition (CVD)
- 6.6 Others
Chapter 7 Market Estimates and Forecast, By Particle Size, 2022-2035 (USD Billion) (Kilo Tons)
- 7.1 Key trends
- 7.2 Nanoparticles
- 7.3 Nanorods
- 7.4 Nanotubes
- 7.5 Nanowires
- 7.6 Others
Chapter 8 Market Estimates and Forecast, By Application, 2022-2035 (USD Billion) (Kilo Tons)
- 8.1 Key trends
- 8.2 Electronics & electrical
- 8.2.1 Semiconductors
- 8.2.2 Sensors
- 8.2.3 Display technologies
- 8.2.4 Conductive films
- 8.3 Energy storage & conversion
- 8.3.1 Batteries (li-ion, solid-state)
- 8.3.2 Supercapacitors
- 8.3.3 Solar cells
- 8.3.4 Fuel cells
- 8.4 Catalysis
- 8.5 Healthcare
- 8.6 Cosmetics & personal care
- 8.6.1 Sunscreens
- 8.6.2 Anti-aging products
- 8.6.3 Color cosmetics
- 8.7 Construction
- 8.8 Others
Chapter 9 Market Estimates and Forecast, By Region, 2022-2035 (USD Billion) (Kilo Tons)
- 9.1 Key trends
- 9.2 North America
- 9.2.1 U.S.
- 9.2.2 Canada
- 9.3 Europe
- 9.3.1 Germany
- 9.3.2 UK
- 9.3.3 France
- 9.3.4 Spain
- 9.3.5 Italy
- 9.3.6 Rest of Europe
- 9.4 Asia Pacific
- 9.4.1 China
- 9.4.2 India
- 9.4.3 Japan
- 9.4.4 Australia
- 9.4.5 South Korea
- 9.4.6 Rest of Asia Pacific
- 9.5 Latin America
- 9.5.1 Brazil
- 9.5.2 Mexico
- 9.5.3 Argentina
- 9.5.4 Rest of Latin America
- 9.6 Middle East and Africa
- 9.6.1 Saudi Arabia
- 9.6.2 South Africa
- 9.6.3 UAE
- 9.6.4 Rest of Middle East and Africa
Chapter 10 Company Profiles
- 10.1 Advanced Nano Products Co. Ltd.
- 10.2 American Elements
- 10.3 BASF SE
- 10.4 Evonik Industries AG
- 10.5 Hongwu International Group Ltd.
- 10.6 Inframat Advanced Materials LLC
- 10.7 Meliorum Technologies Inc.
- 10.8 nanoComposix Inc.
- 10.9 Nanophase Technologies Corporation
- 10.10 Nanostructured & Amorphous Materials Inc.
- 10.11 PlasmaChem GmbH
- 10.12 Reinste Nano Ventures Pvt. Ltd.
- 10.13 Sakai Chemical Industry Co., Ltd.
- 10.14 SkySpring Nanomaterials Inc.
- 10.15 Tayca Corporation
- 10.16 Tronox Holdings plc
- 10.17 Umicore
- 10.18 US Research Nanomaterials Inc.


