


 |
市場調查報告書
商品編碼
2027578
電子掃描陣列市場機會、成長要素、產業趨勢分析及2026-2035年預測。Electronically Scanned Arrays Market Opportunity, Growth Drivers, Industry Trend Analysis, and Forecast 2026 - 2035 |
||||||
全球電子掃描陣列 (ESA) 市場預計到 2025 年價值 96 億美元,預計到 2035 年將以 7.8% 的複合年成長率成長至 203 億美元。
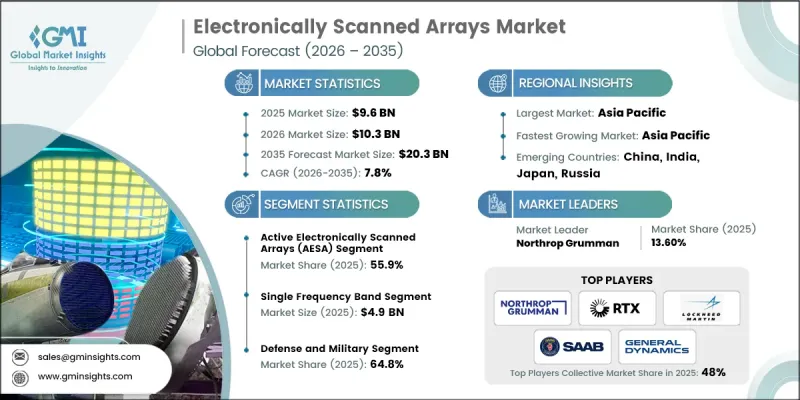
這一擴張是由軍事、航太和商業應用領域對精確探測和多目標追蹤日益成長的需求所驅動的。世界各國政府都在優先發展先進的機載情報、監視和偵察(ISR)系統,以提高情境察覺和威脅監控能力,這推動了此類系統在戰鬥機、無人機、海上巡邏機和預警機(AEW&C)平台上的部署。此外,與人工智慧感測系統、網路中心防禦技術和天基應用的整合也促進了市場發展,民用航空交通管理和太空探勘也創造了新的機會。雷達現代化投資的增加以及對可靠、高性能感測系統日益成長的需求,持續推動電子掃描陣列(ESA)產業的發展。
| 市場範圍 | |
|---|---|
| 開始年份 | 2025 |
| 預測期 | 2026-2035 |
| 上市時的市場規模 | 96億美元 |
| 預測金額 | 203億美元 |
| 複合年成長率 | 7.8% |
到2025年,主動相控陣雷達(AESA)市場佔有率將達55.9%。這主要歸功於其高速波束控制、多目標追蹤能力以及強大的抗電子對抗能力。這些陣列可靠性高、維護需求低、性能卓越,是現代國防系統、航太應用和監視網路的理想選擇。 AESA在戰鬥機、海軍防禦系統和防空應用中的廣泛應用,確保了其市場主導地位。
單頻段雷達憑藉其可靠的高功率性能和易於整合的特點,預計到2025年市場規模將達到49億美元。它廣泛應用於現有雷達系統、海軍作戰和預警網路。其穩健的架構和久經考驗的可靠性正推動著地面和艦載雷達部署中技術的持續應用。
預計到2025年,北美電子掃描陣列(AESA)市佔率將達到38.2%。該地區的成長主要得益於大規模的國防現代化建設和先進的航太技術。對軍用航空系統、飛彈防禦網路和海軍平台的高需求正在推動AESA和PESA技術的應用。此外,傳統雷達系統的持續升級、民用航空航太平台的應用以及主要國防承包商支持的強大研發體系,也都在推動該地區的市場擴張。
目錄
第1章:調查方法和範圍
第2章執行摘要
第3章業界考察
- 生態系分析
- 供應商情況
- 利潤率
- 成本結構
- 每個階段增加的價值
- 影響價值鏈的因素
- 中斷
- 影響產業的因素
- 促進因素
- 全球國防和國防安全保障支出增加
- 在太空、衛星和新興應用領域不斷擴大應用。
- 雷達和天線技術的進步
- 對機載情報、監視和偵察 (ISR) 系統的需求不斷成長。
- 民用航空和先進空中交通管理的發展
- 產業潛在風險與挑戰
- 高昂的開發成本和複雜的系統整合要求
- 嚴格的法規、出口管制和認證要求
- 市場機遇
- 擴大空間通訊和衛星星系的部署
- 擴大下一代自主和無人系統的部署
- 促進因素
- 成長潛力分析
- 監理情勢
- 北美洲
- 歐洲
- 亞太地區
- 拉丁美洲
- 中東和非洲
- 波特的分析
- PESTEL 分析
- 科技與創新趨勢
- 當前技術趨勢
- 新興技術
- 價格趨勢
- 按地區
- 依產品
- 定價策略
- 新興經營模式
- 合規要求
- 專利和智慧財產權分析
- 地緣政治和貿易趨勢
第4章 競爭情勢
- 介紹
- 企業市佔率分析
- 按地區
- 北美洲
- 歐洲
- 亞太地區
- 拉丁美洲
- 中東和非洲
- 市場集中度分析
- 按地區
- 主要公司的競爭標竿分析
- 財務績效比較
- 銷售量
- 利潤率
- 研究與開發
- 產品系列比較
- 產品線寬度
- 科技
- 創新
- 區域擴張比較
- 全球擴張分析
- 服務網路覆蓋
- 按地區分類的市場滲透率
- 競爭定位矩陣
- 領導者
- 挑戰者
- 追蹤者
- 小眾玩家
- 戰略展望矩陣
- 財務績效比較
- 主要進展
- 併購
- 夥伴關係與合作
- 技術進步
- 擴張和投資策略
- 數位轉型計劃
- 新興競爭對手和新創競爭對手的發展趨勢
第5章 市場估計與預測:依類型分類,2022-2035年
- 主動電子掃描陣列(AESA)
- 無源電子掃描陣列(PESA)
第6章 市場估算與預測:依陣列形狀分類,2022-2035年
- 平面陣列
- 線性陣列
- 頻率掃描陣列
第7章 市場估計與預測:依頻段分類,2022-2035年
- 單頻
- X波段
- S波段
- L波段
- C波段
- 其他
- 多頻
第8章 市場估計與預測:以續航里程分類,2022-2035年
- 短距離(小於50公里)
- 中等距離(50-300公里)
- 長途(超過300公里)
第9章 市場估計與預測:依平台分類,2022-2035年
- 航空
- 海軍
- 地面以上
- 宇宙
第10章 市場估價與預測:依應用領域分類,2022-2035年
- 雷達
- 溝通
- 導航
- 電子戰
- 其他
第11章 市場估計與預測:依應用領域分類,2022-2035年
- 國防/軍事
- 空中監視/預警
- 火控和飛彈導引系統
- 電子戰(EW)與干擾系統
- 海軍雷達和海上監視
- 地面防空系統
- 其他
- 消費者/商業
- 空中交通管制/管理
- 氣象觀測與預報
- 衛星通訊
- 導航
- 其他
第12章 市場估計與預測:依地區分類,2022-2035年
- 北美洲
- 美國
- 加拿大
- 歐洲
- 德國
- 英國
- 法國
- 西班牙
- 義大利
- 俄羅斯
- 亞太地區
- 中國
- 印度
- 日本
- 澳洲
- 韓國
- 拉丁美洲
- 巴西
- 墨西哥
- 阿根廷
- 中東和非洲
- 南非
- 沙烏地阿拉伯
- 阿拉伯聯合大公國
第13章:公司簡介
- 全球主要公司
- Northrop Grumman
- RTX Corporation
- Lockheed Martin Corporation
- Saab AB
- General Dynamics Corporation
- 按地區分類的主要公司
- 北美洲
- BAE Systems
- General Dynamics Corporation
- L3Harris Technologies, Inc.
- Lockheed Martin Corporation
- Northrop Grumman
- RTX Corporation
- Teledyne Technologies Incorporated
- Viasat, Inc.
- 亞太地區
- Bharat Electronics Limited
- Hanwha Systems Co., Ltd.
- LIG Nex1 Co., Ltd.
- Mitsubishi Electric Corporation
- 歐洲
- Hensoldt AG
- Indra Sistemas, SA
- Leonardo SpA
- Saab AB
- Thales Group
- Middle East &Africa
- Aselsan AS
- Elbit Systems Ltd.
- Israel Aerospace Industries Ltd.
- 北美洲
- 特殊玩家/干擾者
- Ravpower
The Global Electronically Scanned Arrays Market was valued at USD 9.6 billion in 2025 and is estimated to grow at a CAGR of 7.8% to reach USD 20.3 billion by 2035.
Expansion is fueled by rising demand for precision detection and multi-target tracking across military, aerospace, and commercial applications. Governments worldwide are prioritizing advanced airborne ISR systems to improve situational awareness and threat monitoring, which is driving adoption in fighter jets, unmanned aerial vehicles, maritime patrol aircraft, and AEW&C platforms. The market is further bolstered by integration with AI-enabled sensing systems, network-centric defense technologies, and space-based applications, while commercial air traffic management and space exploration also present emerging opportunities. Increasing investments in radar modernization and the need for reliable, high-performance sensing systems continue to propel the electronically scanned arrays industry forward.
| Market Scope | |
|---|---|
| Start Year | 2025 |
| Forecast Year | 2026-2035 |
| Start Value | $9.6 Billion |
| Forecast Value | $20.3 Billion |
| CAGR | 7.8% |
The active electronically scanned arrays (AESA) segment held a 55.9% share in 2025, primarily due to its high-speed beam steering, multi-target tracking capabilities, and strong resistance to electronic countermeasures. These arrays are highly reliable, require minimal maintenance, and deliver superior performance, making them the preferred choice for modern defense systems, aerospace applications, and surveillance networks. Their extensive use across fighter aircraft, naval defense systems, and air defense applications ensures that AESA maintains market dominance.
The single frequency band segment reached USD 4.9 billion in 2025, owing to its dependable high-power performance and ease of integration. It is widely utilized in established radar systems, naval operations, and early warning networks. Its robust architecture and proven reliability reinforce its continued adoption in ground-based and naval radar deployments.
North America Electronically Scanned Arrays Market accounted for 38.2% share in 2025. The region's growth is driven by substantial defense modernization efforts and advanced aerospace technologies. High demand for military aviation systems, missile defense networks, and naval platforms is encouraging the deployment of AESA and PESA technologies. Additionally, the ongoing upgrade of legacy radar systems, adoption in commercial aviation and space-based platforms, and strong R&D infrastructure supported by leading defense contractors are boosting regional market expansion.
Key players in the Global Electronically Scanned Arrays Market include BAE Systems, Aselsan A.S., Bharat Electronics Limited, Elbit Systems Ltd., General Dynamics Corporation, Hanwha Systems Co., Ltd., Hensoldt AG, Indra Sistemas S.A., Israel Aerospace Industries Ltd., L3Harris Technologies, Inc., Leonardo S.P.A., Lig Nex1 Co., Ltd., Lockheed Martin Corporation, Mitsubishi Electric Corporation, Northrop Grumman, RTX Corporation, Saab AB, Teledyne Technologies Incorporated, Thales Group, and Viasat, Inc. Companies in the Global Electronically Scanned Arrays Market are adopting strategic initiatives to enhance their market presence and maintain competitive advantage. These strategies include continuous investment in R&D to improve beamforming, signal processing, and array density capabilities, while enhancing reliability and efficiency. Firms are forming partnerships and alliances to expand regional and global distribution networks and gain access to new defense and aerospace contracts. Technology integration with AI, network-centric warfare systems, and next-generation sensors helps differentiate products and meet evolving customer requirements. Companies are also focusing on upgrading legacy systems and offering retrofit solutions for existing defense platforms. Strong participation in government programs, export initiatives, and strategic collaborations enables companies to secure long-term contracts and strengthen their foothold in both military and commercial markets.
Table of Contents
Chapter 1 Methodology and Scope
- 1.1 Market scope and definition
- 1.2 Research design
- 1.2.1 Research approach
- 1.2.2 Data collection methods
- 1.3 Data mining sources
- 1.3.1 Global
- 1.3.2 Regional/Country
- 1.4 Base estimates and calculations
- 1.4.1 Base year calculation
- 1.4.2 Key trends for market estimation
- 1.5 Primary research and validation
- 1.5.1 Primary sources
- 1.6 Forecast model
- 1.7 Research assumptions and limitations
Chapter 2 Executive Summary
- 2.1 Industry 360° synopsis, 2022 - 2035
- 2.2 Key market trends
- 2.2.1 Type trends
- 2.2.2 Arrays Geometry trends
- 2.2.3 Frequency Band trends
- 2.2.4 Range trends
- 2.2.5 Platform trends
- 2.2.6 Application trends
- 2.2.7 End Use trends
- 2.2.8 Regional trends
- 2.3 TAM Analysis, 2026-2035
- 2.4 CXO perspectives: Strategic imperatives
- 2.4.1 Executive decision points
- 2.4.2 critical success factors
- 2.5 Future outlook and strategic recommendations
Chapter 3 Industry Insights
- 3.1 Industry ecosystem analysis
- 3.1.1 Supplier Landscape
- 3.1.2 Profit Margin
- 3.1.3 Cost structure
- 3.1.4 Value addition at each stage
- 3.1.5 Factor affecting the value chain
- 3.1.6 Disruptions
- 3.2 Industry impact forces
- 3.2.1 Growth drivers
- 3.2.1.1 Increased global defence and homeland security spending
- 3.2.1.2 Rising adoption in space, satellite, and emerging applications
- 3.2.1.3 Advancements in radar and antenna technologies
- 3.2.1.4 Growing demand for airborne intelligence, surveillance, and reconnaissance (ISR)
- 3.2.1.5 Expansion of commercial aviation and advanced air traffic management
- 3.2.2 Industry pitfalls and challenges
- 3.2.2.1 High development costs and complex system integration requirements
- 3.2.2.2 Stringent regulatory, export-control, and certification requirements
- 3.2.3 Market opportunities
- 3.2.3.1 Expansion of space-based communications and satellite constellation deployments
- 3.2.3.2 Rising adoption of next-generation autonomous and unmanned systems
- 3.2.1 Growth drivers
- 3.3 Growth potential analysis
- 3.4 Regulatory landscape
- 3.4.1 North America
- 3.4.2 Europe
- 3.4.3 Asia Pacific
- 3.4.4 Latin America
- 3.4.5 Middle East & Africa
- 3.5 Porter’s analysis
- 3.6 PESTEL analysis
- 3.7 Technology and Innovation landscape
- 3.7.1 Current technological trends
- 3.7.2 Emerging technologies
- 3.8 Price trends
- 3.8.1 By region
- 3.8.2 By product
- 3.9 Pricing Strategies
- 3.10 Emerging Business Models
- 3.11 Compliance Requirements
- 3.12 Patent and IP analysis
- 3.13 Geopolitical and trade dynamics
Chapter 4 Competitive Landscape, 2025
- 4.1 Introduction
- 4.2 Company market share analysis
- 4.2.1 By region
- 4.2.1.1 North America
- 4.2.1.2 Europe
- 4.2.1.3 Asia Pacific
- 4.2.1.4 Latin America
- 4.2.1.5 Middle East & Africa
- 4.2.2 Market concentration analysis
- 4.2.1 By region
- 4.3 Competitive benchmarking of key players
- 4.3.1 Financial performance comparison
- 4.3.1.1 Revenue
- 4.3.1.2 Profit margin
- 4.3.1.3 R&D
- 4.3.2 Product portfolio comparison
- 4.3.2.1 Product range breadth
- 4.3.2.2 Technology
- 4.3.2.3 Innovation
- 4.3.3 Geographic presence comparison
- 4.3.3.1 Global footprint analysis
- 4.3.3.2 Service network coverage
- 4.3.3.3 Market penetration by region
- 4.3.4 Competitive positioning matrix
- 4.3.4.1 Leaders
- 4.3.4.2 Challengers
- 4.3.4.3 Followers
- 4.3.4.4 Niche players
- 4.3.5 Strategic outlook matrix
- 4.3.1 Financial performance comparison
- 4.4 Key developments
- 4.4.1 Mergers and acquisitions
- 4.4.2 Partnerships and collaborations
- 4.4.3 Technological advancements
- 4.4.4 Expansion and investment strategies
- 4.4.5 Digital transformation initiatives
- 4.5 Emerging/ startup competitors landscape
Chapter 5 Market Estimates and Forecast, By Type, 2022 - 2035
- 5.1 Key trends
- 5.2 Active Electronically Scanned Arrays (AESA)
- 5.3 Passive Electronically Scanned Arrays (PESA)
Chapter 6 Market Estimates and Forecast, By Arrays Geometry, 2022 - 2035
- 6.1 Key trends
- 6.2 Planar Arrays
- 6.3 Linear Arrays
- 6.4 Frequency Scanning Arrays
Chapter 7 Market Estimates and Forecast, By Frequency Band, 2022 - 2035
- 7.1 Key trends
- 7.2 Single Frequency
- 7.2.1 X-Band
- 7.2.2 S-Band
- 7.2.3 L-Band
- 7.2.4 C-Band
- 7.2.5 Others
- 7.3 Multifrequency
Chapter 8 Market Estimates and Forecast, By Range, 2022 - 2035
- 8.1 Key trends
- 8.2 Short Range (<50 km)
- 8.3 Medium Range (50-300 km)
- 8.4 Long Range (>300 km)
Chapter 9 Market Estimates and Forecast, By Platform, 2022 - 2035
- 9.1 Key trends
- 9.2 Air
- 9.3 Naval
- 9.4 Ground
- 9.5 Space
Chapter 10 Market Estimates and Forecast, By Application, 2022 - 2035
- 10.1 Key trends
- 10.2 Radar
- 10.3 Communication
- 10.4 Navigation
- 10.5 Electronic Warfare (EW)
- 10.6 Others
Chapter 11 Market Estimates and Forecast, By End-Use, 2022 - 2035
- 11.1 Key trends
- 11.2 Defense & Military
- 11.2.1 Air Surveillance & Early Warning
- 11.2.2 Fire Control & Missile Guidance Systems
- 11.2.3 Electronic Warfare (EW) & Jamming Systems
- 11.2.4 Naval Radar & Maritime Surveillance
- 11.2.5 Ground-Based Air Defense Systems
- 11.2.6 Others
- 11.3 Civilian & Commercial
- 11.3.1 Air Traffic Control & Management
- 11.3.2 Weather Monitoring & Forecasting
- 11.3.3 Satellite Communications
- 11.3.4 Navigation
- 11.3.5 Others
Chapter 12 Market Estimates and Forecast, By Region, 2022 - 2035
- 12.1 Key trends
- 12.2 North America
- 12.2.1 U.S.
- 12.2.2 Canada
- 12.3 Europe
- 12.3.1 Germany
- 12.3.2 UK
- 12.3.3 France
- 12.3.4 Spain
- 12.3.5 Italy
- 12.3.6 Russia
- 12.4 Asia Pacific
- 12.4.1 China
- 12.4.2 India
- 12.4.3 Japan
- 12.4.4 Australia
- 12.4.5 South Korea
- 12.5 Latin America
- 12.5.1 Brazil
- 12.5.2 Mexico
- 12.5.3 Argentina
- 12.6 Middle East and Africa
- 12.6.1 South Africa
- 12.6.2 Saudi Arabia
- 12.6.3 UAE
Chapter 13 Company Profiles
- 13.1 Global Key Players
- 13.1.1 Northrop Grumman
- 13.1.2 RTX Corporation
- 13.1.3 Lockheed Martin Corporation
- 13.1.4 Saab AB
- 13.1.5 General Dynamics Corporation
- 13.2 Regional key players
- 13.2.1 North America
- 13.2.1.1 BAE Systems
- 13.2.1.2 General Dynamics Corporation
- 13.2.1.3 L3Harris Technologies, Inc.
- 13.2.1.4 Lockheed Martin Corporation
- 13.2.1.5 Northrop Grumman
- 13.2.1.6 RTX Corporation
- 13.2.1.7 Teledyne Technologies Incorporated
- 13.2.1.8 Viasat, Inc.
- 13.2.2 Asia Pacific
- 13.2.2.1 Bharat Electronics Limited
- 13.2.2.2 Hanwha Systems Co., Ltd.
- 13.2.2.3 LIG Nex1 Co., Ltd.
- 13.2.2.4 Mitsubishi Electric Corporation
- 13.2.3 Europe
- 13.2.3.1 Hensoldt AG
- 13.2.3.2 Indra Sistemas, S.A.
- 13.2.3.3 Leonardo S.p.A.
- 13.2.3.4 Saab AB
- 13.2.3.5 Thales Group
- 13.2.4 Middle East & Africa
- 13.2.4.1 Aselsan A.S.
- 13.2.4.2 Elbit Systems Ltd.
- 13.2.4.3 Israel Aerospace Industries Ltd.
- 13.2.1 North America
- 13.3 Niche Players/Disruptors
- 13.3.1 Ravpower


