

 |
市場調查報告書
商品編碼
2027565
消費性電子市場機會、成長要素、產業趨勢分析及2026-2035年預測。Electric Household Appliances Market Opportunity, Growth Drivers, Industry Trend Analysis, and Forecast 2026 - 2035 |
||||||

預計到 2025 年,全球消費性電子市場規模將達到 6,137 億美元,年複合成長率為 7.6%,到 2035 年將達到 1.25 兆美元。
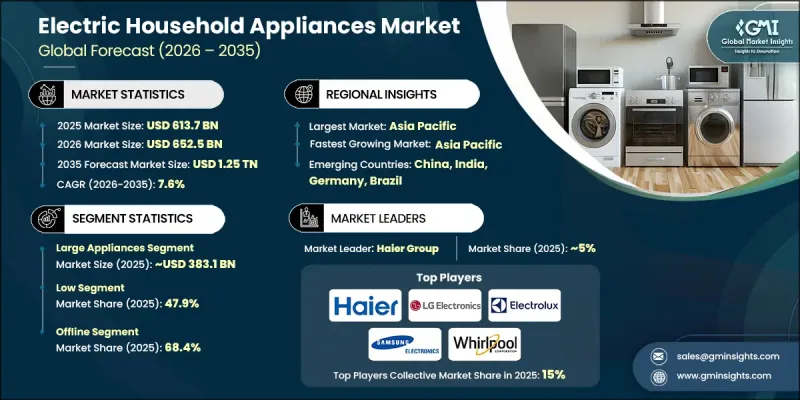
消費性電子市場的成長主要得益於智慧家居技術的廣泛應用,這些技術實現了無縫連接和遠端監控。製造商正致力於整合預測性維護、個人化設定和高級自動化等先進功能,以提升用戶體驗。能源效率仍是重中之重,各公司在開發符合永續性目標的家電產品的同時,也致力於為消費者節省長期成本。先進感測器和智慧系統的引入正在提升產品的性能、耐用性和運作效率。此外,日益成長的都市化也影響產品設計,促使開發出更適合現代生活空間的緊湊型多功能家電。消費者對便利性、連結性和環保產品的偏好不斷轉變,持續推動創新,使全球消費性電子市場成為一個充滿活力且快速發展的產業。
| 市場範圍 | |
|---|---|
| 開始年份 | 2025 |
| 預測期 | 2026-2035 |
| 初始市場規模 | 6137億美元 |
| 預測金額 | 1.25兆美元 |
| 複合年成長率 | 7.6% |
隨著製造商不斷提升產品功能和效能,消費性電子市場持續擴張。智慧技術和節能解決方案的密集創新使企業能夠在滿足不斷變化的消費者期望的同時,保持競爭優勢。這些趨勢正在推動已開發市場和新興市場對消費性電子產品的廣泛應用。
預計到2025年,大型消費性電子產品市場規模將達到3,831億美元,並在2026年至2035年間以7.4%的複合年成長率成長。由於其在日常生活中不可或缺的地位,該細分市場佔據了消費性電子產品市場的最大佔有率。消費者優先選擇更有效率、技術更先進的產品更換老舊家電,因此市場需求仍然強勁。持續的創新,包括智慧功能的整合和能源最佳化,進一步推動了該細分市場的成長。
預計到2025年,低價位產品將佔據47.9%的市場佔有率,成為消費性電子市場的主要類別之一。這一細分市場的成長主要得益於注重性價比的消費者的需求,尤其是在發展中地區,價格實惠和耐用性是消費者購買產品的關鍵因素。對基礎消費電子產品的廣泛需求支撐了其高銷量。該細分市場製造商之間的激烈競爭促使他們更加重視成本效益、營運最佳化和高效的供應鏈管理。
美國家用電器市場預計到2025年將達到910億美元,並在2026年至2035年間以7.4%的複合年成長率成長。這一成長主要得益於消費者支出增加、對智慧便利家居解決方案的強勁需求以及數位化零售通路的擴張。人工智慧和連接型家電系統等技術的進步也促進了家用電器的普及。消費者對永續產品和節能解決方案日益成長的興趣,以及生活方式的改變和住宅維修活動的增加,都推動了市場的持續擴張。
目錄
第1章:調查方法和範圍
第2章執行摘要
第3章業界考察
- 生態系分析
- 原物料供應商
- 區域製造地
- 配電網路結構
- 依價值鏈階段進行利潤率分析
- 每個階段增加的價值
- 影響價值鏈的因素
- 影響產業的因素
- 促進因素
- 技術進步
- 都市化和生活方式的改變
- 可支配所得增加
- 陷阱與挑戰
- 初始成本高
- 法規的複雜性
- 機會
- 智慧型連接型家電
- 節能永續的解決方案
- 促進因素
- 成長潛力分析
- 未來市場趨勢
- 科技與創新趨勢
- 當前技術趨勢
- 新興技術
- 價格趨勢
- 按地區
- 依產品
- 對過去價格趨勢的分析
- 按業務類型分類的定價策略
- 監理情勢
- 全球能源效率標準現狀
- 區域法規結構
- 安全和產品標準
- 環境與回收法規
- 貿易政策與關稅趨勢
- 新的監管趨勢
- 貿易資料分析(基於一手調查)-(HS編碼-8509.90)
- 全球進出口量及進口額趨勢
- 主要貿易走廊和合作夥伴
- 區域關稅結構及其影響
- 依國家和產品類型分析貿易差額
- 貿易協定的影響
- 人工智慧和生成式人工智慧對市場的影響
- GenAI 各細分市場的應用案例與部署藍圖
- 人工智慧在產品開發和個人化的應用
- 人工智慧在製造業和供應鏈最佳化的應用
- 風險、限制和監管考量
- 供應鏈分析
- 全球零件採購趨勢
- 主要零件供應商(按地區分類)
- 製造和組裝基地
- 物流和配送基礎設施
- 供應鏈中斷風險及應變能力
- 近岸外包和回岸外包的趨勢
- 對基本材料的依賴
- 分銷基礎設施和通路滲透狀況
- 按地區和業務類型(現代零售與傳統零售)分類的通路涵蓋範圍
- 最後一公里基礎設施和配送模式
- 安裝和售後服務網路的密度
- 區域電子商務履約基礎設施
- 波特五力分析
- PESTEL 分析
第4章 競爭情勢
- 介紹
- 企業市佔率分析
- 按地區
- 企業矩陣分析
- 主要市場公司的競爭分析
- 競爭定位矩陣
- 主要進展
- 併購
- 夥伴關係與合作
- 新產品發布
- 業務拓展計劃
第5章 市場估算與預測:依產品類型分類,2022-2035年
- 大型家用電器
- 冷藏庫
- 法式門
- 並排
- 頂部安裝
- 迷你緊湊型冷藏庫
- 烹飪用具
- 電爐
- 嵌入式烤箱
- IH 爐台
- 微波爐
- 組合式烤箱
- 洗衣設備
- 前置式洗衣機
- 頂裝式洗衣機
- 洗衣烘乾機
- 烘乾機
- Styler 服裝護理系統
- 清潔設備
- 機器人吸塵器
- 無線手持吸塵器
- 臥式吸塵器
- 蒸氣清潔拖把
- 空調設備
- 空調
- 空氣清淨機
- 除濕機
- 電暖器
- 空氣品質管理系統
- 冷藏庫
- 小型家用電器
- 烹飪用具
- 電鍋
- 咖啡機和濃縮咖啡機
- 攪拌機
- 烤麵包機和三明治機
- 電水壺
- 多功能電鍋/壓力鍋
- 汽船
- 其他
- 個人護理用品
- 吹風機
- 直髮器/美髮器
- 電動剃刀
- 其他
- 水處理設備
- 水質淨化
- 熱水器和飲水機(冷熱水)
- 其他
- 其他小型電子設備
- 烹飪用具
第6章 市場估計與預測:依價格分類,2022-2035年
- 低的
- 中等的
- 高的
第7章 市場估計與預測:依最終用途分類,2022-2035年
- 住宅
- 單人家庭
- 核心家庭
- 多代同堂家庭
- 富裕/高資產家庭
- 商業的
- 飯店業(飯店、度假村)
- 餐飲服務業(餐廳、咖啡館)
- 辦公大樓
- 醫療設施
- 教育機構
- 政府和公共設施
第8章 市場估算與預測:依通路分類,2022-2035年
- 線上
- 電子商務
- 企業網站
- 離線
- 大型零售商店
- 超級市場/大賣場
- 其他
第9章 市場估計與預測:依地區分類,2022-2035年
- 北美洲
- 美國
- 加拿大
- 歐洲
- 德國
- 英國
- 法國
- 義大利
- 西班牙
- 亞太地區
- 中國
- 印度
- 日本
- 韓國
- 澳洲
- 拉丁美洲
- 巴西
- 墨西哥
- 阿根廷
- 中東和非洲(MEA)
- 沙烏地阿拉伯
- 阿拉伯聯合大公國
- 南非
第10章:公司簡介
- BSH Hausgerate
- Electrolux
- Gree Electric Appliances
- Haier Group
- Hitachi
- LG Electronics
- Midea Group
- Miele
- Panasonic
- Robert Bosch
- Samsung Electronics
- Sharp
- Siemens
- Walton Group
- Whirlpool
The Global Electric Household Appliances Market was valued at USD 613.7 billion in 2025 and is estimated to grow at a CAGR of 7.6% to reach USD 1.25 trillion by 2035.
Growth in the electric household appliances market is supported by increasing adoption of smart home technologies that enable seamless connectivity and remote monitoring. Manufacturers are focusing on integrating advanced features such as predictive maintenance, personalized settings, and enhanced automation to improve user experience. Energy efficiency remains a key priority, as companies develop appliances that align with sustainability goals while offering long-term cost savings to consumers. The incorporation of advanced sensors and intelligent systems is improving performance, durability, and operational efficiency. In addition, rising urbanization is influencing product design, leading to the development of compact, multifunctional appliances suited for modern living spaces. Changing consumer preferences toward convenience, connectivity, and environmentally conscious products continue to drive innovation, positioning the global electric household appliances market as a dynamic and rapidly evolving industry.
| Market Scope | |
|---|---|
| Start Year | 2025 |
| Forecast Year | 2026-2035 |
| Start Value | $613.7 Billion |
| Forecast Value | $1.25 Trillion |
| CAGR | 7.6% |
The electric household appliances market is advancing as manufacturers continue to enhance product capabilities and performance. Ongoing innovation in smart technologies and energy-efficient solutions is enabling companies to meet evolving consumer expectations while maintaining competitive differentiation. These developments are supporting increased adoption across both developed and emerging markets.
The large appliances segment generated USD 383.1 billion in 2025 and is expected to grow at a CAGR of 7.4% from 2026 to 2035. This segment holds the largest share of the electric household appliances market due to the essential nature of these products in everyday life. Demand remains steady as consumers prioritize upgrading to more efficient and technologically advanced appliances. Continuous innovation, including integration of smart features and energy optimization, is further strengthening growth within this segment.
The low-price segment accounted for 47.9% share in 2025, making it a leading category within the electric household appliances market. This segment is driven by demand from cost-conscious consumers, particularly in developing regions, where affordability and durability are key purchasing factors. High sales volumes are supported by the widespread need for basic household appliances. Intense competition among manufacturers in this segment is driving a strong focus on cost efficiency, streamlined operations, and effective supply chain management.
United States Electric Household Appliances Market reached USD 91 billion in 2025 and is expected to grow at a CAGR of 7.4% from 2026 to 2035, supported by increasing consumer spending, strong demand for smart and convenient home solutions, and the expansion of digital retail channels. Technological advancements, including AI integration and connected appliance ecosystems, are further encouraging adoption. Growing interest in sustainable products and energy-efficient solutions, combined with evolving consumer lifestyles and increased home improvement activities, is contributing to continued market expansion.
Key companies operating in the Global Electric Household Appliances Market include BSH Hausgerate, Electrolux, Gree Electric Appliances, Haier Group, Hitachi, LG Electronics, Midea Group, Miele, Panasonic, Robert Bosch, Samsung Electronics, Sharp, Siemens, Walton Group, and Whirlpool. Companies in the Global Electric Household Appliances Market are adopting a range of strategic initiatives to strengthen their market position and expand their global footprint. A major focus is placed on innovation, with investments in smart technologies, automation, and energy-efficient solutions to enhance product performance and user experience. Manufacturers are forming strategic partnerships to expand distribution networks and improve market reach. Product diversification and the introduction of multifunctional appliances are helping companies cater to evolving consumer needs. Businesses are also emphasizing sustainability by developing eco-friendly products and complying with energy regulations. Strengthening e-commerce capabilities and improving supply chain efficiency are enabling better product availability. Additionally, companies are enhancing after-sales services and customer support to build long-term brand loyalty and maintain a competitive edge.
Table of Contents
Chapter 1 Methodology & Scope
- 1.1 Market scope & definitions
- 1.2 Research design
- 1.2.1 Research approach
- 1.2.2 Data collection methods
- 1.3 Base estimates and calculations
- 1.3.1 Base year calculation
- 1.3.2 Market estimates & forecasts parameters
- 1.4 Forecast Model
- 1.4.1 Key trends for market estimates
- 1.4.2 Quantified market impact analysis
- 1.4.2.1 Mathematical impact of growth parameters on forecast
- 1.4.3 Scenario analysis framework
- 1.5 Primary research and validation
- 1.5.1 Some of the primary sources (but not limited to)
- 1.6 Data mining sources
- 1.6.1 Paid Sources
- 1.7 Primary research and validation
- 1.7.1 Primary sources
- 1.8 Research Trail & confidence scoring
- 1.8.1 Research trail components
- 1.8.2 Scoring components
- 1.9 Research transparency addendum
- 1.9.1 Source attribution framework
- 1.9.2 Quality assurance metrics
- 1.9.3 Our commitment to trust
- 1.10 Market Definitions
Chapter 2 Executive Summary
- 2.1 Industry 360° synopsis
- 2.2 Key market trends
- 2.2.1 Regional
- 2.2.2 Product type
- 2.2.3 Price
- 2.2.4 End Use
- 2.2.5 Distribution Channel
Chapter 3 Industry Insights
- 3.1 Industry ecosystem analysis
- 3.1.1 Raw material suppliers
- 3.1.2 Manufacturing footprint by region
- 3.1.3 Distribution network structure
- 3.1.4 Profit margin analysis by value chain stage
- 3.1.5 Value addition at each stage
- 3.1.6 Factor affecting the value chain
- 3.2 Industry impact forces
- 3.2.1 Growth drivers
- 3.2.1.1 Technological advancements
- 3.2.1.2 Urbanization & changing lifestyles
- 3.2.1.3 Rising disposable income
- 3.2.2 Pitfalls & challenges
- 3.2.2.1 High initial costs
- 3.2.2.2 Regulatory complexity
- 3.2.3 Opportunities
- 3.2.3.1 Smart & connected appliances
- 3.2.3.2 Energy-efficient & sustainable solutions
- 3.2.1 Growth drivers
- 3.3 Growth potential analysis
- 3.4 Future market trends
- 3.5 Technology and innovation landscape
- 3.5.1 Current technological trends
- 3.5.2 Emerging technologies
- 3.6 Price trends
- 3.6.1 By region
- 3.6.2 By product
- 3.6.3 Historical price trend analysis
- 3.6.4 Pricing strategy by player type
- 3.7 Regulatory landscape
- 3.7.1 Global energy efficiency standards landscape
- 3.7.2 Regional regulatory frameworks
- 3.7.2.1 North America
- 3.7.2.2 Europe
- 3.7.2.3 Asia Pacific
- 3.7.2.4 Latin America
- 3.7.2.5 Middle East & Africa
- 3.7.3 Safety & product standards
- 3.7.4 Environmental & recycling regulations
- 3.7.5 Trade policies & tariff landscape
- 3.7.6 Emerging regulations
- 3.8 Trade data analysis (driven by primary research) - (HS Code - 8509.90)
- 3.8.1 Global import/export volume & value trends
- 3.8.2 Key trade corridors & partners
- 3.8.3 Tariff structure & impact by region
- 3.8.4 Trade balance analysis by country & product category
- 3.8.5 Impact of trade agreements
- 3.9 Impact of AI & Generative AI on the Market
- 3.9.1 GenAI use cases & adoption roadmap by segment
- 3.9.2 AI in product development & personalization
- 3.9.3 AI in manufacturing & supply chain optimization
- 3.9.4 Risks, limitations & regulatory considerations
- 3.10 Supply chain analysis
- 3.10.1 Global component sourcing dynamics
- 3.10.2 Key component suppliers by region
- 3.10.3 Manufacturing & Assembly locations
- 3.10.4 Logistics & distribution infrastructure
- 3.10.5 Supply chain disruption risks & resilience
- 3.10.6 Nearshoring & reshoring trends
- 3.10.7 Critical material dependencies
- 3.11 Distribution infrastructure & channel penetration landscape
- 3.11.1 Channel coverage by region & format (modern vs traditional trade)
- 3.11.2 Last-mile infrastructure & delivery models
- 3.11.3 Installation & after-sales service network density
- 3.11.4 E-commerce fulfillment infrastructure by region
- 3.12 Porter's analysis
- 3.13 PESTEL analysis
Chapter 4 Competitive Landscape, 2025
- 4.1 Introduction
- 4.2 Company market share analysis
- 4.2.1 By Region
- 4.2.1.1 North America
- 4.2.1.2 Europe
- 4.2.1.3 Asia Pacific
- 4.2.1.4 Latin America
- 4.2.1.5 Middle East & Africa
- 4.2.1 By Region
- 4.3 Company matrix analysis
- 4.4 Competitive analysis of major market players
- 4.5 Competitive positioning matrix
- 4.6 Key developments
- 4.6.1 Mergers & acquisitions
- 4.6.2 Partnerships & collaborations
- 4.6.3 New product launches
- 4.6.4 Expansion plans
Chapter 5 Market Estimates & Forecast, By Type, 2022 - 2035, (USD Billion) (Million Units)
- 5.1 Key trends
- 5.2 Large appliances
- 5.2.1 Refrigerators
- 5.2.1.1 French door
- 5.2.1.2 Side-by-side
- 5.2.1.3 Top-mount
- 5.2.1.4 Mini/compact refrigerators
- 5.2.2 Cooking appliances
- 5.2.2.1 Electric ranges
- 5.2.2.2 Built-in ovens
- 5.2.2.3 Induction cooktops
- 5.2.2.4 Microwave ovens
- 5.2.2.5 Combination ovens
- 5.2.3 Laundry appliances
- 5.2.3.1 Front-load washers
- 5.2.3.2 Top-load washers
- 5.2.3.3 Washer-dryer combos
- 5.2.3.4 Dryers
- 5.2.3.5 Styler/garment care systems
- 5.2.4 Cleaning appliances
- 5.2.4.1 Robot vacuum cleaners
- 5.2.4.2 Cordless stick vacuums
- 5.2.4.3 Canister vacuums
- 5.2.4.4 Steam cleaners/mops
- 5.2.5 Climate control appliances
- 5.2.5.1 Air conditioners
- 5.2.5.2 Air purifiers
- 5.2.5.3 Dehumidifiers
- 5.2.5.4 Electric heaters
- 5.2.5.5 Air quality management systems
- 5.2.1 Refrigerators
- 5.3 Small appliances
- 5.3.1 Food preparation appliances
- 5.3.1.1 Electric rice cookers
- 5.3.1.2 Coffee makers & espresso machines
- 5.3.1.3 Blenders & mixers
- 5.3.1.4 Toasters & sandwich makers
- 5.3.1.5 Electric kettles
- 5.3.1.6 Multi-cookers & pressure cookers
- 5.3.1.7 Food steamers
- 5.3.1.8 Others
- 5.3.2 Personal care appliances
- 5.3.2.1 Hair dryers
- 5.3.2.2 Hair straighteners & curling irons
- 5.3.2.3 Electric shavers
- 5.3.2.4 Others
- 5.3.3 Water treatment appliances
- 5.3.3.1 Water purifiers
- 5.3.3.2 Water dispensers (hot & cold)
- 5.3.3.3 Others
- 5.3.3.4 Other small appliances
- 5.3.1 Food preparation appliances
Chapter 6 Market Estimates & Forecast, By Price, 2022 - 2035, (USD Billion) (Million Units)
- 6.1 Key trends
- 6.2 Low
- 6.3 Medium
- 6.4 High
Chapter 7 Market Estimates & Forecast, By End Use, 2022 - 2035, (USD Billion) (Million Units)
- 7.1 Key trends
- 7.2 Residential
- 7.2.1 Single-person households
- 7.2.2 Nuclear families
- 7.2.3 Multi-generational households
- 7.2.4 Affluent/high-net-worth households
- 7.3 Commercial
- 7.3.1 Hospitality (hotels, resorts)
- 7.3.2 Food service (restaurants, cafes)
- 7.3.3 Office buildings
- 7.3.4 Healthcare facilities
- 7.3.5 Educational institutions
- 7.3.6 Government/public buildings
Chapter 8 Market Estimates & Forecast, By Distribution Channel, 2022 - 2035, (USD Billion) (Million Units)
- 8.1 Key trends
- 8.2 Online
- 8.2.1 E-commerce
- 8.2.2 Company website
- 8.3 Offline
- 8.3.1 Mega retail stores
- 8.3.2 Supermarket/hypermarket stores
- 8.3.3 Others
Chapter 9 Market Estimates & Forecast, By Region, 2022 - 2035, (USD Billion) (Million Units)
- 9.1 Key trends
- 9.2 North America
- 9.2.1 U.S.
- 9.2.2 Canada
- 9.3 Europe
- 9.3.1 Germany
- 9.3.2 UK
- 9.3.3 France
- 9.3.4 Italy
- 9.3.5 Spain
- 9.4 Asia Pacific
- 9.4.1 China
- 9.4.2 India
- 9.4.3 Japan
- 9.4.4 South Korea
- 9.4.5 Australia
- 9.5 Latin America
- 9.5.1 Brazil
- 9.5.2 Mexico
- 9.5.3 Argentina
- 9.6 MEA
- 9.6.1 Saudi Arabia
- 9.6.2 UAE
- 9.6.3 South Africa
Chapter 10 Company Profiles
- 10.1 BSH Hausgerate
- 10.2 Electrolux
- 10.3 Gree Electric Appliances
- 10.4 Haier Group
- 10.5 Hitachi
- 10.6 LG Electronics
- 10.7 Midea Group
- 10.8 Miele
- 10.9 Panasonic
- 10.10 Robert Bosch
- 10.11 Samsung Electronics
- 10.12 Sharp
- 10.13 Siemens
- 10.14 Walton Group
- 10.15 Whirlpool


