


 |
市場調查報告書
商品編碼
2027544
阻燃劑市場機會、成長促進因素、產業趨勢分析及2026-2035年預測。Textile Flame Retardants Market Opportunity, Growth Drivers, Industry Trend Analysis, and Forecast 2026 - 2035 |
||||||
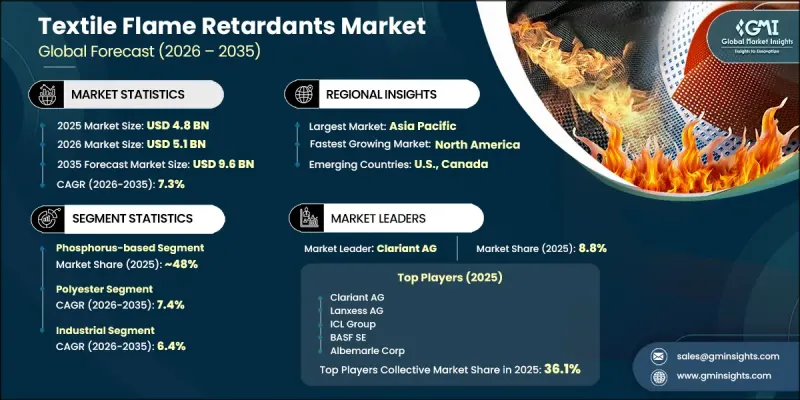
2025年全球紡織品阻燃劑市場規模預估為48億美元,預計2035年將以7.3%的複合年成長率成長至96億美元。
市場擴張主要得益於配方技術的重大變革,即從傳統的滷素化合物轉向更永續、更環保的替代品。日益嚴格的環境法規以及整個產業對永續發展的永續性關注,正在加速磷基和氮基阻燃系統的普及應用。在防火安全標準要求極高的工業環境中,對阻燃纖維的需求尤其旺盛。在能源、化學和製造等行業,防護纖維對於保障工人安全和降低營運風險至關重要,因此得到了廣泛應用。主要經濟體積極的基礎建設進一步推動了產品的普及。在北美和歐洲等已開發地區,嚴格的安全標準和法規結構持續推動工業活動的普及。同時,在拉丁美洲、中東和非洲等新興地區,隨著人們對防火安全和防護紡織品應用的認知不斷提高,阻燃產品的普及率也逐漸提升。此外,織物加工和化學成分技術的不斷進步,也提高了阻燃解決方案的耐久性、效率和環境友善性。
| 市場範圍 | |
|---|---|
| 開始年份 | 2025 |
| 預測期 | 2026-2035 |
| 起始金額 | 48億美元 |
| 預測金額 | 96億美元 |
| 複合年成長率 | 7.3% |
預計到2025年,聚酯纖維市佔率將達到40%,並在2026年至2035年間以7.4%的複合年成長率成長。聚酯纖維和棉織物仍然是服裝、室內裝飾和工業應用領域最廣泛使用的紡織材料,這推動了對阻燃處理的強勁需求。棉纖維尤其如此,因為它們需要化學處理才能達到阻燃性能,因此是阻燃解決方案的主要應用領域。紡織製造業的持續成長和安全標準的不斷提高進一步推動了對這些纖維的需求。
預計2025年,工業應用領域市場規模將達到12億美元,2035年將達23億美元,複合年成長率(CAGR)為6.4%。由於職業安全標準日益嚴格,能源設施、化工廠和生產現場等工業環境對阻燃纖維的需求強勁。阻燃纖維廣泛應用於防護衣和安全設備,以降低火災風險。國防應用領域也貢獻顯著,阻燃纖維被用於防護衣、設備和內部裝潢建材,旨在提高高風險環境中人員的安全。
預計2026年至2035年,北美紡織品阻燃劑市場將以7%的複合年成長率成長。該地區受惠於完善的消防安全法規,以及能源、國防、航空和公共安全等產業對防護性紡織品的強勁工業需求。美國因其嚴格的職業安全標準和高風險產業對阻燃紡織品的廣泛應用,成為該地區消費的主要驅動力。對職場安全和法規遵循的日益重視,將繼續推動全部區域市場的穩定成長。
目錄
第1章:調查方法和範圍
第2章執行摘要
第3章業界考察
- 產業生態系分析
- 供應商情況
- 利潤率
- 每個階段增加的價值
- 影響價值鏈的因素
- 中斷
- 影響產業的因素
- 成長促進因素
- 產業潛在風險與挑戰
- 市場機遇
- 成長潛力分析
- 監理情勢
- 北美洲
- 歐洲
- 亞太地區
- 拉丁美洲
- 中東和非洲
- 波特的分析
- PESTEL 分析
- 價格趨勢
- 按地區
- 依產品類型
- 未來市場趨勢
- 科技與創新趨勢
- 當前技術趨勢
- 新興技術
- 專利趨勢
- 貿易統計(HS編碼)
- 主要進口國
- 主要出口國
- 永續性和環境方面
- 永續計劃
- 減少廢棄物策略
- 生產中的能源效率
- 環保意識的舉措
第4章 競爭情勢
- 介紹
- 企業市佔率分析
- 按地區
- 北美洲
- 歐洲
- 亞太地區
- 拉丁美洲
- 中東和非洲
- 按地區
- 企業矩陣分析
- 主要市場公司的競爭分析
- 競爭定位矩陣
- 主要進展
- 併購
- 夥伴關係與合作
- 新產品發布
- 業務拓展計劃
第5章 市場估算與預測:依產品類型分類,2022-2035年
- 鹵素
- 溴
- 氯基
- 磷
- 有機的
- 無機物
- 氮基
- 三聚氰胺衍生物
- 胍類化合物
- 其他(礦物基、膨脹型、生物基)
第6章 市場估算與預測:依紡織材料分類,2022-2035年
- 聚酯纖維
- 棉布
- 黏膠纖維
- 尼龍 6
- 尼龍 6,6
- 其他(羊毛、芳香聚醯胺、特殊纖維)
第7章 市場估計與預測:依最終用戶分類,2022-2035年
- 產業
- 石油和天然氣
- 化工廠
- 製造工廠
- 防禦
- 軍裝
- 防護工具
- 軍用車輛內部
- 公共安全與服務
- 消防隊員用個人防護裝備
- 警察和執法機關
- 緊急醫療服務
- 運輸
- 航空
- 鐵路
- 車
- 船
- 家用
- 家具和室內裝飾
- 寢具和床墊
- 窗簾和帷幔
- 其他(飯店、醫療保健、公共設施)
第8章 市場估計與預測:依地區分類,2022-2035年
- 北美洲
- 美國
- 加拿大
- 歐洲
- 德國
- 英國
- 法國
- 西班牙
- 義大利
- 其他歐洲地區
- 亞太地區
- 中國
- 印度
- 日本
- 澳洲
- 韓國
- 亞太其他地區
- 拉丁美洲
- 巴西
- 墨西哥
- 阿根廷
- 其他拉丁美洲地區
- 中東和非洲
- 沙烏地阿拉伯
- 南非
- 阿拉伯聯合大公國
- 其他中東和非洲地區
第9章:公司簡介
- Clariant AG
- Lanxess AG
- ICL Group
- Albemarle Corporation
- BASF SE
- Thor Group
- Daihachi Chemical Industry Co., Ltd.
- Italmatch Chemicals
- Shandong Moris Tech Co., Ltd.
- Jinan Taixing Fine Chemicals Co., Ltd.
- Greenchemicals Srl
- Presafer(Qingyuan)Phosphor Chemical Co., Ltd.
The Global Textile Flame Retardants Market was valued at USD 4.8 billion in 2025 and is estimated to grow at a CAGR of 7.3% to reach USD 9.6 billion by 2035.
Market expansion is driven by a significant transition in formulation technologies, moving away from conventional halogen-based compounds toward more sustainable and environmentally safer alternatives. The growing adoption of phosphorus-based and nitrogen-based flame retardant systems is gaining strong momentum due to tightening environmental regulations and rising sustainability concerns across industries. Demand for flame-retardant textiles is particularly strong in industrial environments where fire safety compliance is critical. Heavy usage is observed across sectors such as energy, chemicals, and manufacturing, where protective textiles are essential for worker safety and operational risk mitigation. Strong infrastructure development activities across major economies are further supporting product adoption. Developed regions such as North America and Europe continue to lead adoption due to stringent safety standards and regulatory frameworks governing industrial operations. At the same time, emerging regions such as Latin America and the Middle East & Africa are gradually increasing adoption as awareness of fire safety and protective textile applications continues to grow. Ongoing technological advancements in fabric treatment and chemical formulations are also improving the durability, efficiency, and environmental compatibility of flame-retardant solutions.
| Market Scope | |
|---|---|
| Start Year | 2025 |
| Forecast Year | 2026-2035 |
| Start Value | $4.8 Billion |
| Forecast Value | $9.6 Billion |
| CAGR | 7.3% |
The polyester segment accounted for a 40% share in 2025 and is projected to grow at a CAGR of 7.4% during 2026 to 2035. Polyester and cotton fabrics remain the most widely used textile materials across apparel, home furnishings, and industrial applications, driving strong demand for flame-retardant treatments. Cotton-based textiles in particular require chemical enhancement to achieve fire resistance, making them a key application area for flame-retardant solutions. Continuous growth in textile manufacturing and rising safety requirements are further supporting demand across these fabric types.
The industrial application segment reached USD 1.2 billion in 2025 and is projected to reach USD 2.3 billion by 2035, growing at a CAGR of 6.4%. Industrial environments, including energy facilities, chemical processing plants, and production units, generate strong demand due to strict occupational safety standards. Flame-retardant textiles are widely used in protective clothing and safety equipment to reduce fire-related risks. Defense-related applications also contribute significantly, with usage in protective uniforms, equipment, and interior materials designed to enhance personnel safety in high-risk environments.
North America Textile Flame Retardants Market is expected to grow at a CAGR of 7% during 2026-2035. The region benefits from well-established fire safety regulations and strong industrial demand for protective textiles across sectors such as energy, defense, aviation, and public safety. The United States leads regional consumption due to strict occupational safety standards and widespread adoption of flame-resistant textiles across high-risk industries. Increasing emphasis on workplace safety and regulatory compliance continues to drive steady market growth across the region.
Key companies operating in the Global Textile Flame Retardants Market include Clariant AG, Lanxess AG, ICL Group, Albemarle Corporation, BASF SE, Thor Group, Daihachi Chemical Industry Co., Ltd., Italmatch Chemicals, Shandong Moris Tech Co., Ltd., Jinan Taixing Fine Chemicals Co., Ltd., Greenchemicals S.r.l., and Presafer (Qingyuan) Phosphor Chemical Co., Ltd. Companies in the Textile Flame Retardants Market are focusing on strengthening their market position through the development of eco-friendly chemical formulations, expansion of production capacities, and continuous research and development initiatives. Manufacturers are increasingly shifting toward halogen-free solutions, particularly phosphorus- and nitrogen-based compounds, to align with environmental regulations and sustainability goals. Strategic collaborations with textile manufacturers and industrial end users are helping companies expand application reach and improve product integration. Investment in advanced chemical engineering and fabric treatment technologies is enhancing product efficiency, durability, and safety performance. Companies are also expanding their global distribution networks to improve market accessibility. In addition, emphasis on regulatory compliance and certification standards is enabling stronger market acceptance. Continuous innovation in sustainable chemistry and customized flame-retardant solutions is further helping companies strengthen competitiveness and long-term market presence across diverse industrial sectors.
Table of Contents
Chapter 1 Methodology & Scope
- 1.1 Research approach
- 1.2 Quality Commitments
- 1.2.1 GMI AI policy & data integrity commitment
- 1.2.1.1 Source consistency protocol
- 1.2.1 GMI AI policy & data integrity commitment
- 1.3 Research Trail & Confidence Scoring
- 1.3.1 Research Trail Components
- 1.3.2 Scoring Components
- 1.4 Data Collection
- 1.4.1 Partial list of primary sources
- 1.5 Data mining sources
- 1.5.1 Paid sources
- 1.5.1.1 Sources, by region
- 1.5.1 Paid sources
- 1.6 Base estimates and calculations
- 1.6.1 Base year calculation for any one approach
- 1.7 Forecast model
- 1.7.1 Quantified market impact analysis
- 1.7.1.1 Mathematical impact of growth parameters on forecast
- 1.7.1 Quantified market impact analysis
- 1.8 Research transparency addendum
- 1.8.1 Source attribution framework
- 1.8.2 Quality assurance metrics
- 1.8.3 Our commitment to trust
Chapter 2 Executive Summary
- 2.1 Industry 360° synopsis
- 2.2 Key market trends
- 2.2.1 Regional
- 2.3 TAM Analysis, 2025-2035
- 2.4 CXO perspectives: Strategic imperatives
Chapter 3 Industry Insights
- 3.1 Industry ecosystem analysis
- 3.1.1 Supplier landscape
- 3.1.2 Profit margin
- 3.1.3 Value addition at each stage
- 3.1.4 Factor affecting the value chain
- 3.1.5 Disruptions
- 3.2 Industry impact forces
- 3.2.1 Growth drivers
- 3.2.2 Industry pitfalls and challenges
- 3.2.3 Market opportunities
- 3.3 Growth potential analysis
- 3.4 Regulatory landscape
- 3.4.1 North America
- 3.4.2 Europe
- 3.4.3 Asia Pacific
- 3.4.4 Latin America
- 3.4.5 Middle East & Africa
- 3.5 Porter’s analysis
- 3.6 PESTEL analysis
- 3.7 Price trends
- 3.7.1 By region
- 3.7.2 By product type
- 3.8 Future market trends
- 3.9 Technology and Innovation landscape
- 3.9.1 Current technological trends
- 3.9.2 Emerging technologies
- 3.10 Patent Landscape
- 3.11 Trade statistics (HS code)
- 3.11.1 Major importing countries
- 3.11.2 Major exporting countries
- 3.12 Sustainability and environmental aspects
- 3.12.1 Sustainable practices
- 3.12.2 Waste reduction strategies
- 3.12.3 Energy efficiency in production
- 3.12.4 Eco-friendly initiatives
Chapter 4 Competitive Landscape, 2025
- 4.1 Introduction
- 4.2 Company market share analysis
- 4.2.1 By region
- 4.2.1.1 North America
- 4.2.1.2 Europe
- 4.2.1.3 Asia Pacific
- 4.2.1.4 LATAM
- 4.2.1.5 MEA
- 4.2.1 By region
- 4.3 Company matrix analysis
- 4.4 Competitive analysis of major market players
- 4.5 Competitive positioning matrix
- 4.6 Key developments
- 4.6.1 Mergers & acquisitions
- 4.6.2 Partnerships & collaborations
- 4.6.3 New Product Launches
- 4.6.4 Expansion Plans
Chapter 5 Market Estimates and Forecast, By Product Type, 2022-2035 (USD Billion) (Kilo Tons)
- 5.1 Key trends
- 5.2 Halogenated
- 5.2.1 Brominated
- 5.2.2 Chlorinated
- 5.3 Phosphorus-based
- 5.3.1 Organic
- 5.3.2 Inorganic
- 5.4 Nitrogen-based
- 5.4.1 Melamine Derivatives
- 5.4.2 Guanidine Compounds
- 5.5 Others (Mineral, Intumescent, Bio-based)
Chapter 6 Market Estimates and Forecast, By Textile Material, 2022-2035 (USD Billion) (Kilo Tons)
- 6.1 Key trends
- 6.2 Polyester
- 6.3 Cotton
- 6.4 Viscose
- 6.5 Nylon 6
- 6.6 Nylon 6,6
- 6.7 Others (Wool, Aramids, Specialty)
Chapter 7 Market Estimates and Forecast, By End User, 2022-2035 (USD Billion) (Kilo Tons)
- 7.1 Key trends
- 7.2 Industrial
- 7.2.1 Oil & Gas
- 7.2.2 Chemical Plants
- 7.2.3 Manufacturing Facilities
- 7.3 Defense
- 7.3.1 Military Uniforms
- 7.3.2 Protective Gear
- 7.3.3 Military Vehicle Interiors
- 7.4 Public Safety & Services
- 7.4.1 Firefighter PPE
- 7.4.2 Police & Law Enforcement
- 7.4.3 Emergency Medical Services
- 7.5 Transportation
- 7.5.1 Aviation
- 7.5.2 Rail
- 7.5.3 Automotive
- 7.5.4 Marine
- 7.6 Household
- 7.6.1 Furniture & Upholstery
- 7.6.2 Bedding & Mattresses
- 7.6.3 Curtains & Draperies
- 7.7 Others (Hospitality, Healthcare, Institutional)
Chapter 8 Market Estimates and Forecast, By Region, 2022-2035 (USD Billion) (Kilo Tons)
- 8.1 Key trends
- 8.2 North America
- 8.2.1 U.S.
- 8.2.2 Canada
- 8.3 Europe
- 8.3.1 Germany
- 8.3.2 UK
- 8.3.3 France
- 8.3.4 Spain
- 8.3.5 Italy
- 8.3.6 Rest of Europe
- 8.4 Asia Pacific
- 8.4.1 China
- 8.4.2 India
- 8.4.3 Japan
- 8.4.4 Australia
- 8.4.5 South Korea
- 8.4.6 Rest of Asia Pacific
- 8.5 Latin America
- 8.5.1 Brazil
- 8.5.2 Mexico
- 8.5.3 Argentina
- 8.5.4 Rest of Latin America
- 8.6 Middle East and Africa
- 8.6.1 Saudi Arabia
- 8.6.2 South Africa
- 8.6.3 UAE
- 8.6.4 Rest of Middle East and Africa
Chapter 9 Company Profiles
- 9.1 Clariant AG
- 9.2 Lanxess AG
- 9.3 ICL Group
- 9.4 Albemarle Corporation
- 9.5 BASF SE
- 9.6 Thor Group
- 9.7 Daihachi Chemical Industry Co., Ltd.
- 9.8 Italmatch Chemicals
- 9.9 Shandong Moris Tech Co., Ltd.
- 9.10 Jinan Taixing Fine Chemicals Co., Ltd.
- 9.11 Greenchemicals S.r.l.
- 9.12 Presafer (Qingyuan) Phosphor Chemical Co., Ltd.
 紡織品阻燃劑市場:按類型、技術、纖維類型、最終用途和應用分類-2026-2032年全球市場預測阻燃纖維市場:2026-2032年全球市場預測(依纖維類型、纖維結構、塗層類型、電弧熱性能評估、終端用戶產業、應用和分銷管道分類)
 阻燃纖維市場規模、佔有率、成長和全球產業分析:按類型、應用和地區分類,並對 2026-2034 年進行洞察和預測。全球永久性阻燃纖維市場規模、佔有率、趨勢和成長分析報告(2026-2034年)全球阻燃纖維市場規模、佔有率、趨勢和成長分析報告(2026-2034)
 日本防火防護衣市場規模、佔有率、趨勢及預測(按產品類型、材料類型、分銷管道、應用、最終用戶和地區分類,2026-2034年)阻燃一次性防護連身工作服市場按產品類型、分銷管道、應用和最終用途行業分類,全球預測(2026-2032年)
 阻燃織物市場規模、佔有率和成長分析(按材料類型、應用、加工方法、最終用途產業和地區分類)-產業預測,2026-2033年
 全球阻燃織物市場
 芳香聚醯胺阻燃織帶市場報告:2031 年趨勢、預測與競爭分析