

 |
市場調查報告書
商品編碼
2027522
2026 年至 2035 年園藝工具市場的商業機會、成長要素、產業趨勢分析與預測。Gardening Tools Market Opportunity, Growth Drivers, Industry Trend Analysis, and Forecast 2026 - 2035 |
||||||
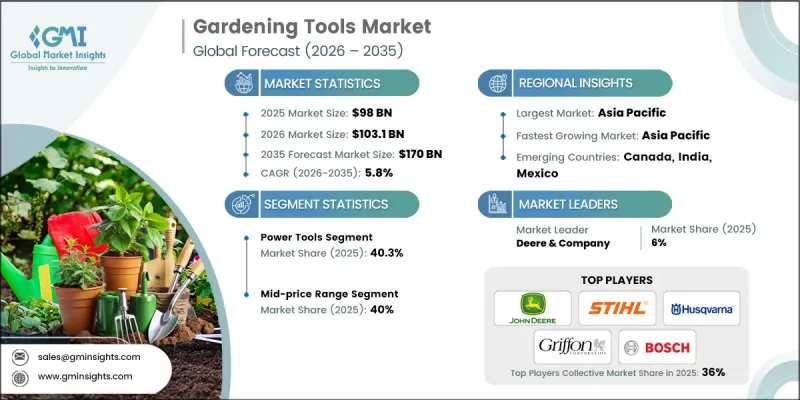
2025年全球園藝工具市場價值為980億美元,預計2035年將以5.8%的複合年成長率成長至1,700億美元。
園藝工具市場正經歷重大變革,三大關鍵趨勢正在重塑全球園藝工具的設計、生產和使用方式。首先,傳統的重型動力來源工具正被更輕、更環保、更符合人體工學的替代品所取代。製造商現在提供配備感測器和碳纖維手柄的電池供電工具,這些工具在提供媲美甚至超越傳統工具性能的同時,也提高了耐用性、能源效率和用戶舒適度。鋰離子電池和無刷馬達技術的進步使電動工具的效率達到90%至95%,與傳統的汽油動力工具相當甚至更高,同時降低了噪音和環境影響。另一個主要趨勢是採用模組化、多功能附件工具,這些工具由通用電池平台供電。這些系統允許多種工具(例如修剪機、鏈鋸、吹風機和邊緣修剪器)使用同一塊電池運行,從而降低了儲存、運輸和購買成本,同時提高了家庭用戶和專業人士的便利性。
| 市場規模 | |
|---|---|
| 開始年份 | 2025 |
| 預測期 | 2026-2035 |
| 上市時的市場規模 | 980億美元 |
| 預計金額 | 1700億美元 |
| 複合年成長率 | 5.8% |
到2025年,電動工具市佔率將達到40.3%,這反映出消費者對高性能無線工具日益成長的需求。這些工具能夠輕鬆完成繁重的園藝工作,深受從專業庭園設計師到DIY愛好者等各類使用者的青睞。它們的多功能性、高效性和便利性使其成為住宅和商業用途的理想之選,進一步鞏固了其市場主導地位。
到2025年,中價位產品將佔據40%的市場。推動這一細分市場成長的因素之一是越來越多的消費者尋求兼顧價格和耐用性的產品,尤其是那些希望獲得高品質工具但又不想花費太多的「專業消費者」。中價位工具兼具可靠性和性能,能夠滿足從業餘愛好者到半專業人士等各類用戶的需求,並推動市場穩步成長。
美國園藝工具市場預計到2025年將達到2,28億美元(市佔率達88.6%),並在2035年之前以6.2%的複合年成長率成長。這一成長主要得益於蓬勃發展的DIY文化、電池驅動工具日益普及以及將草坪改造成個性化花園空間的趨勢。千禧世代的住宅和都市區園藝愛好者是市場需求的主要驅動力,而完善的零售基礎設施,包括大規模家居建材商店和強大的電子商務生態系統,確保了消費者能夠便捷地購買到手動工具和電動工具。此外,符合人體工學的設計和智慧園藝技術的快速普及縮短了更換週期,從而帶動了住宅和專業園林綠化工具銷量的成長。
目錄
第1章:調查方法
- 研究途徑
- 品質改進計劃
- GMI人工智慧政策和資料完整性計劃
- 資訊來源一致性協議
- GMI人工智慧政策和資料完整性計劃
- 調查軌跡和置信度評分
- 調查和路線的組成部分
- 評分組成部分
- 數據收集
- 主要來源部分列表
- 資料探勘資訊來源
- 付費資訊來源
- 區域資訊來源
- 付費資訊來源
- 基本估算和計算方法
- 每種方法中基準年的計算
- 預測模型
- 量化市場影響分析
- 生長參數對預測的數學影響
- 量化市場影響分析
- 關於調查透明度的補充信息
- 資訊來源歸屬框架
- 品質保證指標
- 對信任的承諾
第2章執行摘要
第3章業界考察
- 生態系分析
- 影響價值鏈的因素
- 按價值鏈階段分類的利潤率分析(基於初步調查)
- 中斷
- 製造商
- 銷售代理
- 影響產業的因素
- 促進因素
- 產業潛在風險與挑戰
- 機會
- 成長潛力分析
- 供應鏈分析
- 全球供應鏈結構
- 原料採購(鋼鐵、鋁、塑膠、電子元件)
- 零件製造和分級供應商網路
- 組裝和生產場地
- 中國採購趨勢與風險
- 退出中國和「中國+1」戰略
- 其他製造地(墨西哥、台灣、越南、印度)
- 科技與創新趨勢
- 當前技術趨勢
- 新興技術
- 價格趨勢分析(基於初步調查)
- 過去價格趨勢分析(基於初步調查)(2022-2025 年)
- 根據業務類型分類的定價策略(高階/價值/成本加成)(基於初步調查)
- 價格波動與產品類型和最終用途有關。
- 區域價格基準
- 原物料成本對價格的影響
- 區域價格波動與購買力平價
- 自有品牌和品牌商品的價格趨勢
- 監理情勢
- 全球監理情勢
- 北美(美國環保署、消費品安全委員會、職業安全與健康管理局)
- 歐洲(CE標誌、REACH、RoHS)
- 亞太地區
- 中國標準(GB、CCC)
- 日本標準(JIS、PSE)
- 台灣標準和進口要求
- 印度標準局 (BIS)
- 拉丁美洲(南方共同市場法規、巴西國家衛生監督局)
- 中東和非洲(海灣合作理事會標準,SASO)
- 標籤和安全資訊揭露要求
- 對市場准入及產品開發的影響
- 全球監理情勢
- 專利趨勢(基於初步調查)
- 按技術領域分類的專利申請趨勢(2022-2025)
- 領先的專利擁有者和創新領導者
- 依技術領域分析(手動工具與電動工具)
- 專利活動的地理分佈
- 關鍵專利引用與閒置頻段分析
- 新興技術(機器人、物聯網、電池技術)專利
- 波特的分析
- PESTEL 分析
- 貿易數據分析(基於付費資料庫)
- 2022-2025年進出口數量及價值趨勢
- 主要貿易走廊和路線
- 中國對北美和歐洲的貿易流量
- 台灣的出口市場及製造業的作用
- 從墨西哥到美國(美墨加協定的益處)
- 亞洲內部貿易趨勢
- HS編碼分類與關稅結構
- 按產品類型分類的關稅影響分析
- 非關稅壁壘和貿易限制
- 貿易政策變化及未來展望(2025-2027)
- 人工智慧和生成式人工智慧對市場的影響
- 利用人工智慧改造現有經營模式
- 針對特定領域的生成式人工智慧應用案例和實施藍圖
- 生產能力和生產趨勢(基於初步調查)
- 按地區和主要製造商分類的運作產能(基於初步調查)
- 北美製造地
- 歐洲製造地
- 亞太地區的製造地(中國、台灣、越南、印度)
- 運轉率和擴張計劃(基於初步調查)
- 按地區和主要製造商分類的運作產能(基於初步調查)
第4章 競爭情勢
- 介紹
- 企業市佔率分析
- 按地區
- 北美洲
- 歐洲
- 亞太地區
- 中國
- 印度
- 日本
- 韓國
- 澳洲
- 台灣
- 中東和非洲
- 拉丁美洲
- 按地區
- 競爭定位矩陣
- 戰略展望矩陣
- 企業矩陣分析
- 主要進展
- 併購
- 夥伴關係與合作
- 新產品發布
- 業務拓展計劃
第5章 市場估算與預測:依產品類型分類,2022-2035年
- 手動工具
- 鐵鍬和鐵鍬
- 修枝剪和修枝剪刀
- 耙
- 鏝
- 鋤
- 叉
- 電動工具
- 割草機
- 吹葉機
- 綠籬修剪機
- 耕耘機
- 噴淋系統
- 軟管
- 噴灌
- 噴壺
- 滴灌系統
- 其他
- 植物支撐結構
- 園藝手套
- 工具存放
- 堆肥容器
第6章 市場估計與預測:依價格區間分類,2022-2035年
- 低價位
- 中價位
- 高價位範圍
第7章 市場估計與預測:依最終用途分類,2022-2035年
- 住宅
- 獨立式住宅
- 多用戶住宅和公寓
- 城市園藝和屋頂花園
- 商業的
- 專業庭園綠化服務
- 地方和政府所有的房產
- 高爾夫球場和體育設施
- 飯店及餐飲業
- 企業園區及商務園區
第8章 市場估算與預測:依通路分類,2022-2035年
- 線上
- 電子商務
- 企業網站
- 離線
- 超級市場
- 專賣店
- 其他(百貨公司等)
第9章 市場估計與預測:依地區分類,2022-2035年
- 北美洲
- 美國
- 加拿大
- 歐洲
- 英國
- 德國
- 法國
- 義大利
- 西班牙
- 俄羅斯
- 亞太地區
- 中國
- 印度
- 日本
- 韓國
- 澳洲
- 台灣
- 拉丁美洲
- 巴西
- 墨西哥
- 中東和非洲(MEA)
- 南非
- 沙烏地阿拉伯
- 阿拉伯聯合大公國
第10章:公司簡介
- AriensCo
- Briggs &Stratton LLC
- Bully Tools Inc.
- Deere &Company
- Fiskars Corporation
- Griffon Corporation Inc.
- Honda Motor Co. Ltd.
- Husqvarna AB
- Kubota Corporation
- Makita Corporation
- Robert Bosch GmbH
- Stanley Black &Decker Inc.
- STIHL Holding AG &Co. KG
- Techtronic Industries Co. Ltd.(TTI)
- The Toro Company
- Yamabiko Corporation
- Zenport Industries
The Global Gardening Tools Market was valued at USD 98 billion in 2025 and is estimated to grow at a CAGR of 5.8% to reach USD 170 billion by 2035.
The market is undergoing a significant transformation, driven by three key trends that are reshaping the design, production, and use of gardening tools worldwide. First, traditional heavy, fuel-powered tools are being replaced by lighter, eco-friendly, and ergonomically optimized alternatives. Manufacturers are now offering carbon-fiber-handled, battery-operated, sensor-enabled tools that deliver equal or higher performance while improving durability, energy efficiency, and user comfort. Advances in lithium-ion battery and brushless motor technologies allow electric tools to achieve 90%-95% efficiency of conventional gasoline tools while reducing noise and environmental impact. Another major trend is the adoption of modular, multi-attachment tools powered by universal battery platforms. These systems allow a single battery to operate multiple tools such as trimmers, chainsaws, blowers, and edgers, cutting storage, transport, and purchase costs while enhancing convenience for both homeowners and professionals.
| Market Scope | |
|---|---|
| Start Year | 2025 |
| Forecast Year | 2026-2035 |
| Start Value | $98 Billion |
| Forecast Value | $170 Billion |
| CAGR | 5.8% |
The power tools segment accounted for 40.3% share in 2025, reflecting growing consumer demand for high-performance, cordless equipment. These tools handle heavy-duty gardening tasks with minimal physical effort, appealing to professional landscapers and DIY enthusiasts alike. Their versatility, efficiency, and convenience make them the preferred choice in both residential and commercial settings, reinforcing their dominance in the market.
The mid-price range segment held a 40% share in 2025. This segment attracts consumers seeking a balance between affordability and durability, particularly the growing "prosumer" demographic that demands high-quality tools without a premium price tag. Mid-range tools offer reliability and performance, meeting the needs of both hobbyists and semi-professional users while driving steady market growth.
U.S. Gardening Tools Market generated USD 22.8 billion, equivalent to 88.6% share in 2025, and is projected to grow at a CAGR of 6.2% through 2035. Growth is fueled by a strong DIY culture, increasing adoption of battery-operated power equipment, and the rising trend of transforming lawns into personalized garden spaces. Millennial homeowners and urban gardening enthusiasts are driving demand, while a well-established retail infrastructure, including large home improvement stores and a robust e-commerce ecosystem, ensures easy access to hand and power tools. Rapid adoption of ergonomic designs and smart gardening technologies also shortens replacement cycles, boosting both residential and professional landscaping tool sales.
Key players operating in the Global Gardening Tools Market include Husqvarna AB, Makita Corporation, Briggs & Stratton LLC, Robert Bosch GmbH, AriensCo, Fiskars Corporation, Deere & Company, Bully Tools Inc., Stanley Black & Decker Inc., The Toro Company, Yamabiko Corporation, STIHL Holding AG & Co. KG, Techtronic Industries Co. Ltd. (TTI), Honda Motor Co. Ltd., Kubota Corporation, Griffon Corporation Inc., and Zenport Industries. Companies in the Gardening Tools Market are strengthening their presence through product innovation, distribution expansion, and digital marketing initiatives. Manufacturers focus on developing lightweight, durable, and battery-powered tools while integrating ergonomic designs and smart technology. Partnerships with home improvement retailers and e-commerce platforms help widen product availability and reach. Brands emphasize lifestyle-driven marketing campaigns, highlighting convenience, sustainability, and performance benefits to engage urban and suburban consumers. Strategic investments in modular and multi-attachment systems reduce costs and improve customer value, while expansion into emerging markets enhances competitiveness. Continuous R&D, after-sales support, and promotional strategies ensure brand loyalty and long-term market leadership.
Table of Contents
Chapter 1 Research Methodology
- 1.1 Research approach
- 1.2 Quality Commitments
- 1.2.1 GMI AI policy & data integrity commitment
- 1.2.1.1 Source consistency protocol
- 1.2.1 GMI AI policy & data integrity commitment
- 1.3 Research Trail & Confidence Scoring
- 1.3.1 Research Trail Components
- 1.3.2 Scoring Components
- 1.4 Data Collection
- 1.4.1 Partial list of primary sources
- 1.5 Data mining sources
- 1.5.1 Paid sources
- 1.5.1.1 Sources, by region
- 1.5.1 Paid sources
- 1.6 Base estimates and calculations
- 1.6.1 Base year calculation for any one approach
- 1.7 Forecast model
- 1.7.1 Quantified market impact analysis
- 1.7.1.1 Mathematical impact of growth parameters on forecast
- 1.7.1 Quantified market impact analysis
- 1.8 Research transparency addendum
- 1.8.1 Source attribution framework
- 1.8.2 Quality assurance metrics
- 1.8.3 Our commitment to trust
Chapter 2 Executive Summary
- 2.1 Industry 360° synopsis, 2022-2035
- 2.2 Key market trends
- 2.2.1 Region
- 2.2.1.1 North America
- 2.2.1.2 Europe
- 2.2.1.3 Asia Pacific
- 2.2.1.4 Middle East & Africa
- 2.2.1.5 Latin America
- 2.2.2 Product Type
- 2.2.3 Price Range
- 2.2.4 End Use
- 2.2.5 Distribution Channel
- 2.2.1 Region
Chapter 3 Industry Insights
- 3.1 Industry ecosystem analysis
- 3.1.1 Factor affecting the value chain
- 3.1.2 Profit Margin Analysis by Value Chain Stage (Driven by Primary Research)
- 3.1.3 Disruptions
- 3.1.4 Manufacturers
- 3.1.5 Distributors
- 3.2 Industry Impact forces
- 3.2.1 Growth drivers
- 3.2.2 Industry pitfalls & challenges
- 3.2.3 Opportunities
- 3.3 Growth potential analysis
- 3.4 Supply Chain Analysis
- 3.4.1 Global Supply Chain Structure
- 3.4.2 Raw Material Sourcing (Steel, Aluminium, Plastics, Electronics)
- 3.4.3 Component Manufacturing & Tier Supplier Network
- 3.4.4 Final Assembly & Production Footprint
- 3.4.5 China Sourcing Dynamics & Risks
- 3.4.6 China Exit & China+1 Strategies
- 3.4.7 Alternative Manufacturing Hubs (Mexico, Taiwan, Vietnam, India)
- 3.5 Technology and innovation landscape
- 3.5.1 Current technological trends
- 3.5.2 Emerging technologies
- 3.6 Price trends Analysis (Driven by Primary Research)
- 3.6.1 Historical Price Trend Analysis (Driven by Primary Research) (2022-2025)
- 3.6.2 Pricing Strategy by Player Type (Premium / Value / Cost-plus) (Driven by Primary Research)
- 3.6.3 Price Variation by Product Type & End-Use
- 3.6.4 Geographic Price Benchmarking
- 3.6.5 Impact of Raw Material Costs on Pricing
- 3.6.6 Regional Price Variations & Purchasing Power Parity
- 3.6.7 Private Label vs Branded Pricing Dynamics
- 3.7 Regulatory landscape
- 3.7.1 Global Regulatory Landscape
- 3.7.1.1 North America (EPA, CPSC, OSHA)
- 3.7.1.2 Europe (CE Marking, REACH, RoHS)
- 3.7.1.3 Asia Pacific
- 3.7.1.3.1 China Standards (GB, CCC)
- 3.7.1.3.2 Japan Standards (JIS, PSE)
- 3.7.1.3.3 Taiwan Standards & Import Requirements
- 3.7.1.3.4 India Standards (BIS)
- 3.7.1.4 Latin America (MERCOSUR Regulations, Brazil ANVISA)
- 3.7.1.5 Middle East & Africa (GCC Standardization, SASO)
- 3.7.2 Labelling & Safety Disclosure Requirements
- 3.7.3 Impact on Market Entry & Product Development
- 3.7.1 Global Regulatory Landscape
- 3.8 Patent Landscape (Driven by Primary Research)
- 3.8.1 Patent Filing Trends by Technology Category (2022-2025)
- 3.8.2 Key Patent Holders & Innovation Leaders
- 3.8.3 Technology Domain Analysis (Hand Tools vs Power Tools)
- 3.8.4 Geographic Distribution of Patent Activity
- 3.8.5 Key Patent Citations & White Space Analysis
- 3.8.6 Emerging Technology Patents (Robotics, IoT, Battery Tech)
- 3.9 Porter’s analysis
- 3.10 PESTEL analysis
- 3.11 Trade Data Analysis (Driven by paid database)
- 3.11.1 Import/Export Volume & Value Trends (2022-2025)
- 3.11.2 Key Trade Corridors & Routes
- 3.11.2.1 China to North America/Europe Trade Flows
- 3.11.2.2 Taiwan Export Markets & Manufacturing Role
- 3.11.2.3 Mexico to US (USMCA Benefits)
- 3.11.2.4 Intra-Asia Trade Dynamics
- 3.11.3 HS Code Classification & Tariff Structure
- 3.11.4 Tariff Impact Analysis by Product Type
- 3.11.5 Non-Tariff Barriers & Trade Restrictions
- 3.11.6 Trade Policy Changes & Future Outlook (2025-2027)
- 3.12 Impact of AI & Generative AI on the Market
- 3.12.1 AI-Driven Disruption of Existing Business Models
- 3.12.2 GenAI Use Cases & Adoption Roadmap by Segment
- 3.13 Capacity & Production Landscape (Driven by Primary Research)
- 3.13.1 Installed Capacity by Region & Key Producer (Driven by Primary Research)
- 3.13.1.1 North America Manufacturing Footprint
- 3.13.1.2 Europe Manufacturing Footprint
- 3.13.1.3 Asia Pacific Manufacturing Footprint (China, Taiwan, Vietnam, India)
- 3.13.2 Capacity Utilization Rates & Expansion Pipelines (Driven by Primary Research)
- 3.13.1 Installed Capacity by Region & Key Producer (Driven by Primary Research)
Chapter 4 Competitive Landscape, 2025
- 4.1 Introduction
- 4.2 Company market share analysis
- 4.2.1 By region
- 4.2.1.1 North America
- 4.2.1.2 Europe
- 4.2.1.3 Asia Pacific
- 4.2.1.3.1 China
- 4.2.1.3.2 India
- 4.2.1.3.3 Japan
- 4.2.1.3.4 South Korea
- 4.2.1.3.5 Australia
- 4.2.1.3.6 Taiwan
- 4.2.1.4 Middle East & Africa
- 4.2.1.5 Latin America
- 4.2.1 By region
- 4.3 Competitive positioning matrix
- 4.4 Strategic outlook matrix
- 4.5 Company matrix analysis
- 4.6 Key developments
- 4.6.1 Mergers & acquisitions
- 4.6.2 Partnerships & collaborations
- 4.6.3 New Product Launches
- 4.6.4 Expansion Plans
Chapter 5 Market Estimates & Forecast, By Product Type, 2022-2035 (USD Billion) (Million Units)
- 5.1 Key trends
- 5.2 Hand tools
- 5.2.1 Shovels and spades
- 5.2.2 Pruners and shears
- 5.2.3 Rakes
- 5.2.4 Trowels
- 5.2.5 Hoes
- 5.2.6 Forks
- 5.3 Power tools
- 5.3.1 Lawn mowers
- 5.3.2 Leaf Blowers
- 5.3.3 Hedge trimmers
- 5.3.4 Tillers
- 5.4 Watering equipment
- 5.4.1 Hoses
- 5.4.2 Sprinklers
- 5.4.3 Watering cans
- 5.4.4 Drip irrigation systems
- 5.5 Others
- 5.5.1 Plant supports
- 5.5.2 Garden gloves
- 5.5.3 Tool storage
- 5.5.4 Compost bins
Chapter 6 Market Estimates & Forecast, By Price Range, 2022-2035 (USD Billion) (Million Units)
- 6.1 Key trends
- 6.2 Low
- 6.3 Mid
- 6.4 High
Chapter 7 Market Estimates & Forecast, By End Use, 2022-2035 (USD Billion) (Million Units)
- 7.1 Key trends
- 7.2 Residential
- 7.2.1 Single-Family Homes
- 7.2.2 Multi-Family Housing & Condominiums
- 7.2.3 Urban Gardening & Rooftop Gardens
- 7.3 Commercial
- 7.3.1 Professional Landscaping Services
- 7.3.2 Municipal & Government Properties
- 7.3.3 Golf Courses & Sports Facilities
- 7.3.4 Hotels & Hospitality
- 7.3.5 Corporate Campuses & Business Parks
Chapter 8 Market Estimates & Forecast, By Distribution Channel, 2022-2035 (USD Billion) (Million Units)
- 8.1 Key trends
- 8.2 Online
- 8.2.1 E-commerce
- 8.2.2 Company websites
- 8.3 Offline
- 8.3.1 Supermarkets
- 8.3.2 Specialty stores
- 8.3.3 Others (Departmental stores, etc.)
Chapter 9 Market Estimates & Forecast, By Region, 2022-2035 (USD Billion) (Million Units)
- 9.1 Key trends
- 9.2 North America
- 9.2.1 U.S.
- 9.2.2 Canada
- 9.3 Europe
- 9.3.1 UK
- 9.3.2 Germany
- 9.3.3 France
- 9.3.4 Italy
- 9.3.5 Spain
- 9.3.6 Russia
- 9.4 Asia Pacific
- 9.4.1 China
- 9.4.2 India
- 9.4.3 Japan
- 9.4.4 South Korea
- 9.4.5 Australia
- 9.4.6 Taiwan
- 9.5 Latin America
- 9.5.1 Brazil
- 9.5.2 Mexico
- 9.6 MEA
- 9.6.1 South Africa
- 9.6.2 Saudi Arabia
- 9.6.3 UAE
Chapter 10 Company Profiles
- 10.1 AriensCo
- 10.2 Briggs & Stratton LLC
- 10.3 Bully Tools Inc.
- 10.4 Deere & Company
- 10.5 Fiskars Corporation
- 10.6 Griffon Corporation Inc.
- 10.7 Honda Motor Co. Ltd.
- 10.8 Husqvarna AB
- 10.9 Kubota Corporation
- 10.10 Makita Corporation
- 10.11 Robert Bosch GmbH
- 10.12 Stanley Black & Decker Inc.
- 10.13 STIHL Holding AG & Co. KG
- 10.14 Techtronic Industries Co. Ltd. (TTI)
- 10.15 The Toro Company
- 10.16 Yamabiko Corporation
- 10.17 Zenport Industries
 智慧播種機市場預測至2034年-全球產品類型、連接方式與技術、材料、相容植物類型、分銷通路、最終用戶和區域分析
 吹葉機市場 - 全球產業規模、佔有率、趨勢、機會、預測:按產品、應用、分銷管道、地區和競爭對手分類,2021-2031年
 家庭與花園肥料市場:2026-2032年全球市場預測(按產品類型、形態、加工方法、成分、應用、分銷管道和最終用戶分類)
 吹葉機市場規模、佔有率、趨勢和預測:按產品類型、類別、引擎類型、動力來源、銷售管道、最終用戶和地區分類,2026-2034年樹木修剪設備市場:按設備類型、動力來源、應用和地區分類(2026-2034 年)花園種植盆和花盆市場:2026-2032年全球市場預測(按材質、類型、形狀、尺寸、價格範圍、銷售管道和最終用戶分類)園藝工具市場:按產品類型、驅動系統、銷售管道和應用分類的全球市場預測,2026-2032年園藝工具市場:按產品類型、最終用戶和分銷管道分類的全球市場預測,2026-2032年
 園林工具市場:依產品類型、銷售管道、最終用戶和地區分類樹籬修剪機市場:按動力來源、刀片類型和應用分類的全球市場預測,2026年至2032年