


 |
市場調查報告書
商品編碼
2027513
夾管閥市場機會、成長要素、產業趨勢分析及2026-2035年預測Pinch Tube Valve Market Opportunity, Growth Drivers, Industry Trend Analysis, and Forecast 2026 - 2035 |
||||||
預計到 2025 年,全球夾管閥市場價值將達到 6.366 億美元,年複合成長率為 5.1%,到 2035 年將達到 10.4 億美元。
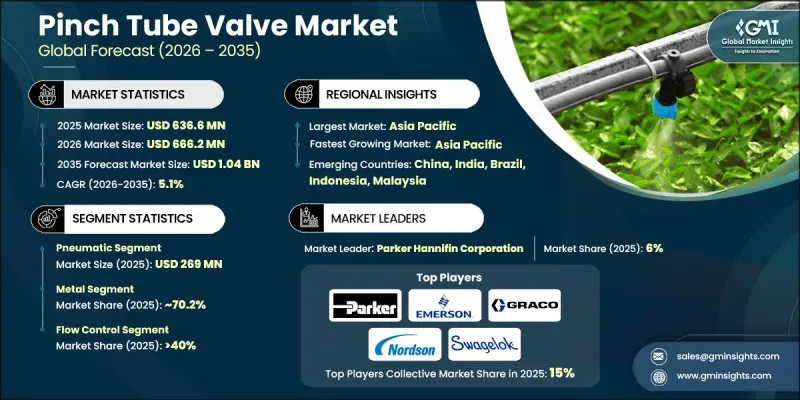
市場成長的驅動力來自對無污染加工日益成長的需求、工業自動化技術的快速發展以及高度監管的製造業領域的持續發展。夾管閥採用軟性彈性體套管隔離製程介質,從而最大限度地降低洩漏風險,減少維護需求,並確保運作可靠性。這些特性使其尤其適用於對衛生和精度要求極高的環境。這些閥門性能穩定且維護程序簡便,進一步促進了其應用。此外,對營運效率和流程最佳化的日益關注也推動了各行業對先進閥門技術的應用,使全球夾管閥市場成為現代流體處理系統的關鍵組成部分。
| 市場範圍 | |
|---|---|
| 開始年份 | 2025 |
| 預測期 | 2026-2035 |
| 上市時的市場規模 | 6.366億美元 |
| 預測金額 | 10.4億美元 |
| 複合年成長率 | 5.1% |
在監管嚴格的行業中,對衛生可靠的流體處理系統的需求日益成長。合規要求規定必須使用能夠防止污染並確保產品在整個製作流程中完整性的設備。夾管閥透過確保流體僅與內套管接觸,顯著降低了污染風險,從而滿足了這些要求。這種設計簡化了清潔程序,加強了對既定監管標準的遵守,並提高了整體製程效率。
到2025年,金屬閥門將佔據70.2%的市場。這一主導地位反映了金屬閥門結構在嚴苛的工業應用中的廣泛應用。採用不銹鋼、鋁和特殊合金等材料製成的閥門具有極高的耐極端工況性能,包括高壓、高溫和腐蝕性物質的侵蝕。其卓越的耐用性和結構完整性使其成為複雜工業環境中的理想選擇。
至2025年,流量控制領域將佔全球夾管閥市場的40%,成為其主要應用領域之一。這類閥門透過調節內套管的壓縮程度來控制流量,從而實現精確且穩定的流體管理。這項特性為需要可靠且可重複流量控制的製程提供了精準控制的基礎。具備自動和比例控制功能的先進系統進一步提升了性能,並可與現代製程控制系統無縫整合。
亞太地區夾管閥市場預計到2025年將佔據30%的市場佔有率,並在2026年至2035年間以5.3%的複合年成長率成長,這主要得益於快速的工業發展、不斷擴大的製造能力以及日益成長的基礎設施投資。涵蓋眾多產業的多元化產業基礎持續推動先進流體控制解決方案的強勁需求。政府為提升工業品質和促進製造業發展而採取的支持措施,進一步推動了最新閥門技術的應用,從而助力市場持續擴張。
目錄
第1章:調查方法和範圍
第2章執行摘要
第3章業界考察
- 生態系分析
- 供應商情況
- 利潤率
- 每個階段增加的價值
- 影響價值鏈的因素
- 影響產業的因素
- 促進因素
- 對無污染流體控制的需求
- 工業自動化和製程控制的要求
- 成本效益和維護效率
- 產業潛在風險與挑戰
- 關於安裝和營運成本的考慮因素
- 需求的季節性波動
- 機會
- 開發具有預測性維護功能的智慧閥門
- 生物基永續彈性體材料
- 促進因素
- 成長潛力分析
- 未來市場趨勢
- 科技與創新趨勢
- 當前技術趨勢
- 新興技術
- 價格分析(基於初步調查)
- 對過去價格趨勢的分析(基於初步研究)
- 根據業務類型分類的定價策略(高階/價值/成本加成)(基於初步調查)
- 閥門類型和材質的價格波動
- 監理情勢
- 波特的分析
- PESTEL 分析
- 貿易數據分析(基於付費資料庫)
- 進出口量和進口額趨勢(基於付費資料庫)
- 主要貿易路線及關稅的影響(基於付費資料庫)
- 按地區和HS編碼分類的貿易流量
- 人工智慧和生成式人工智慧對市場的影響
- 利用人工智慧改造現有經營模式
- 針對特定領域的生成式人工智慧應用案例和實施藍圖
- 風險、限制和監管考量
- 生產能力和生產趨勢(基於初步調查)
- 按地區和主要生產商分類的運作能力(基於初步調查)
- 運轉率和擴張計劃(基於初步調查)
第4章 競爭情勢
- 介紹
- 企業市佔率分析
- 按地區
- 主要市場公司的競爭分析
- 競爭定位矩陣
- 主要進展
- 併購
- 夥伴關係與合作
- 新產品發布
- 業務拓展計劃
第5章 市場估計與預測:依類型分類,2022-2035年
- 手動的
- 氣動
- 自動的
- 電的
第6章 市場估計與預測:依材料分類,2022-2035年
- 金屬
- 塑膠/聚合物(PVC、PP、PVDF)
- 其他
第7章 市場估計與預測:依功能分類,2022-2035年
- 流量控制
- 阻塞
- 其他
第8章 市場估算與預測:依最終用途產業分類,2022-2035年
- 化工/石油化工
- 食品/飲料
- 製藥和生物技術
- 用水和污水處理
- 採礦和礦產
- 紙漿和造紙
- 石油和天然氣
- 其他(陶瓷、紡織、農業、發電)
第9章 市場估價與預測:依通路分類,2022-2035年
- 直銷
- 間接銷售
第10章 市場估價與預測:依地區分類,2022-2035年
- 北美洲
- 美國
- 加拿大
- 歐洲
- 德國
- 英國
- 法國
- 義大利
- 西班牙
- 亞太地區
- 中國
- 日本
- 印度
- 澳洲
- 韓國
- 拉丁美洲
- 巴西
- 墨西哥
- 阿根廷
- 中東和非洲
- 南非
- 沙烏地阿拉伯
- 阿拉伯聯合大公國
第11章:公司簡介
- Badger Meter
- Burkert Fluid Control Systems
- ControlAir
- Crane
- Emerson Electric
- Festo
- Gore
- Graco
- Kitz Corporation
- Nordson Corporation
- Omega Engineering
- Parker Hannifin Corporation
- Pentair
- Schneider Electric
- Swagelok Company
The Global Pinch Tube Valve Market was valued at USD 636.6 million in 2025 and is estimated to grow at a CAGR of 5.1% to reach USD 1.04 billion by 2035.
Market growth is driven by the increasing need for contamination-free processing, rapid progress in industrial automation, and the ongoing development of highly regulated manufacturing sectors. Pinch tube valves are designed to isolate process media using flexible elastomer sleeves, which help minimize leakage risks, reduce maintenance requirements, and ensure operational reliability. These features make them particularly suitable for environments where hygiene and precision are critical. The ability of these valves to deliver consistent performance while simplifying maintenance procedures further supports their adoption. In addition, the growing focus on operational efficiency and process optimization is encouraging industries to integrate advanced valve technologies, positioning the global pinch tube valve market as a key component in modern fluid handling systems.
| Market Scope | |
|---|---|
| Start Year | 2025 |
| Forecast Year | 2026-2035 |
| Start Value | $636.6 Million |
| Forecast Value | $1.04 Billion |
| CAGR | 5.1% |
Strict regulatory frameworks across highly controlled industries are reinforcing the need for hygienic and reliable fluid handling systems. Compliance requirements mandate the use of equipment that prevents contamination and ensures product integrity throughout processing stages. Pinch tube valves meet these expectations by allowing fluids to interact only with the internal sleeve, significantly reducing the risk of contamination. This design simplifies cleaning procedures and enhances adherence to established regulatory standards, while also improving overall process efficiency.
The metal segment accounted for 70.2% share in 2025. This dominance reflects the widespread use of metal-based valve constructions in demanding industrial applications. Valves made from materials such as stainless steel, aluminum, and specialized alloys offer strong resistance to extreme operating conditions, including high pressure, elevated temperatures, and exposure to aggressive substances. Their durability and structural integrity make them a preferred choice for complex industrial environments.
The flow control segment held 40% share in 2025, making it the primary application area within the global pinch tube valve market. These valves are widely used for regulating flow rates by adjusting the compression of the internal sleeve, allowing for accurate and consistent fluid management. This capability supports precise control in processes that require reliable and repeatable flow regulation. Advanced systems with automated and proportional control features further enhance performance, enabling seamless integration with modern process control systems.
Asia Pacific Pinch Tube Valve Market held 30% share in 2025 and is anticipated to grow at a CAGR of 5.3% from 2026 to 2035, driven by rapid industrial development, expanding manufacturing capacity, and increasing infrastructure investments. A diverse industrial base across multiple sectors continues to generate strong demand for advanced fluid control solutions. Supportive government initiatives aimed at improving industrial quality and promoting manufacturing growth are further encouraging the adoption of modern valve technologies, contributing to sustained market expansion.
Key companies operating in the Global Pinch Tube Valve Market include Badger Meter, Burkert Fluid Control Systems, ControlAir, Crane, Emerson Electric, Festo, Gore, Graco, Kitz Corporation, Nordson Corporation, Omega Engineering, Parker Hannifin Corporation, Pentair, Schneider Electric, and Swagelok Company. Companies in the Global Pinch Tube Valve Market are implementing strategic initiatives to strengthen their competitive positioning and expand their global presence. A strong emphasis is placed on research and development to enhance product performance, durability, and compatibility with advanced industrial systems. Manufacturers are investing in automation and smart technologies to improve precision and operational efficiency. Strategic partnerships and collaborations are being pursued to expand distribution networks and improve customer reach. Companies are also focusing on offering customized solutions tailored to specific industry requirements, which helps build long-term client relationships.
Table of Contents
Chapter 1 Methodology and Scope
- 1.1 Market scope and definition
- 1.2 Research design
- 1.2.1 Research approach
- 1.2.2 Data collection methods
- 1.3 Data mining sources
- 1.3.1 Global
- 1.3.2 Regional/Country
- 1.4 Base estimates and calculations
- 1.4.1 Base year calculation
- 1.4.2 Key trends for market estimation
- 1.5 Primary research and validation
- 1.5.1 Primary sources
- 1.6 Forecast model
- 1.7 Research assumptions and limitations
Chapter 2 Executive Summary
- 2.1 Industry 360° synopsis
- 2.2 Key market trends
- 2.2.1 Regional
- 2.2.2 Type
- 2.2.3 Function
- 2.2.4 End use industry
- 2.2.5 Distribution channel
Chapter 3 Industry Insights
- 3.1 Industry ecosystem analysis
- 3.1.1 Supplier landscape
- 3.1.2 Profit margin
- 3.1.3 Value addition at each stage
- 3.1.4 Factor affecting the value chain
- 3.2 Industry impact forces
- 3.2.1 Growth drivers
- 3.2.1.1 Demand for contamination-free fluid control
- 3.2.1.2 Industrial automation and process control requirements
- 3.2.1.3 Cost-effectiveness and maintenance efficiency
- 3.2.2 Industry pitfalls & challenges
- 3.2.2.1 Installation and operational cost considerations
- 3.2.2.2 Seasonal demand fluctuations
- 3.2.3 Opportunities
- 3.2.3.1 Smart valve development with predictive maintenance
- 3.2.3.2 Bio-based & sustainable elastomer materials
- 3.2.1 Growth drivers
- 3.3 Growth potential analysis
- 3.4 Future market trends
- 3.5 Technology and innovation landscape
- 3.5.1 Current technological trends
- 3.5.2 Emerging technologies
- 3.6 Pricing analysis (Driven by Primary Research)
- 3.6.1 Historical price trend analysis (Driven by Primary Research)
- 3.6.2 Pricing strategy by player type (premium / value / cost-plus) (Driven by Primary Research)
- 3.6.3 Price variation by valve type & material
- 3.7 Regulatory landscape
- 3.8 Porter’s analysis
- 3.9 PESTEL analysis
- 3.10 Trade Data Analysis (Driven by Paid Data Base)
- 3.10.1 Import/export volume & value trends (Driven by Paid Data Base)
- 3.10.2 Key trade corridors & tariff impact (Driven by Paid Data Base)
- 3.10.3 Trade flow by region & HS code classification
- 3.11 Impact of AI & generative AI on the market
- 3.11.1 AI-driven disruption of existing business models
- 3.11.2 GenAI use cases & adoption roadmap by segment
- 3.11.3 Risks, limitations & regulatory considerations
- 3.12 Capacity & production landscape (Driven by Primary Research)
- 3.12.1 Installed capacity by region & key producer (Driven by Primary Research)
- 3.12.2 Capacity utilization rates & expansion pipelines (Driven by Primary Research)
Chapter 4 Competitive Landscape, 2025
- 4.1 Introduction
- 4.2 Company market share analysis
- 4.2.1 By region
- 4.2.1.1 North America
- 4.2.1.2 Europe
- 4.2.1.3 Asia Pacific
- 4.2.1.4 Latin America
- 4.2.1.5 Middle East and Africa
- 4.2.1 By region
- 4.3 Competitive analysis of major market players
- 4.4 Competitive positioning matrix
- 4.5 Key developments
- 4.5.1 Mergers & acquisitions
- 4.5.2 Partnerships & collaborations
- 4.5.3 New product launches
- 4.5.4 Expansion plans
Chapter 5 Market Estimates and Forecast, By Type, 2022 - 2035 (USD Million) (Thousand Units)
- 5.1 Key trends
- 5.2 Manual
- 5.3 Pneumatic
- 5.4 Automatic
- 5.5 Electric
Chapter 6 Market Estimates and Forecast, By Material, 2022 - 2035 (USD Million) (Thousand Units)
- 6.1 Key trends
- 6.2 Metal
- 6.3 Plastic/Polymer (PVC, PP, PVDF)
- 6.4 Others
Chapter 7 Market Estimates and Forecast, By Function, 2022 - 2035 (USD Million) (Thousand Units)
- 7.1 Key trends
- 7.2 Flow control
- 7.3 Shut-off
- 7.4 Others
Chapter 8 Market Estimates and Forecast, By End-Use Industry, 2022 - 2035 (USD Million) (Thousand Units)
- 8.1 Key trends
- 8.2 Chemical & petrochemical
- 8.3 Food and beverage
- 8.4 Pharmaceutical & biotechnology
- 8.5 Water & wastewater treatment
- 8.6 Mining & minerals
- 8.7 Pulp & paper
- 8.8 Oil and gas
- 8.9 Others (ceramics, textiles, agriculture, power generation)
Chapter 9 Market Estimates and Forecast, By Distribution Channel, 2022 - 2035 (USD Million) (Thousand Units)
- 9.1 Key trends
- 9.2 Direct sales
- 9.3 Indirect sales
Chapter 10 Market Estimates and Forecast, By Region, 2022 - 2035 (USD Million) (Thousand Units)
- 10.1 Key trends
- 10.2 North America
- 10.2.1 U.S.
- 10.2.2 Canada
- 10.3 Europe
- 10.3.1 Germany
- 10.3.2 UK
- 10.3.3 France
- 10.3.4 Italy
- 10.3.5 Spain
- 10.4 Asia Pacific
- 10.4.1 China
- 10.4.2 Japan
- 10.4.3 India
- 10.4.4 Australia
- 10.4.5 South Korea
- 10.5 Latin America
- 10.5.1 Brazil
- 10.5.2 Mexico
- 10.5.3 Argentina
- 10.6 Middle East and Africa
- 10.6.1 South Africa
- 10.6.2 Saudi Arabia
- 10.6.3 UAE
Chapter 11 Company Profiles
- 11.1 Badger Meter
- 11.2 Burkert Fluid Control Systems
- 11.3 ControlAir
- 11.4 Crane
- 11.5 Emerson Electric
- 11.6 Festo
- 11.7 Gore
- 11.8 Graco
- 11.9 Kitz Corporation
- 11.10 Nordson Corporation
- 11.11 Omega Engineering
- 11.12 Parker Hannifin Corporation
- 11.13 Pentair
- 11.14 Schneider Electric
- 11.15 Swagelok Company
 控制閥市場:2026-2032年全球市場預測(依閥類型、材質、驅動技術、組件、閥門尺寸、驅動方式、應用、終端用戶產業及銷售管道)
 2026年移動式機械主控閥全球市場報告模組化流量控制閥市場:按類型、操作方式、材料、連接方式、尺寸和最終用途行業分類,全球預測,2026-2032年選擇閥市場:按操作方式、類型、尺寸、材料和產業分類,全球預測(2026-2032年)手動槓桿閥市場按材質、連接類型、驅動類型、壓力等級和應用分類-全球預測,2026-2032年
 控制閥市場:策略性洞察與預測(2026-2031 年)氣動單座調節閥市場按類型、工作壓力範圍、連接類型、閥體材質、應用和終端用戶行業分類,全球預測,2026-2032年耐火材料襯裡風門市場:依最終用戶產業、類型、運作模式、材料、壓力等級、安裝方式和應用分類-全球預測,2026-2032年全球控制閥市場規模、佔有率、趨勢和成長分析報告:2026-2034年2026年全球進氣壓力控制閥市場報告