


 |
市場調查報告書
商品編碼
2027486
智慧物流平台市場:市場機會、成長要素、產業趨勢分析及2026-2035年預測Smart Logistics Platforms Market Opportunity, Growth Drivers, Industry Trend Analysis, and Forecast 2026 - 2035 |
||||||
2025年全球智慧物流平台市場價值199億美元,預計2035年將達951億美元,年複合成長率為17.5%。
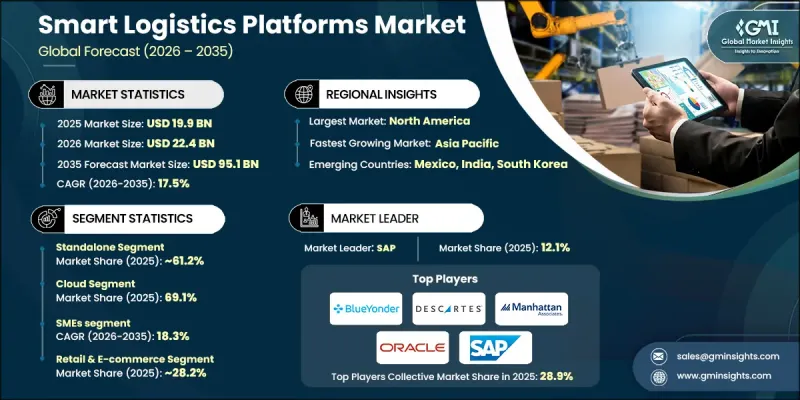
隨著國際貿易活動的持續活性化,全球智慧物流平台產業正迅速擴張,對能夠提升供應鏈效率的先進數位化解決方案的需求也日益強勁。企業正擴大採用智慧物流系統來簡化營運、加強協作,並確保複雜網路中的即時視覺性。這些平台在最佳化物流功能方面發揮著至關重要的作用,使企業能夠更敏捷、更精準地運作。隨著企業對數位轉型的依賴程度不斷提高,先進技術與物流流程的整合也加速推進。在企業優先考慮效率和擴充性的情況下,智慧物流平台正成為管理不斷變化的供應鏈需求的必備工具。對技術研發投入的增加和創新解決方案的湧現正在重塑競爭格局,隨著企業對其物流基礎設施進行現代化改造,全球智慧物流平台市場正處於持續高速成長的軌道上。
| 市場範圍 | |
|---|---|
| 開始年份 | 2025 |
| 預測期 | 2026-2035 |
| 上市時的市場規模 | 199億美元 |
| 預計金額 | 951億美元 |
| 複合年成長率 | 17.5% |
全球智慧物流平台市場正受到人工智慧、互聯系統和即時數據分析等數位技術蓬勃發展的顯著影響。企業正日益採用能夠實現營運自動化並提升決策能力的整合平台。持續的技術研發投入進一步增強了平台功能,從而提高了營運效率、最佳化了路線規劃並提升了整體系統性能。此外,越來越多的新參與企業採用先進解決方案,也為市場的蓬勃發展注入了動力。
預計到2025年,獨立物流細分市場將佔據61.2%的市場佔有率,市場規模將達到122億美元。由於企業日益重視提升端到端供應鏈績效,此細分市場將持續維持主導地位。各公司正日益致力於最佳化物流網路,以提高盈利、應對力和營運柔軟性。先進分析和智慧系統的應用進一步推動了這一趨勢,提高了效率並最大限度地減少了營運挑戰。
預計到2025年,雲端領域將佔據69.1%的市場佔有率,市場規模達137億美元。基於雲端的部署方式因其擴充性、柔軟性以及支援整個物流網路無縫整合的能力而成為首選方案。這種模式使企業能夠有效率地管理複雜的運營,同時減少對大規模基礎設施投資的需求,從而推動數位化物流生態系統的持續轉型。
美國智慧物流平台市場預計到2025年將達到75億美元,並在2035年之前以17.5%的複合年成長率成長。美國市場的成長主要得益於物流業的規模和成熟度,以及對高效能、技術主導解決方案日益成長的需求。企業正在利用智慧物流平台來提高營運視覺性、提升成本效益,並實現更積極主動、更具策略性的供應鏈管理。
目錄
第1章:調查方法
第2章執行摘要
第3章業界考察
- 生態系分析
- 供應商情況
- 利潤率
- 成本結構
- 每個階段增加的價值
- 影響價值鏈的因素
- 中斷
- 影響產業的因素
- 促進因素
- 電子商務和全通路零售的快速成長
- 客戶對即時可見性的期望日益成長
- 降低營運成本和提高效率的壓力
- 勞動力短缺和自動化需求
- 產業潛在風險與挑戰
- 實施成本高,投資回報期長。
- 與傳統IT基礎設施整合面臨的挑戰
- 市場機遇
- 人工智慧驅動的自主決策系統
- 區塊鏈輔助供應鏈透明度和可追溯性
- 最佳化城市物流的最後一公里配送
- 促進因素
- 成長潛力分析
- 監理情勢
- 北美洲
- 美國 - 聯邦汽車運輸安全管理局 (FMCSA)
- 加拿大 - 加拿大運輸部
- 歐洲
- 歐盟委員會
- 歐洲 - 歐洲海事安全局
- 亞太地區
- 中國 - 中華人民共和國交通運輸部
- 印度 - 公路運輸與公路部
- 拉丁美洲
- 巴西 - 國家陸上運輸局
- 墨西哥 - 基礎設施、通訊和運輸部
- 中東和非洲
- 沙烏地阿拉伯 - 交通運輸總局
- 南非 - 南非運輸部
- 北美洲
- 投資與資金籌措分析
- 波特的分析
- PESTEL 分析
- 科技與創新趨勢
- 目前技術
- 物聯網 (IoT)
- 雲端運算
- 巨量資料分析
- 新興技術
- 區塊鏈
- 數位雙胞胎
- 自動駕駛車輛的整合
- 目前技術
- 價格分析(基於初步調查)
- 對過去價格趨勢的分析
- 按業務類型分類的定價策略(溢價/價值/成本加成)
- 專利趨勢(基於初步調查)
- 用例分析
- 實施和整合架構
- 系統整合模式和調查方法
- 舊有系統現代化策略
- API架構和中介軟體解決方案
- 變革管理與組織準備
- 互通性與開放生態系統
- 業界標準與協定(EDI、API 標準)
- 跨多個供應商整合面臨的挑戰
- 開放原始碼與專有平台
- 平台生態系統和合作夥伴網路
- 人工智慧和生成式人工智慧對市場的影響
- 利用人工智慧改造現有經營模式
- 針對特定領域的生成式人工智慧應用案例和實施藍圖
- 風險、限制和監管考量
- 預測假設和情境分析(基於初步研究)
- 基本案例-驅動複合年成長率的關鍵宏觀經濟與產業變量
- 樂觀情境-宏觀經濟與產業的順風
- 悲觀情景-宏觀經濟放緩或產業逆風
第4章 競爭情勢
- 介紹
- 企業市佔率分析
- 北美洲
- 歐洲
- 亞太地區
- 拉丁美洲
- 中東和非洲(MEA)
- 主要市場公司的競爭分析
- 競爭定位矩陣
- 主要進展
- 併購
- 夥伴關係與合作
- 新產品發布
- 業務拓展計劃及資金籌措
- 企業級分層基準測試
- 層級分類標準與選擇標準
- 按收入、地區和創新能力分類的層級定位矩陣。
第5章 市場估計與預測:依解法分類,2022-2035年
- 獨立版
- 單功能倉儲管理平台
- 單功能運輸管理平台
- 單功能車輛追蹤平台
- 融合的
第6章 市場估計與預測:依應用領域分類,2022-2035年
- 運輸管理
- 最後一公里配送管理
- 倉庫管理
- 庫存管理和追蹤
- 車輛和資產管理
- 供應鏈可視性和協調性
- 其他
第7章 市場估算與預測:依部署類型分類,2022-2035年
- 現場
- 雲
- 私有雲端
- 公共雲端
- 混合
第8章 市場估計與預測:依公司規模分類,2022-2035年
- 中小企業
- 大公司
第9章 市場估計與預測:依最終用途分類,2022-2035年
- 零售與電子商務
- 製造業
- 第三方物流(3PL)
- 食品/飲料
- 製藥和醫療保健
- 車
- 化學
- 其他
第10章 市場估價與預測:依地區分類,2022-2035年
- 北美洲
- 美國
- 加拿大
- 歐洲
- 德國
- 英國
- 法國
- 義大利
- 西班牙
- 瑞典
- 捷克共和國
- 俄羅斯
- 亞太地區
- 中國
- 日本
- 韓國
- 印度
- 澳洲
- 新加坡
- 越南
- 印尼
- 馬來西亞
- 拉丁美洲
- 巴西
- 墨西哥
- 阿根廷
- 智利
- 中東和非洲(MEA)
- 南非
- 沙烏地阿拉伯
- 阿拉伯聯合大公國
第11章:公司簡介
- 世界公司
- Manhattan Associates
- SAP
- Oracle
- Blue Yonder
- Uber Freight
- Kinaxis
- E2open
- Infor
- Descartes Systems
- Magaya Supply Chain
- 本地公司
- Project44
- FourKites
- CH Robinson
- XPO Logistics
- Trimble
- Transporeon
- 新興企業
- Samsara
- Alpega
- Flexport
- Loadsmart
The Global Smart Logistics Platforms Market was valued at USD 19.9 billion in 2025 and is estimated to grow at a CAGR of 17.5% to reach USD 95.1 billion by 2035.
The global smart logistics platforms industry is expanding rapidly as international trade activity continues to intensify, creating a strong need for advanced digital solutions that enhance supply chain efficiency. Businesses are increasingly adopting intelligent logistics systems to streamline operations, improve coordination, and gain real-time visibility across complex networks. These platforms play a critical role in optimizing logistics functions, enabling companies to operate with greater agility and precision. The growing reliance on digital transformation is further accelerating the integration of advanced technologies into logistics processes. As companies prioritize efficiency and scalability, smart logistics platforms are becoming essential tools for managing evolving supply chain demands. Increasing investment in technology development and the emergence of innovative solutions are reshaping the competitive landscape, positioning the global smart logistics platforms market for sustained high growth as organizations continue to modernize their logistics infrastructure.
| Market Scope | |
|---|---|
| Start Year | 2025 |
| Forecast Year | 2026-2035 |
| Start Value | $19.9 Billion |
| Forecast Value | $95.1 Billion |
| CAGR | 17.5% |
The global smart logistics platforms market is significantly influenced by the widespread adoption of digital technologies such as artificial intelligence, connected systems, and real-time data analytics. Organizations are increasingly implementing integrated platforms that automate operations and improve decision-making capabilities. Continuous investment in technology development is further strengthening platform capabilities, enabling improved operational efficiency, enhanced route planning, and better overall system performance. The rising number of new entrants introducing advanced solutions is also contributing to the market's dynamic growth environment.
The standalone segment accounted for 61.2% share in 2025, generating USD 12.2 billion. This segment continues to lead due to the growing emphasis on improving end-to-end supply chain performance. Businesses are increasingly focusing on optimizing logistics networks to enhance profitability, responsiveness, and operational flexibility. The adoption of advanced analytics and intelligent systems is further supporting this trend by improving efficiency and minimizing operational challenges.
The cloud segment held a 69.1% share in 2025, reaching USD 13.7 billion. Cloud-based deployment has become the preferred approach due to its scalability, flexibility, and ability to support seamless integration across logistics networks. This model enables organizations to manage complex operations efficiently while reducing the need for extensive infrastructure investments, supporting the ongoing shift toward digital logistics ecosystems.
U.S. Smart Logistics Platforms Market reached USD 7.5 billion in 2025 and is projected to grow at a CAGR of 17.5% through 2035. Growth in the United States is supported by the scale and maturity of its logistics sector, along with increasing demand for efficient and technology-driven solutions. Companies are leveraging smart logistics platforms to enhance operational visibility and improve cost efficiency, enabling more proactive and strategic supply chain management.
Key players operating in the Global Smart Logistics Platforms Market include Alpega, Blue Yonder, Descartes Systems, Honeywell, Infor, LogiNext Mile, Magaya Supply Chain, Manhattan Associates, Oracle, and SAP. Companies in the Global Smart Logistics Platforms Market are strengthening their position through continuous innovation and strategic investments in advanced technologies. They are focusing on integrating artificial intelligence, real-time analytics, and automation capabilities into their platforms to enhance operational efficiency and customer value. Strategic partnerships and acquisitions are being used to expand technological capabilities and geographic reach. Many firms are also prioritizing cloud-based solutions to improve scalability and flexibility. In addition, companies are investing in user-friendly interfaces and customized solutions to meet diverse client needs. Strengthening cybersecurity measures and expanding service offerings further enable companies to build trust and maintain a competitive advantage in the rapidly evolving logistics technology landscape.
Table of Contents
Chapter 1 Methodology
- 1.1 Research approach
- 1.2 Quality Commitments
- 1.2.1 GMI AI policy & data integrity commitment
- 1.3 Research Trail & Confidence Scoring
- 1.3.1 Research Trail Components
- 1.3.2 Scoring Components
- 1.4 Data Collection
- 1.5 Data mining sources
- 1.5.1 Paid sources
- 1.6 Base estimates and calculations
- 1.6.1 Base year calculation for any one approach
- 1.7 Forecast
- 1.7.1 Quantified market impact analysis
- 1.8 Research transparency addendum
- 1.8.1 Source attribution framework
- 1.8.2 Quality assurance metrics
- 1.8.3 Our commitment to trust
Chapter 2 Executive Summary
- 2.1 Industry 360° synopsis
- 2.2 Key market trends
- 2.2.1 Regional
- 2.2.2 Solution
- 2.2.3 Application
- 2.2.4 Deployment mode
- 2.2.5 Enterprise size
- 2.2.6 End use
- 2.3 TAM analysis, 2026-2035
- 2.4 CXO perspectives: Strategic imperatives
Chapter 3 Industry Insights
- 3.1 Industry ecosystem analysis
- 3.1.1 Supplier landscape
- 3.1.2 Profit margin
- 3.1.3 Cost structure
- 3.1.4 Value addition at each stage
- 3.1.5 Factor affecting the value chain
- 3.1.6 Disruptions
- 3.2 Industry impact forces
- 3.2.1 Growth drivers
- 3.2.1.1 Rapid growth of e-commerce & omnichannel retail
- 3.2.1.2 Rising customer expectations for real-time visibility
- 3.2.1.3 Pressure to reduce operational costs & improve efficiency
- 3.2.1.4 Labor shortages & need for automation
- 3.2.2 Industry pitfalls and challenges
- 3.2.2.1 High implementation costs & long ROI timelines
- 3.2.2.2 Integration challenges with legacy IT infrastructure
- 3.2.3 Market opportunities
- 3.2.3.1 AI-powered autonomous decision-making systems
- 3.2.3.2 Blockchain for supply chain transparency & traceability
- 3.2.3.3 Last-mile delivery optimization for urban logistics
- 3.2.1 Growth drivers
- 3.3 Growth potential analysis
- 3.4 Regulatory landscape
- 3.4.1 North America
- 3.4.1.1 US - Federal Motor Carrier Safety Administration (FMCSA)
- 3.4.1.2 Canada - Transport Canada
- 3.4.2 Europe
- 3.4.2.1 EU - European Commission
- 3.4.2.2 Europe - European Maritime Safety Agency
- 3.4.3 Asia Pacific
- 3.4.3.1 China - Ministry of Transport of the People's Republic of China
- 3.4.3.2 India - Ministry of Road Transport and Highways
- 3.4.4 Latin America
- 3.4.4.1 Brazil - National Land Transport Agency
- 3.4.4.2 Mexico - Secretariat of Infrastructure, Communications and Transportation
- 3.4.5 Middle East & Africa
- 3.4.5.1 Saudi Arabia - Saudi Transport General Authority
- 3.4.5.2 South Africa - Department of Transport South Africa
- 3.4.1 North America
- 3.5 Investment & funding analysis
- 3.6 Porter’s analysis
- 3.7 PESTEL analysis
- 3.8 Technology and innovation landscape
- 3.8.1 Current technologies
- 3.8.1.1 Internet of Things (IoT)
- 3.8.1.2 Cloud Computing
- 3.8.1.3 Big Data Analytics
- 3.8.2 Emerging technologies
- 3.8.2.1 Blockchain
- 3.8.2.2 Digital Twin
- 3.8.2.3 Autonomous Vehicles integration
- 3.8.1 Current technologies
- 3.9 Pricing Analysis (Driven by Primary Research)
- 3.9.1 Historical Price Trend Analysis
- 3.9.2 Pricing Strategy by Player Type (Premium / Value / Cost-plus)
- 3.10 Patent landscape (Driven by Primary Research)
- 3.11 Use case analysis
- 3.12 Implementation & integration architecture
- 3.12.1 System integration patterns & methodologies
- 3.12.2 Legacy system modernization strategies
- 3.12.3 API architecture & middleware solutions
- 3.12.4 Change management & organizational readiness
- 3.13 Interoperability & open ecosystems
- 3.13.1 Industry standards & protocols (EDI, API standards)
- 3.13.2 Multi-vendor integration challenges
- 3.13.3 Open-source vs. Proprietary platforms
- 3.13.4 Platform ecosystem & partner networks
- 3.14 Impact of AI & Generative AI on the Market
- 3.14.1 AI-driven disruption of existing business models
- 3.14.2 GenAI use cases & adoption roadmap by segment
- 3.14.3 Risks, limitations & regulatory considerations
- 3.15 Forecast assumptions & scenario analysis (Driven by Primary Research)
- 3.15.1 Base Case - key macro & industry variables driving CAGR
- 3.15.2 Optimistic Scenarios - Favorable macro and industry tailwinds
- 3.15.3 Pessimistic Scenario - Macroeconomic slowdown or industry headwinds
Chapter 4 Competitive Landscape, 2025
- 4.1 Introduction
- 4.2 Company market share analysis
- 4.2.1 North America
- 4.2.2 Europe
- 4.2.3 Asia Pacific
- 4.2.4 LATAM
- 4.2.5 MEA
- 4.3 Competitive analysis of major market players
- 4.4 Competitive positioning matrix
- 4.5 Key developments
- 4.5.1 Mergers & acquisitions
- 4.5.2 Partnerships & collaborations
- 4.5.3 New product launches
- 4.5.4 Expansion plans and funding
- 4.6 Company tier benchmarking
- 4.6.1 Tier classification criteria & qualifying thresholds
- 4.6.2 Tier positioning matrix by revenue, geography & innovation
Chapter 5 Market Estimates & Forecast, By Solution, 2022 - 2035 ($Mn)
- 5.1 Key trends
- 5.2 Standalone
- 5.2.1 Single-function warehouse management platforms
- 5.2.2 Single-function transportation management platforms
- 5.2.3 Single-function fleet tracking platforms
- 5.3 Integrated
Chapter 6 Market Estimates & Forecast, By Application, 2022 - 2035 ($Mn)
- 6.1 Key trends
- 6.2 Transportation management
- 6.3 Last-mile delivery management
- 6.4 Warehouse management
- 6.5 Inventory management & tracking
- 6.6 Fleet & asset management
- 6.7 Supply chain visibility & orchestration
- 6.8 Others
Chapter 7 Market Estimates & Forecast, By Deployment mode, 2022 - 2035 ($Mn)
- 7.1 Key trends
- 7.2 On-premises
- 7.3 Cloud
- 7.3.1 Private cloud
- 7.3.2 Public cloud
- 7.4 Hybrid
Chapter 8 Market Estimates & Forecast, By Enterprise size, 2022 - 2035 ($Mn)
- 8.1 Key trends
- 8.2 Small & medium enterprises (SMEs)
- 8.3 Large enterprises
Chapter 9 Market Estimates & Forecast, By End use, 2022 - 2035 ($Mn)
- 9.1 Key trends
- 9.2 Retail & e-commerce
- 9.3 Manufacturing
- 9.4 Third party logistics (3PL)
- 9.5 Food & beverage
- 9.6 Pharmaceuticals & healthcare
- 9.7 Automotive
- 9.8 Chemical
- 9.9 Others
Chapter 10 Market Estimates & Forecast, By Region, 2022 - 2035 ($Mn)
- 10.1 Key trends
- 10.2 North America
- 10.2.1 US
- 10.2.2 Canada
- 10.3 Europe
- 10.3.1 Germany
- 10.3.2 UK
- 10.3.3 France
- 10.3.4 Italy
- 10.3.5 Spain
- 10.3.6 Sweden
- 10.3.7 Czech Republic
- 10.3.8 Russia
- 10.4 Asia Pacific
- 10.4.1 China
- 10.4.2 Japan
- 10.4.3 South Korea
- 10.4.4 India
- 10.4.5 Australia
- 10.4.6 Singapore
- 10.4.7 Vietnam
- 10.4.8 Indonesia
- 10.4.9 Malaysia
- 10.5 Latin America
- 10.5.1 Brazil
- 10.5.2 Mexico
- 10.5.3 Argentina
- 10.5.4 Chile
- 10.6 MEA
- 10.6.1 South Africa
- 10.6.2 Saudi Arabia
- 10.6.3 UAE
Chapter 11 Company Profiles
- 11.1 Global players
- 11.1.1 Manhattan Associates
- 11.1.2 SAP
- 11.1.3 Oracle
- 11.1.4 Blue Yonder
- 11.1.5 Uber Freight
- 11.1.6 Kinaxis
- 11.1.7 E2open
- 11.1.8 Infor
- 11.1.9 Descartes Systems
- 11.1.10 Magaya Supply Chain
- 11.2 Regional players
- 11.2.1 Project44
- 11.2.2 FourKites
- 11.2.3 C.H. Robinson
- 11.2.4 XPO Logistics
- 11.2.5 Trimble
- 11.2.6 Transporeon
- 11.3 Emerging players
- 11.3.1 Samsara
- 11.3.2 Alpega
- 11.3.3 Flexport
- 11.3.4 Loadsmart
 2026-2030年全球物流市場
 全球資料中心物流市場(2026 年)
 2026年貨櫃存放場即時定位系統(RTLS)全球市場報告
 2034年全球自主倉庫市場預測-按產品類型、應用、最終用戶和地區分類的全球分析智慧物流平台市場預測至2034年-按組件、部署類型、組織規模、最終用戶和地區分類的全球分析氫動力卡車市場預測至2034年——全球卡車類型、燃料電池技術、續航里程、銷售管道、應用、最終用戶和區域分析
 運輸和物流服務市場規模、佔有率、成長及全球產業分析:按類型、應用和地區分類的洞察,2026-2034年2026年全球氫動力交通運輸市場報告2026年全球物流樞紐市場報告2026年全球中程配送市場報告