


 |
市場調查報告書
商品編碼
2027454
真空閥市場機會、成長要素、產業趨勢分析及2026-2035年預測。Vacuum Valve Market Opportunity, Growth Drivers, Industry Trend Analysis, and Forecast 2026 - 2035 |
||||||
2025年全球真空閥市場規模預計為29億美元,預計到2035年將達到81億美元,年複合成長率為10.2%。
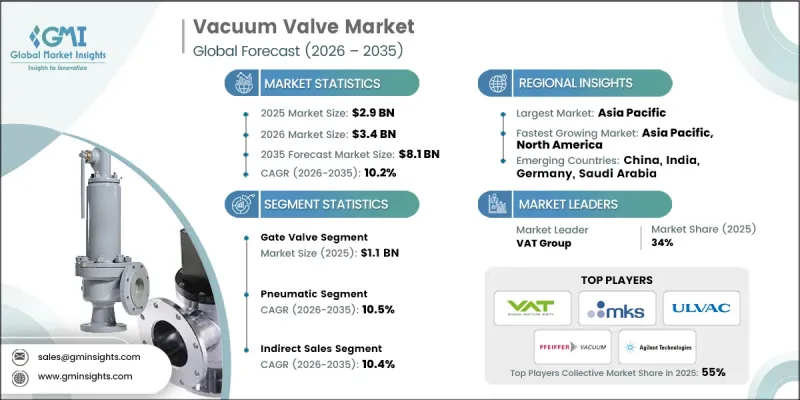
這一成長主要得益於半導體製造、製藥和化學等行業的廣泛應用。半導體生產,尤其是先進晶片製造的日益複雜化,顯著提升了對精密真空控制系統的需求。同時,世界各國政府都在優先投資國內製造業,以增強供應鏈韌性,這也進一步刺激了市場需求。製藥業也在關鍵生產應用中更多地採用真空製程,從而推動了市場擴張。此外,各產業對能源效率和環保營運的日益重視,也推動了先進真空系統的應用。化工產業持續依賴這些技術來維持製程一致性和產品品質。同時,工業4.0的實施正在加速智慧技術的整合,實現即時監控和自動化。這不僅提升了營運效率,也為真空閥市場的持續成長提供了支持。
| 市場範圍 | |
|---|---|
| 開始年份 | 2025 |
| 預測期 | 2026-2035 |
| 上市時的市場規模 | 29億美元 |
| 預測金額 | 81億美元 |
| 複合年成長率 | 10.2% |
預計到2025年,閘閥市場規模將達到11億美元,並在2035年之前以10.6%的複合年成長率成長。由於閘閥能夠精確控制各種工業應用中的流量,其需求不斷成長。閘閥的多功能性和可靠性推動了其在需要穩定可控運作領域的應用,從而促進了該細分市場的穩定成長。
預計到2025年,氣動元件市佔率將達到52%,並在2026年至2035年間以10.5%的複合年成長率成長。該領域的成長主要得益於市場對高效能高速作業系統的日益成長的需求。由於氣動解決方案在自動化環境中表現出的可靠性能,各行各業都在積極採用該解決方案,這不僅推動了其應用範圍的擴大,也鞏固了其在整體市場中的地位。
預計到2025年,美國真空閥市場將佔據80%的市場佔有率,市場規模將達到5.581億美元。美國市場的擴張主要得益於技術的持續進步以及真空系統在各行各業的廣泛應用。高成長產業的強勁需求進一步推動了市場發展,而持續的創新和先進製造技術的整合也不斷創造新的成長機會。此外,工業應用的不斷拓展以及對高精度製程日益成長的需求,也支撐了全部區域對真空閥的需求。
目錄
第1章:調查方法和範圍
第2章執行摘要
第3章業界考察
- 生態系分析
- 供應商情況
- 利潤率
- 每個階段增加的價值
- 影響價值鏈的因素
- 供應鏈分析
- 原料來源
- 分銷管道
- 供應鏈風險
- 製造和組裝場地
- 特別是關於半導體供應鏈方面
- 影響產業的因素
- 促進因素
- 半導體製造業對真空閥的需求增加
- 真空閥在醫療領域的應用日益廣泛
- 增加對研發活動的投入,以提高真空閥的性能
- 產業潛在風險與挑戰
- 真空閥的安裝和維護需要較高的前期成本。
- 市場參與者之間競爭激烈
- 新興市場認知度與接受度較低
- 市場機遇
- 發展中地區半導體產業的擴張
- 技術進步
- 人們對可再生能源和環境永續性的興趣日益濃厚。
- 促進因素
- 成長潛力分析
- 未來市場趨勢
- 科技與創新趨勢
- 新興技術
- 閥門控制系統的小型化和整合
- 利用物聯網技術對真空系統進行預測性維護
- 永續製造:節能閥門設計
- 新興技術
- 價格分析(基於初步調查)
- 過去價格趨勢分析(基於初步調查)(2022-2025 年)
- 根據初步調查結果,制定不同類型企業的定價策略
- 監理情勢
- 全球安全與品質標準(ISO 9001,半導體製造設備的SEMI標準)
- 區域法規結構
- 北美:OSHA職場安全要求
- 歐洲:CE標誌、ATEX指令(適用於危險環境)
- 亞太地區:各國工業設備認證
- 區域法規結構
- 半導體特定合規性
- SEMI S2(環境、健康與安全指南)
- SEMI F47(真空元件清潔度規範)
- 出口管制條例(對兩用技術的限制)
- 全球安全與品質標準(ISO 9001,半導體製造設備的SEMI標準)
- 貿易數據分析(基於付費資料庫)
- 2022-2025年進出口數量及價值趨勢
- 主要貿易走廊及關稅的影響
- 人工智慧和生成式人工智慧對市場的影響
- 人工智慧正在改變傳統的經營模式。
- 按客戶群分類的生成式人工智慧應用案例和實施藍圖
- 風險、限制和監管考量
- 整合人工智慧驅動的智慧家庭生態系統
- 波特五力分析
- PESTEL 分析
第4章 競爭情勢
- 介紹
- 企業市佔率分析
- 企業矩陣分析
- 主要市場公司的競爭分析
- 競爭定位矩陣
- 主要進展
- 併購
- 夥伴關係與合作
- 新產品發布
- 業務拓展計劃
第5章 市場估價與預測:依閥門類型分類,2022-2035年
- 閘閥
- 角閥
- 隔膜閥
- 球閥
- 蝶閥
- 其他(止回閥、節氣門等)
第6章 市場估計與預測:依營運方式分類,2022-2035年
- 手動閥
- 氣動閥
- 電動閥
第7章 市場估算與預測:依真空度分類,2022-2035年
- 低真空(760-25 Torr)
- 中等真空(25 至 10-3 Torr)
- 高真空(10-3 至 10-9 托)
- 超高真空(低於 10⁻⁹ Torr)
第8章 市場估計與預測:依應用領域分類,2022-2035年
- 半導體製造
- 一般製造業
- 研究與開發
- 醫療和製藥
- 其他(能源、電力等)
第9章 市場估價與預測:依通路分類,2022-2035年
- 直銷
- 間接銷售
第10章 市場估價與預測:依地區分類,2022-2035年
- 北美洲
- 美國
- 加拿大
- 歐洲
- 德國
- 英國
- 法國
- 西班牙
- 義大利
- 荷蘭
- 亞太地區
- 中國
- 日本
- 印度
- 澳洲
- 韓國
- 拉丁美洲
- 巴西
- 墨西哥
- 阿根廷
- 中東和非洲(MEA)
- 南非
- 沙烏地阿拉伯
- 阿拉伯聯合大公國
第11章:公司簡介
- Agilent Technologies
- Busch Group
- Edwards Vacuum
- Flomatic Valves
- Foshan Bowah Vacuum Equipment
- Herose
- HTC Vacuum
- Kurt J. Lesker Company(KJLC)
- MKS Instruments
- Nor-Cal Products
- Pfeiffer Vacuum
- Rochling
- Storagetech
- ULVAC
- VAT Group
The Global Vacuum Valve Market was valued at USD 2.9 billion in 2025 and is estimated to grow at a CAGR of 10.2% to reach USD 8.1 billion by 2035.
Growth is fueled by increasing adoption across industries such as semiconductor manufacturing, pharmaceuticals, and chemical processing. The rising complexity of semiconductor production, particularly in advanced chip fabrication, is significantly increasing the need for precise vacuum control systems. At the same time, governments worldwide are prioritizing investments in domestic manufacturing capabilities to strengthen supply chain resilience, which is further accelerating demand. The pharmaceutical sector is also contributing to market expansion through the growing use of vacuum-based processes for critical production applications. In addition, industries are placing greater emphasis on energy efficiency and environmentally responsible operations, encouraging the use of advanced vacuum systems. The chemical sector continues to rely on these technologies to maintain process consistency and product quality. Moreover, the adoption of Industry 4.0 practices is driving the integration of smart technologies, enabling real-time monitoring and automation, which is enhancing operational performance and supporting sustained growth in the vacuum valve market.
| Market Scope | |
|---|---|
| Start Year | 2025 |
| Forecast Year | 2026-2035 |
| Start Value | $2.9 Billion |
| Forecast Value | $8.1 Billion |
| CAGR | 10.2% |
The gate valve segment generated USD 1.1 billion in 2025 and is expected to grow at a CAGR of 10.6% throughout 2035. Demand for gate valves is increasing due to their ability to regulate flow with high precision across a wide range of industrial applications. Their versatility and reliability are supporting broader adoption in sectors that require consistent and controlled operational performance, contributing to steady segment growth.
The pneumatic segment held a share of 52% in 2025 and is projected to grow at a CAGR of 10.5% between 2026 and 2035. Growth in this segment is being driven by the increasing preference for efficient and high-speed operational systems. Industries are adopting pneumatic solutions due to their ability to deliver reliable performance in automated environments, which is supporting their growing use and strengthening their position within the overall market.
United States Vacuum Valve Market accounted for 80% share in 2025, generating USD 558.1 million. Market expansion in the country is supported by continuous technological advancements and the widespread adoption of vacuum-based systems across multiple industries. Strong demand from high-growth sectors is further reinforcing market development, while ongoing innovation and increasing integration of advanced manufacturing technologies continue to create new growth opportunities. Additionally, the expansion of industrial applications and the rising need for precision-driven processes are sustaining demand for vacuum valves across the region.
Key companies operating in the Global Vacuum Valve Market include Agilent Technologies, Busch Group, Edwards Vacuum, Flomatic Valves, Foshan Bowah Vacuum Equipment, Herose, HTC Vacuum, Kurt J. Lesker Company (KJLC), MKS Instruments, Nor-Cal Products, Pfeiffer Vacuum, Rochling, Storagetech, ULVAC, and VAT Group. Companies in the Global Vacuum Valve Market are strengthening their competitive position by focusing on technological innovation and product advancement. Manufacturers are investing in research and development to introduce high-performance valves with improved efficiency, durability, and precision. Strategic collaborations and partnerships are enabling companies to expand their global footprint and enhance distribution capabilities. Firms are also integrating smart technologies, including sensors and automation features, to align with evolving industrial requirements. In addition, efforts to optimize manufacturing processes and reduce operational costs are helping companies remain competitive, while customized solutions and application-specific designs are supporting stronger customer engagement and long-term market growth.
Table of Contents
Chapter 1 Methodology and scope
- 1.1 Research approach
- 1.2 Quality Commitments
- 1.2.1 GMI AI policy & data integrity commitment
- 1.2.1.1 Source consistency protocol
- 1.2.1 GMI AI policy & data integrity commitment
- 1.3 Research Trail & Confidence Scoring
- 1.3.1 Research Trail Components
- 1.3.2 Scoring Components
- 1.4 Data Collection
- 1.4.1 Partial list of primary sources
- 1.5 Data mining sources
- 1.5.1 Paid sources
- 1.5.1.1 Sources, by region
- 1.5.1 Paid sources
- 1.6 Base estimates and calculations
- 1.6.1 Base year calculation for any one approach
- 1.7 Forecast model
- 1.7.1 Quantified market impact analysis
- 1.7.1.1 Mathematical impact of growth parameters on forecast
- 1.7.1 Quantified market impact analysis
- 1.8 Research transparency addendum
- 1.8.1 Source attribution framework
- 1.8.2 Quality assurance metrics
- 1.8.3 Our commitment to trust
Chapter 2 Executive summary
- 2.1 Industry 360° synopsis
- 2.2 Key market trends
- 2.2.1 Regional trends
- 2.2.2 Valve type trends
- 2.2.3 Actuation type trends
- 2.2.4 Vacuum level trends
- 2.2.5 Application trends
- 2.2.6 Distribution channel trends
Chapter 3 Industry insights
- 3.1 Industry ecosystem analysis
- 3.1.1 Supplier landscape
- 3.1.2 Profit margin
- 3.1.3 Value addition at each stage
- 3.1.4 Factor affecting the value chain
- 3.2 Supply Chain Analysis
- 3.2.1 Raw material sources
- 3.2.2 Distribution channels
- 3.2.3 Supply chain risks
- 3.2.4 Manufacturing and assembly locations
- 3.2.5 Semiconductor supply chain specifically
- 3.3 Industry impact forces
- 3.3.1 Growth drivers
- 3.3.1.1 Increasing demand for vacuum valves in semiconductor manufacturing
- 3.3.1.2 Growing adoption of vacuum valves in the healthcare sector
- 3.3.1.3 Rising investments in research and development activities to enhance vacuum valve
- 3.3.2 Industry pitfalls & challenges
- 3.3.2.1 High initial costs associated with vacuum valve installation and maintenance
- 3.3.2.2 Intense competition among market players
- 3.3.2.3 Limited awareness and adoption in emerging markets
- 3.3.3 Market opportunities
- 3.3.3.1 Expansion of the semiconductor industry in developing regions
- 3.3.3.2 Technological advancements
- 3.3.3.3 Growing focus on renewable energy and environmental sustainability
- 3.3.1 Growth drivers
- 3.4 Growth potential analysis
- 3.5 Future market trends
- 3.6 Technology and innovation landscape
- 3.6.1 Emerging technologies
- 3.6.1.1 Miniaturization and integration of valve control systems
- 3.6.1.2 IoT-enabled predictive maintenance for vacuum systems
- 3.6.1.3 Sustainable manufacturing: energy-efficient valve designs
- 3.6.1 Emerging technologies
- 3.7 Pricing Analysis (Driven by Primary Research)
- 3.7.1 Historical price trend analysis (Driven by Primary Research) (2022-2025)
- 3.7.2 Pricing strategy by player type (Driven by Primary Research)
- 3.8 Regulatory landscape
- 3.8.1 Global safety and quality standards (ISO 9001, SEMI standards for semiconductor equipment)
- 3.8.1.1 Regional regulatory frameworks
- 3.8.1.1.1 North America: OSHA workplace safety requirements
- 3.8.1.1.2 Europe: CE marking, ATEX directives for hazardous environments
- 3.8.1.1.3 Asia Pacific: Country-specific industrial equipment certifications
- 3.8.1.1 Regional regulatory frameworks
- 3.8.2 Semiconductor-specific compliance
- 3.8.3 SEMI S2 (Environmental, Health, and Safety Guideline)
- 3.8.4 SEMI F47 (Cleanliness specifications for vacuum components)
- 3.8.5 Export control regulations (dual-use technology restrictions)
- 3.8.1 Global safety and quality standards (ISO 9001, SEMI standards for semiconductor equipment)
- 3.9 Trade Data Analysis (Driven by Paid database)
- 3.9.1 Import/export volume & value trends (2022-2025)
- 3.9.2 Key trade corridors & tariff impact
- 3.10 Impact of AI & generative ai on the market
- 3.10.1 AI-driven disruption of traditional business models
- 3.10.2 GenAI use cases & adoption roadmap by customer segment
- 3.10.3 Risks, limitations & regulatory considerations
- 3.10.4 AI-enabled smart home ecosystem integration
- 3.11 Porter's analysis
- 3.12 PESTEL analysis
Chapter 4 Competitive landscape, 2025
- 4.1 Introduction
- 4.2 Company market share analysis
- 4.2.1 North America
- 4.2.2 Europe
- 4.2.3 Asia Pacific
- 4.2.4 Latin America
- 4.2.5 MEA
- 4.3 Company matrix analysis
- 4.4 Competitive analysis of major market players
- 4.5 Competitive positioning matrix
- 4.6 Key developments
- 4.6.1 Mergers & acquisitions
- 4.6.2 Partnerships & collaborations
- 4.6.3 New product launches
- 4.6.4 Expansion plans
Chapter 5 Market Estimates & Forecast, By Valve Type, 2022 - 2035 ($Billion, Thousand Units)
- 5.1 Key trends
- 5.2 Gate valve
- 5.3 Angle valve
- 5.4 Diaphragm valve
- 5.5 Ball valve
- 5.6 Butterfly valve
- 5.7 Others (check valves, throttle valves, etc.)
Chapter 6 Market Estimates & Forecast, By Actuation Type, 2022 - 2035 ($Billion, Thousand Units)
- 6.1 Key trends
- 6.2 Manual valves
- 6.3 Pneumatic valves
- 6.4 Electric valves
Chapter 7 Market Estimates & Forecast, By Vacuum Level, 2022 - 2035 ($Billion, Thousand Units)
- 7.1 Key trends
- 7.2 Low vacuum (760 to 25 Torr)
- 7.3 Medium vacuum (25 to 10^-3 Torr)
- 7.4 High vacuum (10^-3 to 10^-9 Torr)
- 7.5 Ultra-High vacuum (< 10^-9 Torr)
Chapter 8 Market Estimates & Forecast, By Application, 2022 - 2035 ($Billion, Thousand Units)
- 8.1 Key trends
- 8.2 Semiconductor manufacturing
- 8.3 Industrial manufacturing
- 8.4 Research & development
- 8.5 Healthcare & pharmaceuticals
- 8.6 Others (energy & power etc.)
Chapter 9 Market Estimates & Forecast, By Distribution Channel, 2022 - 2035 ($Billion, Thousand Units)
- 9.1 Key trends
- 9.2 Direct sales
- 9.3 Indirect sales
Chapter 10 Market Estimates & Forecast, By Region, 2022 - 2035 ($Billion, Thousand Units)
- 10.1 Key trends
- 10.2 North America
- 10.2.1 U.S.
- 10.2.2 Canada
- 10.3 Europe
- 10.3.1 Germany
- 10.3.2 UK
- 10.3.3 France
- 10.3.4 Spain
- 10.3.5 Italy
- 10.3.6 Netherlands
- 10.4 Asia Pacific
- 10.4.1 China
- 10.4.2 Japan
- 10.4.3 India
- 10.4.4 Australia
- 10.4.5 South Korea
- 10.5 Latin America
- 10.5.1 Brazil
- 10.5.2 Mexico
- 10.5.3 Argentina
- 10.6 MEA
- 10.6.1 South Africa
- 10.6.2 Saudi Arabia
- 10.6.3 UAE
Chapter 11 Company Profiles
- 11.1 Agilent Technologies
- 11.2 Busch Group
- 11.3 Edwards Vacuum
- 11.4 Flomatic Valves
- 11.5 Foshan Bowah Vacuum Equipment
- 11.6 Herose
- 11.7 HTC Vacuum
- 11.8 Kurt J. Lesker Company (KJLC)
- 11.9 MKS Instruments
- 11.10 Nor-Cal Products
- 11.11 Pfeiffer Vacuum
- 11.12 Rochling
- 11.13 Storagetech
- 11.14 ULVAC
- 11.15 VAT Group


