


 |
市場調查報告書
商品編碼
2019251
天然界面活性劑市場:商業機會、成長要素、產業趨勢分析及2026-2035年預測Natural Surfactant Market Opportunity, Growth Drivers, Industry Trend Analysis, and Forecast 2026 - 2035 |
||||||
預計到 2025 年,全球天然界面活性劑市場價值將達到 225 億美元,並預計以 5.5% 的複合年成長率成長,到 2035 年達到 381 億美元。
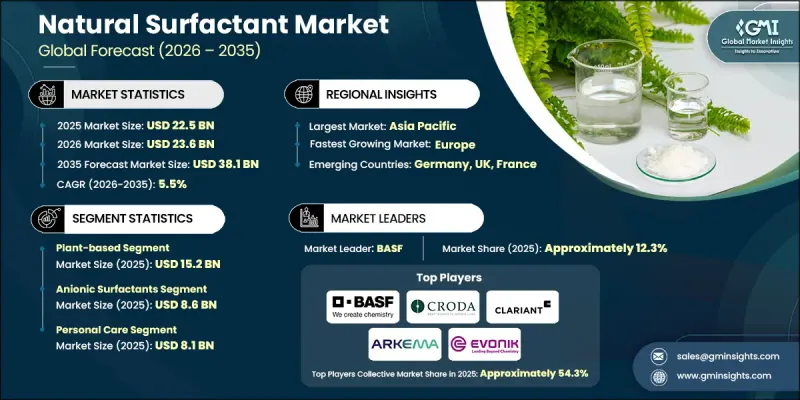
市場擴張的驅動力在於消費者日益增強的環保意識以及對可生物分解和永續來源原料需求的成長。個人護理、清潔、食品飲料和工業領域的製造商正擴大從傳統的石油化學替代品轉向天然表面活性劑。這項轉變得益於企業的永續發展措施和旨在推廣環保解決方案的嚴格法規結構。在食品飲料產業,這些原料被用作乳化劑、穩定劑和分散劑,以滿足潔淨標示和安全要求,而消費者對加工最少產品的偏好也進一步推動了需求。同樣,個人護理和化妝品公司正在使用植物來源的低致敏性表面活性劑,以提供溫和親膚、不含硫酸鹽且標籤清晰的產品,這正在推動市場成長。天然表面活性劑在各種應用中的日益普及表明,它們在永續工業和消費品開發中的作用日益增強。
| 市場範圍 | |
|---|---|
| 開始年份 | 2025 |
| 預測期 | 2026-2035 |
| 上市時的市場規模 | 225億美元 |
| 預測金額 | 381億美元 |
| 複合年成長率 | 5.5% |
預計到2025年,植物來源活性劑市場規模將達到152億美元,主要得益於其可再生資源特性、易得性、成本效益以及與永續性目標的契合度。源自植物油、醣類和椰子油的成分廣泛應用於個人護理、家用清潔劑和工業配方中。相較之下,由於監管限制以及消費者對純素和無動物實驗產品的需求日益成長,動物源界面活性劑的應用範圍僅限於特定領域。
預計到2025年,陰離子界面活性劑市場規模將達到86億美元,這主要得益於其優異的清潔、乳化和發泡性能,這些性能對於清潔劑、洗髮精和工業清潔劑至關重要。非離子界面活性劑也正迅速普及,因為它們具有優異的穩定性、低刺激性和良好的相容性,適用於個人護理、農業和工業配方,從而拓展了其應用範圍。
預計到2025年,北美天然界面活性劑市場規模將達55億美元。該地區的成長主要得益於消費者在個人護理、家居護理和工業清潔領域對環保和可生物分解產品的偏好。美國憑藉其嚴格的環境法規、較高的消費者環保意識和先進的化學品生產能力,在該市場中處於領先地位。隨著天然化妝品和植物來源產品日益普及,加拿大市場也在成長,而基於生物技術和發酵技術的界面活性劑生產投資進一步推動了該地區的成長動能。
目錄
第1章:調查方法和範圍
第2章執行摘要
第3章業界考察
- 生態系分析
- 供應商情況
- 利潤率
- 每個階段增加的價值
- 影響價值鏈的因素
- 中斷
- 影響產業的因素
- 促進因素
- 消費者對環保產品的偏好日益成長
- 食品飲料產業應用拓展
- 個人護理和化妝品行業的需求不斷成長
- 產業潛在風險與挑戰
- 高昂的生產成本
- 供不應求
- 市場機遇
- 透過生物技術擴大生物界面活性劑的生產
- 個人護理和居家護理產品對永續成分的需求日益成長
- 促進因素
- 成長潛力分析
- 監理情勢
- 北美洲
- 歐洲
- 亞太地區
- 拉丁美洲
- 中東和非洲
- 波特五力分析
- PESTEL 分析
- 價格趨勢
- 按地區
- 產品類型
- 未來市場趨勢
- 科技與創新趨勢
- 當前技術趨勢
- 新興技術
- 專利趨勢
- 貿易統計資料(HS編碼)(註:貿易統計僅提供主要國家的資料)
- 主要進口國
- 主要出口國
- 永續性和環境方面
- 永續計劃
- 減少廢棄物策略
- 生產中的能源效率
- 環保意識的舉措
第4章 競爭情勢
- 介紹
- 企業市佔率分析
- 按地區
- 北美洲
- 歐洲
- 亞太地區
- 拉丁美洲
- 中東和非洲
- 按地區
- 企業矩陣分析
- 主要市場公司的競爭分析
- 競爭定位矩陣
- 主要進展
- 併購
- 夥伴關係與合作
- 新產品發布
- 業務拓展計劃
第5章 市場估計與預測:依來源分類,2022-2035年
- 植物來源
- 動物源性
- 微生物和發酵衍生的
第6章 市場估算與預測:依產品分類,2022-2035年
- 陰離子活性劑
- 陽離子界面活性劑
- 非離子界面活性劑
- 兩性界面活性劑
第7章 市場估計與預測:依應用領域分類,2022-2035年
- 個人護理
- 工業和設施清潔
- 農業
- 製藥
- 油田化學品
- 其他(紡織品、食品和飲料)
第8章 市場估計與預測:依地區分類,2022-2035年
- 北美洲
- 美國
- 加拿大
- 歐洲
- 德國
- 英國
- 法國
- 西班牙
- 義大利
- 其他歐洲地區
- 亞太地區
- 中國
- 印度
- 日本
- 澳洲
- 韓國
- 亞太其他地區
- 拉丁美洲
- 巴西
- 墨西哥
- 其他拉丁美洲地區
- 中東和非洲
- 沙烏地阿拉伯
- 南非
- 阿拉伯聯合大公國
- 其他中東和非洲地區
第9章:公司簡介
- BASF
- Dow
- Croda International
- Clariant
- Stepan Company
- Kao Corporation
- WHEATOLEO
- Arkema Group
- Evonik Industries
- Innovative Chemical Technologies
- SEPPIC
The Global Natural Surfactant Market was valued at USD 22.5 billion in 2025 and is estimated to grow at a CAGR of 5.5% to reach USD 38.1 billion by 2035.
The market expansion is driven by heightened environmental awareness among consumers and the rising demand for biodegradable and sustainably sourced ingredients. Manufacturers across personal care, cleaning, food and beverage, and industrial sectors are increasingly shifting to natural surfactants over conventional petrochemical alternatives. This transition is supported by corporate sustainability initiatives and stringent regulatory frameworks that favor eco-friendly solutions. The food and beverage industry is adopting these ingredients as emulsifiers, stabilizers, and dispersants to meet clean-label and safety requirements, while consumer preference for minimally processed products fuels demand further. Likewise, personal care and cosmetics companies are incorporating plant-based, mild surfactants to provide skin-friendly, sulfate-free, and transparent formulations, driving market growth. The increasing adoption of natural surfactants across diverse applications underscores their expanding role in sustainable industrial and consumer product development.
| Market Scope | |
|---|---|
| Start Year | 2025 |
| Forecast Year | 2026-2035 |
| Start Value | $22.5 Billion |
| Forecast Value | $38.1 Billion |
| CAGR | 5.5% |
The plant-based surfactants segment reached USD 15.2 billion in 2025, due to their renewable nature, wide availability, cost-effectiveness, and alignment with sustainability goals. Vegetable oils, sugar-based feedstocks, and coconut oil derivatives are commonly used across personal care, household cleaning, and industrial formulations. In contrast, animal-derived surfactants are limited to niche applications due to regulatory constraints and rising consumer demand for vegan and cruelty-free products.
The anionic surfactants segment accounted for USD 8.6 billion in 2025 due to their superior cleansing, emulsifying, and foaming abilities, essential in detergents, shampoos, and industrial cleaning products. Nonionic surfactants are also witnessing rapid adoption as they offer excellent stability, mildness, and compatibility across personal care, agricultural, and industrial formulations, expanding their application scope.
North America Natural Surfactant Market generated USD 5.5 billion in 2025. The region's expansion is fueled by consumer preference for eco-friendly and biodegradable products in personal care, home care, and industrial cleaning applications. The United States leads due to strong environmental regulations, consumer awareness, and advanced chemical production capabilities. Canada's market is growing as natural cosmetics and plant-based product adoption rise, while investments in biotechnology and fermentation-based surfactant production further support regional momentum.
Key players in the Global Natural Surfactant Market include Clariant, Dow, Evonik Industries, Arkema Group, Stepan Company, WHEATOLEO, BASF, Croda International, Innovative Chemical Technologies, Kao Corporation, and SEPPIC. Companies in the Natural Surfactant Market are strengthening their presence by investing in R&D to develop bio-based and sustainable products with enhanced performance and compatibility across applications. Strategic partnerships with agricultural and biotechnology firms enable access to renewable feedstocks and innovative fermentation processes. Firms focus on product diversification to cater to personal care, food, and industrial segments while meeting regulatory compliance and eco-certification standards. Expanding global manufacturing capacity and leveraging digital platforms for marketing and distribution improve reach. Additionally, companies emphasize transparency, sustainability messaging, and educational campaigns to build consumer trust and differentiate their offerings in a competitive market.
Table of Contents
Chapter 1 Methodology & Scope
- 1.1 Market scope and definition
- 1.2 Research design
- 1.2.1 Research approach
- 1.2.2 Data collection methods
- 1.3 Data mining sources
- 1.3.1 Global
- 1.3.2 Regional/Country
- 1.4 Base estimates and calculations
- 1.4.1 Base year calculation
- 1.4.2 Key trends for market estimation
- 1.5 Primary research and validation
- 1.5.1 Primary sources
- 1.6 Forecast model
- 1.7 Research assumptions and limitations
Chapter 2 Executive Summary
- 2.1 Industry 360° synopsis
- 2.2 Key market trends
- 2.2.1 Regional
- 2.2.2 Source
- 2.2.3 Product
- 2.2.4 Application
- 2.3 TAM Analysis, 2026-2035
- 2.4 CXO perspectives: Strategic imperatives
- 2.4.1 Executive decision points
- 2.4.2 Critical success factors
- 2.5 Future Outlook and Strategic Recommendations
Chapter 3 Industry Insights
- 3.1 Industry ecosystem analysis
- 3.1.1 Supplier Landscape
- 3.1.2 Profit Margin
- 3.1.3 Value addition at each stage
- 3.1.4 Factor affecting the value chain
- 3.1.5 Disruptions
- 3.2 Industry impact forces
- 3.2.1 Growth drivers
- 3.2.1.1 Growing consumer preference for eco-friendly products
- 3.2.1.2 Expanding applications in food and beverage sector
- 3.2.1.3 Rising demand in personal care and cosmetics industries
- 3.2.2 Industry pitfalls and challenges
- 3.2.2.1 High production costs
- 3.2.2.2 Limited availability of raw materials
- 3.2.3 Market opportunities
- 3.2.3.1 Expansion of Biosurfactant Production through Biotechnology
- 3.2.3.2 Rising Demand for Sustainable Ingredients in Personal Care and Home Care Products
- 3.2.1 Growth drivers
- 3.3 Growth potential analysis
- 3.4 Regulatory landscape
- 3.4.1 North America
- 3.4.2 Europe
- 3.4.3 Asia Pacific
- 3.4.4 Latin America
- 3.4.5 Middle East & Africa
- 3.5 Porter's analysis
- 3.6 PESTEL analysis
- 3.7 Price trends
- 3.7.1 By region
- 3.7.2 Product type
- 3.8 Future market trends
- 3.9 Technology and Innovation Landscape
- 3.9.1 Current technological trends
- 3.9.2 Emerging technologies
- 3.10 Patent Landscape
- 3.11 Trade statistics (HS code) (Note: the trade statistics will be provided for key countries only)
- 3.11.1 Major importing countries
- 3.11.2 Major exporting countries
- 3.12 Sustainability and environmental aspects
- 3.12.1 Sustainable practices
- 3.12.2 Waste reduction strategies
- 3.12.3 Energy efficiency in production
- 3.12.4 Eco-friendly initiatives
Chapter 4 Competitive Landscape, 2025
- 4.1 Introduction
- 4.2 Company market share analysis
- 4.2.1 By region
- 4.2.1.1 North America
- 4.2.1.2 Europe
- 4.2.1.3 Asia Pacific
- 4.2.1.4 LATAM
- 4.2.1.5 MEA
- 4.2.1 By region
- 4.3 Company matrix analysis
- 4.4 Competitive analysis of major market players
- 4.5 Competitive positioning matrix
- 4.6 Key developments
- 4.6.1 Mergers & acquisitions
- 4.6.2 Partnerships & collaborations
- 4.6.3 New product launches
- 4.6.4 Expansion plans
Chapter 5 Market Estimates and Forecast, By Source, 2022 - 2035 (USD Billion) (Kilo Tons)
- 5.1 Key trends
- 5.2 Plant-based
- 5.3 Animal-based
- 5.4 Microbial/Fermentation-based
Chapter 6 Market Estimates and Forecast, By Product, 2022 - 2035 (USD Billion) (Kilo Tons)
- 6.1 Key trends
- 6.2 Anionic surfactants
- 6.3 Cationic surfactants
- 6.4 Nonionic surfactants
- 6.5 Amphoteric surfactants
Chapter 7 Market Estimates and Forecast, By Application, 2022 - 2035 (USD Billion) (Kilo Tons)
- 7.1 Key trends
- 7.2 Personal Care
- 7.3 Industrial and Institutional Cleaning
- 7.4 Agriculture
- 7.5 Pharmaceuticals
- 7.6 Oilfield Chemicals
- 7.7 Others (Textile, food & Beverage)
Chapter 8 Market Estimates and Forecast, By Region, 2022 - 2035 (USD Billion) (Kilo Tons)
- 8.1 Key trends
- 8.2 North America
- 8.2.1 U.S.
- 8.2.2 Canada
- 8.3 Europe
- 8.3.1 Germany
- 8.3.2 UK
- 8.3.3 France
- 8.3.4 Spain
- 8.3.5 Italy
- 8.3.6 Rest of Europe
- 8.4 Asia Pacific
- 8.4.1 China
- 8.4.2 India
- 8.4.3 Japan
- 8.4.4 Australia
- 8.4.5 South Korea
- 8.4.6 Rest of Asia Pacific
- 8.5 Latin America
- 8.5.1 Brazil
- 8.5.2 Mexico
- 8.5.3 Rest of Latin America
- 8.6 Middle East and Africa
- 8.6.1 Saudi Arabia
- 8.6.2 South Africa
- 8.6.3 UAE
- 8.6.4 Rest of Middle East and Africa
Chapter 9 Company Profiles
- 9.1 BASF
- 9.2 Dow
- 9.3 Croda International
- 9.4 Clariant
- 9.5 Stepan Company
- 9.6 Kao Corporation
- 9.7 WHEATOLEO
- 9.8 Arkema Group
- 9.9 Evonik Industries
- 9.10 Innovative Chemical Technologies
- 9.11 SEPPIC


