


 |
市場調查報告書
商品編碼
2019236
受控環境農業市場機會、成長要素、產業趨勢分析及2026-2035年預測Controlled Environment Agriculture (CEA) Market Opportunity, Growth Drivers, Industry Trend Analysis, and Forecast 2026 - 2035 |
||||||
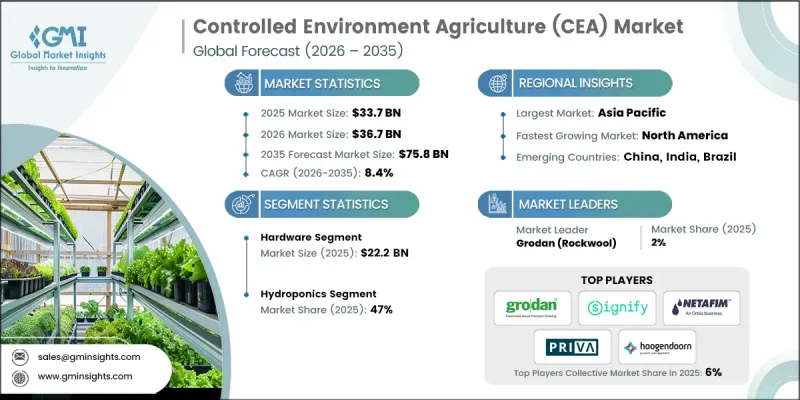
全球受控環境農業(CEA)市場預計到 2025 年價值 337 億美元,預計到 2035 年將以 8.4% 的複合年成長率成長至 758 億美元。
該行業正在經歷一場變革,以完全可控的永續生產環境取代依賴天氣、土壤和季節條件的傳統耕作方式。氣候可控環境(CEA)使生產者能夠減少對自然因素的依賴,同時全年持續生產高品質的農作物。推動這項轉變的關鍵因素包括耕地面積的減少、消費者對可追溯性和新鮮度的需求不斷成長,以及對減少資源和化學品使用的重視。生產者正在嘗試溫室、垂直農場和混合設施,以最佳化生產效率,平衡技術投資、營運成本和作物特定需求。零售商和食品公司正與CEA供應商合作,以確保可靠的本地農產品供應,而新參與企業則採用節能照明、自動化系統和創新的省力技術來提高生產力和永續性。儘管諸如巨額資本投資和技術純熟勞工短缺等挑戰依然存在,但市場仍在穩步成熟。
| 市場範圍 | |
|---|---|
| 開始年份 | 2025 |
| 預測期 | 2026-2035 |
| 上市時的市場規模 | 337億美元 |
| 預測金額 | 758億美元 |
| 複合年成長率 | 8.4% |
預計到2025年,硬體市場規模將達到222億美元。硬體是現代室內農業系統的基礎,負責控制光照、溫度、濕度、氣流和營養供應。可靠的硬體對於維持穩定的生長環境至關重要,也是溫室、垂直農場和植物工廠持續生產作物不可或缺的要素。如果沒有可靠的硬體,種植者就無法獲得穩定的產量或保持最佳的作物質量,這凸顯了硬體在封閉式農業(CEA)運作中的關鍵作用。
到2025年,水耕技術將佔據47%的市場。水耕系統無需土壤,即可提供高度可控的生長環境,直接為植物提供水、養分和氧氣。這種方法最大限度地提高了資源利用效率,同時有效應對了土壤傳播病害、蟲害和天氣波動等常見的農業挑戰。透過控制投入品的供應,可以確保產量和品質的穩定,這使得水耕成為追求全年穩定生產的生產者的理想選擇。此外,水耕還能最佳化空間和光照的利用,與傳統耕作方式相比,提高了平方公尺的產量。
美國受控環境農業(CEA)市場佔據78%的市場佔有率,預計2025年市場規模將達到60億美元。零售商和餐飲服務業對本地採購、無農藥農產品的需求推動了市場成長,因為他們需要可靠、高品質的農作物。溫室和垂直農業產能的擴張滿足了這一需求,而經驗豐富的生產商、技術供應商和自動化專家的存在則促進了新計畫的快速擴展。北美完善的基礎設施、技術嫻熟的勞動力和成熟的供應鏈促進了先進CEA解決方案的快速採用和部署,進一步增強了該地區市場的成長和穩定性。
目錄
第1章:調查方法
- 研究途徑
- 品質改進計劃
- GMI人工智慧政策和資料完整性計劃
- 資訊來源一致性協議
- GMI人工智慧政策和資料完整性計劃
- 調查軌跡和置信度評分
- 調查和路線的組成部分
- 評分組成部分
- 數據收集
- 主要來源部分列表
- 資料探勘資訊來源
- 付費資訊來源
- 區域資訊來源
- 付費資訊來源
- 基本估算和計算方法
- 每種方法中基準年的計算
- 預測模型
- 量化市場影響分析
- 生長參數對預測的數學影響
- 量化市場影響分析
- 關於調查透明度的補充信息
- 資訊來源歸屬框架
- 品質保證指標
- 對信任的承諾
第2章執行摘要
第3章業界考察
- 生態系分析
- 原物料供應商
- 零件製造商
- 技術提供者
- 系統整合商
- 顧問和工程公司
- 經銷商和零售商
- 最終用戶
- 階段增加值
- 影響產業的因素
- 促進因素
- 對清潔、可追溯農產品的需求日益成長
- 耕地減少與氣候變幻莫測
- 室內農業技術的進步
- 產業潛在風險與挑戰
- 高昂的初始投資和營運成本
- 對熟練技術專家的需求
- 機會
- 擴大都市區和現場的糧食生產
- 可再生能源與智慧自動化的融合
- 促進因素
- 成長潛力分析
- 未來市場趨勢
- 科技與創新趨勢
- LED照明技術的發展
- 空調系統技術的進步【解決方案的核心】
- 精確溫濕度控制的要求
- 能源效率標準和基準(千瓦/平方英尺)
- 二氧化碳濃度及管理系統
- 與物聯網和建築自動化平台整合
- 按設施類型分類的暖通空調系統選擇標準和規格
- CEA空調設備供應商的競爭格局
- 自動化和機器人技術的融合
- 物聯網和感測器技術
- 營養輸送系統的創新
- 水資源管理技術
- 專利趨勢(基於初步調查)
- 專利申請趨勢(2018-2024)
- 主要技術領域(照明、空調、自動化)
- 專利的區域分佈
- 主要專利持有人
- 新興創新叢集
- 價格分析(基於初步調查)
- 對過去價格趨勢的分析(基於初步研究)
- 根據業務類型分類的定價策略(高階/價值/成本加成)(基於初步調查)
- 區域價格波動
- 組件成本結構
- 價格彈性分析
- 監理情勢
- 標準和合規要求
- 區域法規結構
- 認證標準
- 貿易數據分析(基於初步調查)
- 進出口數量和價值趨勢(基於初步調查)
- 主要貿易走廊和關稅的影響(基於初步調查)
- 設備貿易的區域趨勢
- 貿易監管壁壘
- 人工智慧和生成式人工智慧對市場的影響
- 利用人工智慧改造現有經營模式
- GenAI 各細分市場的應用案例與部署藍圖
- 風險、限制和監管考量
- 波特五力分析
- PESTEL 分析
- 生產能力和生產趨勢(基於初步調查)
- 按地區和主要生產商分類的設備產能(基於初步調查)
- 運轉率和擴張計劃(基於初步調查)
第4章 競爭情勢
- 介紹
- 企業市佔率分析
- 企業矩陣分析
- 主要市場公司的競爭分析
- Product portfolio comparison
- Geographic footprint analysis
- Financial performance benchmarking
- Technology partnerships &component suppliers
- 競爭定位矩陣
- 主要進展
- 併購
- 夥伴關係與合作
- 新產品發布
- 業務拓展計劃
第5章 市場估計與預測:依組件分類,2022-2035年
- 硬體
- 照明
- 空調系統
- 暖通空調系統
- 濕度控制
- 二氧化碳管理
- 感應器
- 灌溉系統
- 研究與機構
- 軟體
- 農業管理軟體
- 數據分析
- 遠端監控
- 其他
- 服務
- 安裝
- 維護
- 諮詢
第6章 市場估價與預測:依設施類型分類,2022-2035年
- 溫室
- 垂直農場
- 其他
第7章 市場估計與預測:依技術分類,2022-2035年
- 水耕法
- 氣耕
- 土壤栽培(室內栽培)
第8章 市場估算與預測:依作物分類,2022-2035年
- 蔬菜
- 水果
- 土壤耕作/覆蓋耕作
第9章 市場估計與預測:依最終用途分類,2022-2035年
- 商業的
- 大型商業設施(超過 50,000 平方英尺)
- 小規模商業地產(小於50,000平方英尺)
- 住宅
- 其他
第10章 市場估價與預測:依地區分類,2022-2035年
- 北美洲
- 美國
- 加拿大
- 歐洲
- 英國
- 德國
- 法國
- 義大利
- 西班牙
- 俄羅斯
- 荷蘭
- 其他歐洲地區
- 亞太地區
- 中國
- 印度
- 日本
- 韓國
- 澳洲
- 亞太其他地區
- 拉丁美洲
- 巴西
- 墨西哥
- 阿根廷
- 其他拉丁美洲地區
- 中東和非洲(MEA)
- 南非
- 沙烏地阿拉伯
- 阿拉伯聯合大公國
- 其他中東和非洲地區
第11章:公司簡介
- Heliospectra
- Netafim
- Freight Farms
- iFarm
- Koidra
- Urban Crop Solutions
- Agritecture
- Priva
- Signify
- Fluence
- Grodan
- OSRAM
- Hoogendoorn
- Argus Controls
- Ridder
The Global Controlled Environment Agriculture (CEA) Market was valued at USD 33.7 billion in 2025 and is estimated to grow at a CAGR of 8.4% to reach USD 75.8 billion by 2035.
The industry is undergoing a transformation where traditional farming methods reliant on weather, soil, and seasonal conditions are being replaced with fully controlled and sustainable production environments. CEA enables growers to produce consistent, high-quality crops year-round while reducing dependence on natural factors. Key drivers of this shift include the declining availability of farmland, rising consumer demand for traceable and fresh produce, and a focus on reducing resource use and chemical inputs. Growers are experimenting with greenhouses, vertical farms, and hybrid facilities to optimize production efficiency, balancing technology investments, operating costs, and crop-specific needs. Retailers and food companies are partnering with CEA providers to secure dependable, locally sourced produce, while new entrants are introducing energy-efficient lighting, automation systems, and innovative labor-saving technologies to improve productivity and sustainability. Although high capital investments and skilled labor shortages remain challenges, the market continues to mature steadily.
| Market Scope | |
|---|---|
| Start Year | 2025 |
| Forecast Year | 2026-2035 |
| Start Value | $33.7 Billion |
| Forecast Value | $75.8 Billion |
| CAGR | 8.4% |
The hardware segment accounted for USD 22.2 billion in 2025. Hardware forms the backbone of modern indoor farming systems, controlling light, temperature, humidity, airflow, and nutrient delivery. Reliable hardware is essential to maintain stable growing conditions, making it indispensable for continuous crop production across greenhouses, vertical farms, and plant factories. Without dependable hardware, growers cannot achieve consistent yields or maintain optimal crop quality, highlighting its critical role in CEA operations.
The hydroponics segment held a 47% share in 2025. Hydroponic systems provide a soil-free, highly controlled environment, supplying plants with water, nutrients, and oxygen directly. This method maximizes resource efficiency while mitigating common agricultural challenges such as soil-borne diseases, pests, and weather variability. Controlled input delivery ensures stable yields in both quantity and quality, making hydroponics the preferred choice for growers aiming for reliable, year-round production. Hydroponics also optimizes space and light usage, enabling higher productivity per square meter compared to traditional farming methods.
U.S. Controlled Environment Agriculture (CEA) Market held 78% share, generating USD 6 billion in 2025. Demand for locally grown, pesticide-free produce drives growth, as retailers and food service providers seek reliable, high-quality crops. Expansion in greenhouse and vertical farm capacities supports this demand, while the presence of experienced growers, technology providers, and automation experts helps new projects scale quickly. North America's strong infrastructure, skilled workforce, and mature supply chain facilitate rapid adoption and deployment of advanced CEA solutions, enhancing market growth and stability in the region.
Key players operating in the Global Controlled Environment Agriculture (CEA) Market include Heliospectra, Netafim, Freight Farms, iFarm, Koidra, Urban Crop Solutions, Agritecture, Priva, Signify, Fluence, Grodan, OSRAM, Hoogendoorn, Argus Controls, and Ridder. Companies in the Controlled Environment Agriculture (CEA) Market are adopting multiple strategies to strengthen their presence and expand market foothold. They are investing heavily in research and development to improve energy-efficient lighting, climate control systems, and automation technologies, enhancing crop yield and consistency. Strategic collaborations with retailers, foodservice operators, and technology partners help integrate innovative solutions into commercial operations. Geographic expansion into high-demand regions and targeting urban areas enables better access to end consumers. Firms are also emphasizing sustainability by optimizing water, nutrient, and energy usage while adopting eco-friendly materials.
Table of Contents
Chapter 1 Research Methodology
- 1.1 Research approach
- 1.2 Quality Commitments
- 1.2.1 GMI AI policy & data integrity commitment
- 1.2.1.1 Source consistency protocol
- 1.2.1 GMI AI policy & data integrity commitment
- 1.3 Research Trail & Confidence Scoring
- 1.3.1 Research Trail Components
- 1.3.2 Scoring Components
- 1.4 Data Collection
- 1.4.1 Partial list of primary sources
- 1.5 Data mining sources
- 1.5.1 Paid sources
- 1.5.1.1 Sources, by region
- 1.5.1 Paid sources
- 1.6 Base estimates and calculations
- 1.6.1 Base year calculation for any one approach
- 1.7 Forecast model
- 1.7.1 Quantified market impact analysis
- 1.7.1.1 Mathematical impact of growth parameters on forecast
- 1.7.1 Quantified market impact analysis
- 1.8 Research transparency addendum
- 1.8.1 Source attribution framework
- 1.8.2 Quality assurance metrics
- 1.8.3 Our commitment to trust
Chapter 2 Executive Summary
- 2.1 Industry 360° synopsis, 2022 - 2035
- 2.2 Key market trends
- 2.2.1 Country
- 2.2.2 Component
- 2.2.3 Facility Type
- 2.2.4 Technology
- 2.2.5 Crop
- 2.2.6 End use
Chapter 3 Industry Insights
- 3.1 Industry ecosystem analysis
- 3.1.1 Raw material suppliers
- 3.1.2 Component manufacturers
- 3.1.3 Technology providers
- 3.1.4 System integrators
- 3.1.5 Consulting & engineering firms
- 3.1.6 Distributors & retailers
- 3.1.7 End users
- 3.1.8 Value addition by stage
- 3.2 Industry impact forces
- 3.2.1 Growth drivers
- 3.2.1.1 Rising Demand for Clean and Traceable Produce
- 3.2.1.2 Declining Availability of Arable Land and Unpredictable Climate
- 3.2.1.3 Advancements in Indoor Farming Technologies
- 3.2.2 Industry pitfalls & challenges
- 3.2.2.1 High Initial Investment and Operating Costs
- 3.2.2.2 Need for Skilled Technical Expertise
- 3.2.3 Opportunities
- 3.2.3.1 Expansion of Urban and On-Site Food Production
- 3.2.3.2 Integration of Renewable Energy and Smart Automation
- 3.2.1 Growth drivers
- 3.3 Growth potential analysis
- 3.4 Future market trends
- 3.5 Technology and innovation landscape
- 3.5.1 LED lighting technology evolution
- 3.5.2 Climate control system advancements [solution core]
- 3.5.2.1 Precision temperature & humidity control requirements
- 3.5.2.2 Energy efficiency standards & benchmarks (kW per sq ft)
- 3.5.2.3 CO2 enrichment & management systems
- 3.5.2.4 Integration with IoT & building automation platforms
- 3.5.2.5 HVAC system sizing & specification by facility type
- 3.5.2.6 Competitive landscape for CEA climate control suppliers
- 3.5.3 Automation & robotics integration
- 3.5.4 IoT & sensor technology
- 3.5.5 Nutrient delivery system innovations
- 3.5.6 Water management technologies
- 3.6 Patent landscape (driven by primary research)
- 3.6.1 Patent filing trends (2018-2024)
- 3.6.2 Key technology areas (lighting, climate control, automation)
- 3.6.3 Geographic patent distribution
- 3.6.4 Top patent assignees
- 3.6.5 Emerging innovation clusters
- 3.7 Pricing analysis (driven by primary research)
- 3.7.1 Historical price trend analysis (driven by primary research)
- 3.7.2 Pricing strategy by player type (premium / value / cost-plus) (driven by primary research)
- 3.7.3 Regional price variations
- 3.7.4 Component cost structure
- 3.7.5 Price elasticity analysis
- 3.8 Regulatory landscape
- 3.8.1 Standards and compliance requirements
- 3.8.2 Regional regulatory frameworks
- 3.8.3 Certification standards
- 3.9 Trade data analysis (driven by primary research)
- 3.9.1 Import / export volume & value trends (driven by primary research)
- 3.9.2 Key trade corridors & tariff impact (driven by primary research)
- 3.9.3 Equipment trade flows by region
- 3.9.4 Regulatory barriers to trade
- 3.10 Impact of ai & generative ai on the market
- 3.10.1 AI-driven disruption of existing business models
- 3.10.2 Genai use cases & adoption roadmap by segment
- 3.10.3 Risks, limitations & regulatory considerations
- 3.11 Porter's analysis
- 3.12 PESTEL analysis
- 3.13 Capacity & production landscape (Driven by Primary Research)
- 3.13.1 Installed capacity by region & key producer (Driven by Primary Research)
- 3.13.2 Capacity utilization rates & expansion pipelines (Driven by Primary Research)
Chapter 4 Competitive Landscape, 2025
- 4.1 Introduction
- 4.2 Company market share analysis
- 4.2.1 North America
- 4.2.2 Europe
- 4.2.3 Asia Pacific
- 4.2.4 Latin America
- 4.2.5 Middle East and Africa
- 4.3 Company matrix analysis
- 4.4 Competitive analysis of major market players
- 4.4.1 Product portfolio comparison
- 4.4.2 Geographic footprint analysis
- 4.4.3 Financial performance benchmarking
- 4.4.4 Technology partnerships & component suppliers
- 4.5 Competitive positioning matrix
- 4.6 Key developments
- 4.6.1 Mergers & acquisitions
- 4.6.2 Partnerships & collaborations
- 4.6.3 New product launches
- 4.6.4 Expansion plans
Chapter 5 Market Estimates & Forecast, By Component, 2022-2035 ($Bn)
- 5.1 Key trends
- 5.2 Hardware
- 5.2.1 Lighting
- 5.2.2 Climate control systems
- 5.2.2.1 HVAC Systems
- 5.2.2.2 Humidity Control
- 5.2.2.3 CO2 Management
- 5.2.3 Sensors
- 5.2.4 Irrigation systems
- 5.2.5 Research & Institutional
- 5.3 Software
- 5.3.1 Farm management software
- 5.3.2 Data analytics
- 5.3.3 Remote monitoring
- 5.3.4 Others
- 5.4 Service
- 5.4.1 Installation
- 5.4.2 Maintenance
- 5.4.3 Consulting
Chapter 6 Market Estimates & Forecast, By Facility Type, 2022-2035 ($Bn)
- 6.1 Key trends
- 6.2 Green House
- 6.3 Vertical Farms
- 6.4 Others
Chapter 7 Market Estimates & Forecast, By Technology, 2022-2035 ($Bn)
- 7.1 Key trends
- 7.2 Hydroponics
- 7.3 Aeroponics
- 7.4 Soil-Based Under Cover
Chapter 8 Market Estimates & Forecast, By Crop, 2022-2035 ($Bn)
- 8.1 Key trends
- 8.2 Vegetables
- 8.3 Fruits
- 8.4 Soil-Based Under Cover
Chapter 9 Market Estimates & Forecast, By End use, 2022-2035 ($Bn)
- 9.1 Key trends
- 9.2 Commercial
- 9.2.1 Large-scale commercial (>50,000 sq ft)
- 9.2.2 Small-scale commercial (<50,000 sq ft)
- 9.3 Residential
- 9.4 Others
Chapter 10 Market Estimates & Forecast, By Region, 2022-2035 ($Bn)
- 10.1 Key trends
- 10.2 North America
- 10.2.1 U.S.
- 10.2.2 Canada
- 10.3 Europe
- 10.3.1 UK
- 10.3.2 Germany
- 10.3.3 France
- 10.3.4 Italy
- 10.3.5 Spain
- 10.3.6 Russia
- 10.3.7 Netherlands
- 10.3.8 Rest of Europe
- 10.4 Asia Pacific
- 10.4.1 China
- 10.4.2 India
- 10.4.3 Japan
- 10.4.4 South Korea
- 10.4.5 Australia
- 10.4.6 Rest of Asia Pacific
- 10.5 Latin America
- 10.5.1 Brazil
- 10.5.2 Mexico
- 10.5.3 Argentina
- 10.5.4 Rest of Latin America
- 10.6 MEA
- 10.6.1 South Africa
- 10.6.2 Saudi Arabia
- 10.6.3 UAE
- 10.6.4 Rest of MEA
Chapter 11 Company Profiles
- 11.1 Heliospectra
- 11.2 Netafim
- 11.3 Freight Farms
- 11.4 iFarm
- 11.5 Koidra
- 11.6 Urban Crop Solutions
- 11.7 Agritecture
- 11.8 Priva
- 11.9 Signify
- 11.10 Fluence
- 11.11 Grodan
- 11.12 OSRAM
- 11.13 Hoogendoorn
- 11.14 Argus Controls
- 11.15 Ridder
 海水農業市場-全球產業規模、佔有率、趨勢、機會和預測:按水源、技術、作物類型、應用、地區和競爭格局分類,2021-2031年
 住宅樹木管理服務市場:依服務類型、顧客類型、樹木類型、服務頻率及地區分類受控環境農業市場:按類型、組成部分、應用和地區分類
 基於半導體的作物產量最佳化感測器市場分析及預測(至2035年):按類型、產品類型、服務、技術、組件、應用、部署類型、最終用戶和功能分類農業與林業服務市場-全球產業規模、佔有率、趨勢、機會、預測:按類型、性質、應用、地區和競爭格局分類,2021-2031年農業建築市場-全球產業規模、佔有率、趨勢、機會和預測,按一體化程度、結構、應用、地區和競爭格局分類,2020-2030年預測
 GMIPulse - 農業市場情報訂閱
 全球作物產量預測機器學習市場全球農業市場
 2032 年作物產量預測市場機器學習預測:按組件、部署模型、農場規模、最終用戶和地區進行的全球分析