


 |
市場調查報告書
商品編碼
2019216
工業用燃氣渦輪機市場:商業機會、成長要素、產業趨勢分析及2026-2035年預測Industrial Gas Turbine Market Opportunity, Growth Drivers, Industry Trend Analysis, and Forecast 2026 - 2035 |
||||||
全球工業用燃氣渦輪機市場預計到 2025 年價值 93 億美元,預計到 2035 年將達到 275 億美元,年複合成長率為 11.3%。
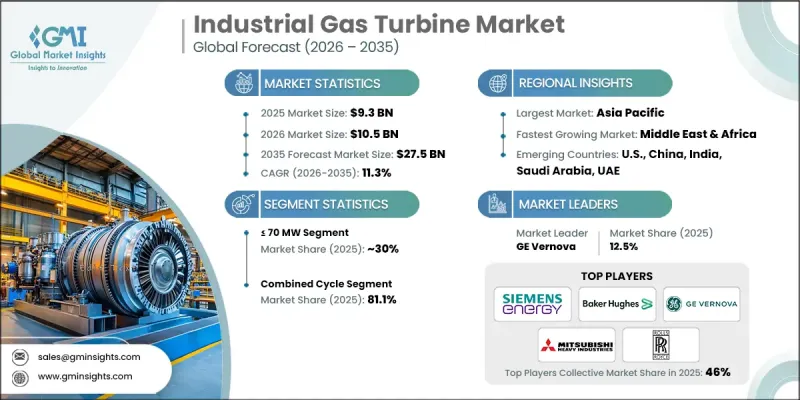
市場成長主要受日益嚴格的環境法規和低排放技術普及的推動。數位化監控解決方案和預測性維護的整合提高了系統可靠性,進一步促進了產業擴張。工業燃氣渦輪機是廣泛應用於工業領域的高功率發電系統,可提供機械或電力輸出。這些燃氣渦輪機採用布雷頓循環運行,將壓縮空氣和燃料混合以產生高效的旋轉能量。對能源效率和永續性的日益成長的需求推動了聯合循環發電廠的普及。燃氣渦輪機因其燃料柔軟性、先進的控制系統、低排放和運行可靠性而備受青睞。可再生能源發電的日益普及催生了對可靠、反應迅速的電力需求,以彌補波動性較大的太陽能和風能發電。此外,燃煤發電廠的退役和現有設施併入電網也進一步增強了市場前景。
| 市場範圍 | |
|---|---|
| 開始年份 | 2025 |
| 預測期 | 2026-2035 |
| 上市時的市場規模 | 93億美元 |
| 預測金額 | 275億美元 |
| 複合年成長率 | 11.3% |
到2025年,70兆瓦至300兆瓦的風力發電機市場規模將達34億美元。這主要得益於中型電力公司在大規模基本負載電廠和小規模分散式發電系統之間運作。這些風力發電機因其能夠提供靈活的電網支援、在尖峰負載期間保持穩定以及高效管理中等能源需求而備受青睞。其適應性強,使其成為工業設施和需要快速增減輸出以應對能源需求波動的電網的理想選擇。此外,隨著向清潔能源來源轉型地區的增加,該細分市場也將受益,因為這些風力發電機可以與可再生能源互補,確保不間斷供電。增加對現有發電基礎設施的維修和現代化投資,以提高能源效率和排放性能,也推動了該細分市場的成長,並進一步提升了其市場重要性。
預計到2035年,開式循環技術市場將以11.5%的複合年成長率成長,這主要得益於工業和商業活動中對分散式電力解決方案日益成長的需求,以及對提高電網穩定性的迫切需求。與聯合循環系統相比,開式循環燃氣渦輪機因其啟動時間更短、操作更簡便、成本效益更高而備受關注,使其適用於尖峰負載管理和緊急備用電源等應用。持續的技術創新,包括先進的渦輪葉片設計、改進的燃燒技術以及與數位監控系統的整合,正在提高燃油效率並降低排放。日益嚴格的環境法規要求以及對低碳能源發電的推廣,進一步推動了開式循環解決方案的普及。工業界對模組化和擴充性發電裝置的需求不斷成長,確保了該領域在已開發市場和新興市場都擁有長期的發展潛力。
美國工業用燃氣渦輪機市場佔70%的佔有率,預計到2025年市場規模將達到13.837億美元。全美各地的電力公司越來越依賴這些燃氣渦輪機作為快速反應的電源,以平衡太陽能和風能等間歇性再生能源來源,並確保電網穩定。隨著可再生能源滲透率的提高和國家電網的不斷現代化,高度柔軟性的燃氣渦輪機已成為抑低尖峰負載、負載平衡和緊急備用電源的關鍵設備。此外,美國工業和商業部門正在投資高效能燃氣渦輪機,以在保持可靠電力輸出的同時減少排放。政府對低排放技術的支持、老舊石化燃料發電廠的退役以及不斷成長的工業能源需求也推動了市場發展,使美國成為工業燃氣渦輪機應用的重要中心。
目錄
第1章:調查方法和範圍
第2章執行摘要
第3章業界考察
- 生態系分析
- 原物料供應及採購分析
- 生產能力評估
- 供應鏈韌性與風險因素
- 配電網路分析
- 影響產業的因素
- 促進因素
- 產業潛在風險與挑戰
- 監理情勢
- 成長潛力分析
- 價格趨勢分析(美元/兆瓦)
- 按地區
- 按產能
- 波特五力分析
- PESTEL 分析
- 工業用燃氣渦輪機成本結構分析
- 新機會和趨勢
- 數位化和物聯網整合
- 未開發市場和應用領域的成長
- 投資分析及未來展望
第4章 競爭情勢
- 介紹
- 企業市佔率分析:按地區分類
- 北美洲
- 歐洲
- 亞太地區
- 中東和非洲
- 拉丁美洲
- 競爭定位矩陣
- 主要進展
- 併購
- 夥伴關係與合作
- 新產品發布
- 業務拓展計劃及資金籌措
第5章 市場規模及預測:依產能分類,2022-2035年
- 70兆瓦或以下
- 70兆瓦至300兆瓦
- 超過300兆瓦
第6章 市場規模與預測:依產品分類,2022-2035年
- 航空衍生性商品
- 重負
第7章 市場規模及預測:依技術分類,2022-2035年
- 開式循環
- 複合循環
第8章 市場規模及預測:依應用領域分類,2022-2035年
- 發電
- 石油和天然氣
- 其他製造業
第9章 市場規模及預測:依地區分類,2022-2035年
- 北美洲
- 美國
- 加拿大
- 墨西哥
- 歐洲
- 英國
- 法國
- 德國
- 俄羅斯
- 義大利
- 荷蘭
- 波蘭
- 亞太地區
- 中國
- 澳洲
- 日本
- 印度
- 韓國
- 印尼
- 泰國
- 馬來西亞
- 中東和非洲
- 沙烏地阿拉伯
- 阿拉伯聯合大公國
- 卡達
- 科威特
- 阿曼
- 埃及
- 土耳其
- 巴林
- 伊拉克
- 南非
- 拉丁美洲
- 巴西
- 阿根廷
- 秘魯
- 智利
第10章:公司簡介
- Ansaldo Energia
- Auxitrol Weston
- Baker Hughes
- Bharat Heavy Electricals
- Destinus Energy
- Doncasters Group
- Doosan Enerbility
- Everllence
- Flex Energy Solutions
- FUJI INDUSTRIES
- GE Vernova
- IHI Corporation
- Kawasaki Heavy Industries
- Mitsubishi Heavy Industries
- MTU Aero Engines
- Rolls Royce
- Siemens Energy
- Solar Turbines
- VERICOR
- Wartsila
The Global Industrial Gas Turbine Market was valued at USD 9.3 billion in 2025 and is estimated to grow at a CAGR of 11.3% to reach USD 27.5 billion by 2035.
The market growth is fueled by stricter environmental regulations and the increasing adoption of low-emission technologies. The integration of digital monitoring solutions and predictive maintenance is enhancing system reliability, driving further industry expansion. Industrial gas turbines are high-power generation systems widely utilized in industries to deliver either mechanical or electrical output. Operating on the Brayton cycle, these turbines mix compressed air and fuel to produce efficient rotational energy. The adoption of combined cycle power plants is growing due to rising energy-efficiency requirements and sustainability initiatives. Gas turbines are favored for their fuel flexibility, advanced control systems, low emissions, and operational reliability. Rising renewable energy penetration is creating demand for reliable, dispatchable power to complement variable solar and wind generation, while coal plant retirements and brownfield grid connections are strengthening market prospects.
| Market Scope | |
|---|---|
| Start Year | 2025 |
| Forecast Year | 2026-2035 |
| Start Value | $9.3 Billion |
| Forecast Value | $27.5 Billion |
| CAGR | 11.3% |
The >70 MW - 300 MW segment accounted for USD 3.4 billion in 2025, primarily driven by medium-sized utilities that operate between large baseload plants and smaller distributed generation systems. These turbines are highly valued for their ability to provide flexible grid support, maintain stability during peak load periods, and enable efficient management of intermediate energy demands. Their adaptability makes them ideal for industrial operations and utility grids requiring rapid ramp-up and ramp-down capabilities to respond to fluctuations in energy demand. Additionally, the segment benefits from growing adoption in regions transitioning to cleaner energy sources, where these turbines can complement renewable power and ensure uninterrupted electricity supply. The segment's growth is also propelled by increasing investments in retrofitting and modernizing existing power infrastructure to improve energy efficiency and emissions performance, further reinforcing its market relevance.
The open cycle technology segment is projected to grow at a CAGR of 11.5% by 2035, supported by the rising need for distributed power solutions and enhanced grid stability in industrial and commercial operations. Open cycle turbines are gaining traction due to their fast start-up times, operational simplicity, and cost-effectiveness compared to combined cycle systems, making them suitable for peak load management and emergency backup applications. Continuous engineering innovations, including advanced turbine blade design, enhanced combustion techniques, and integration with digital monitoring systems, are improving fuel efficiency and lowering emissions. Compliance with stricter environmental regulations and the push for low-carbon energy generation further drives adoption of open cycle solutions. The growing industrial demand for modular, scalable power generation units ensures long-term expansion potential for this segment across both developed and emerging markets.
U.S. Industrial Gas Turbine Market accounted for 70% share, generating USD 1,383.7 million in 2025. Utilities across the U.S. increasingly depend on these turbines for rapid-response power to balance intermittent renewable energy sources such as solar and wind, ensuring consistent grid stability. The high penetration of renewable energy and ongoing modernization of the national grid has made flexible gas turbines critical for peak shaving, load balancing, and emergency backup. Moreover, U.S. industrial and commercial sectors are investing in high-efficiency turbines capable of reducing emissions while maintaining reliable power output. The market is also supported by government incentives for low-emission technologies, the retirement of older fossil fuel plants, and rising industrial energy demand, positioning the U.S. as a leading hub for industrial gas turbine deployment.
Major players in the Global Industrial Gas Turbine Market include Destinus Energy, Rolls Royce, Mitsubishi Heavy Industries, IHI Corporation, Solar Turbines, GE Vernova, Auxitrol Weston, Wartsila, Baker Hughes, Doncasters Group, Ansaldo Energia, Flex Energy Solutions, FUJI INDUSTRIES, Siemens Energy, VERICOR, Bharat Heavy Electricals, Doosan Enerbility, Everllence, Kawasaki Heavy Industries, and MTU Aero Engines. Companies in the Industrial Gas Turbine Market are strengthening their presence by investing in R&D to improve turbine efficiency, emissions control, and fuel flexibility. They are forming strategic partnerships with utilities, EPC contractors, and renewable energy providers to expand market reach. Manufacturers are also focusing on digitalization, including predictive maintenance and remote monitoring, to enhance reliability and customer support. Product customization, after-sales service, and long-term maintenance contracts are being leveraged to retain clients and secure recurring revenue streams. Geographic expansion, especially in emerging markets with rising energy demand, and participation in government clean energy programs are additional strategies used to solidify market foothold and capture long-term growth opportunities.
Table of Contents
Chapter 1 Methodology & Scope
- 1.1 Research design
- 1.2 Quality commitments
- 1.2.1 GMI AI policy & data integrity commitment
- 1.2.1.1 Source consistency protocol
- 1.2.1 GMI AI policy & data integrity commitment
- 1.3 Research trail & confidence scoring
- 1.3.1 Research trail components
- 1.3.2 Scoring components
- 1.4 Data collection
- 1.4.1 Partial list of primary sources
- 1.5 Data mining sources
- 1.5.1 Paid sources
- 1.5.1.1 Sources, by region
- 1.5.1 Paid sources
- 1.6 Base estimates and calculations
- 1.6.1 Base year calculation for any one approach
- 1.7 Forecast model
- 1.7.1 Quantified market impact analysis
- 1.7.1.1 Mathematical impact of growth parameters on forecast
- 1.7.1 Quantified market impact analysis
- 1.8 Research transparency addendum
- 1.8.1 Source attribution framework
- 1.8.2 Quality assurance metrics
- 1.8.3 Our commitment to trust
- 1.9 Market definitions
Chapter 2 Executive Summary
- 2.1 Industry synopsis, 2022 - 2035
- 2.1.1 Business trends
- 2.1.2 Capacity trends
- 2.1.3 Product trends
- 2.1.4 Technology trends
- 2.1.5 Application trends
- 2.1.6 Regional trends
Chapter 3 Industry Insights
- 3.1 Industry ecosystem analysis
- 3.1.1 Raw material availability & sourcing analysis
- 3.1.2 Manufacturing capacity assessment
- 3.1.3 Supply chain resilience & risk factors
- 3.1.4 Distribution network analysis
- 3.2 Industry impact forces
- 3.2.1 Growth drivers
- 3.2.2 Industry pitfalls & challenges
- 3.3 Regulatory landscape
- 3.4 Growth potential analysis
- 3.5 Price trend analysis (USD/MW)
- 3.5.1 By region
- 3.5.2 By capacity
- 3.6 Porter's analysis
- 3.6.1 Bargaining power of suppliers
- 3.6.2 Bargaining power of buyers
- 3.6.3 Threat of new entrants
- 3.6.4 Threat of substitutes
- 3.7 PESTEL analysis
- 3.7.1 Political factors
- 3.7.2 Economic factors
- 3.7.3 Social factors
- 3.7.4 Technological factors
- 3.7.5 Legal factors
- 3.7.6 Environmental factors
- 3.8 Cost structure analysis of industrial gas turbines
- 3.9 Emerging opportunities & trends
- 3.9.1 Digitalization & IoT integration
- 3.9.2 Growth in untapped markets & applications
- 3.10 Investment analysis & future prospects
Chapter 4 Competitive Landscape, 2026
- 4.1 Introduction
- 4.2 Company market share analysis, by region, 2025
- 4.2.1 North America
- 4.2.2 Europe
- 4.2.3 Asia Pacific
- 4.2.4 Middle East & Africa
- 4.2.5 Latin America
- 4.3 Competitive positioning matrix
- 4.4 Key developments
- 4.4.1 Mergers & acquisitions
- 4.4.2 Partnerships & collaborations
- 4.4.3 New product launches
- 4.4.4 Expansion plans & funding
Chapter 5 Market Size and Forecast, By Capacity, 2022 - 2035 (USD Million & MW)
- 5.1 Key trends
- 5.2 ≤ 70 MW
- 5.3 > 70 MW - 300 MW
- 5.4 > 300 MW
Chapter 6 Market Size and Forecast, By Product, 2022 - 2035 (USD Million & MW)
- 6.1 Key trends
- 6.2 Aero-derivative
- 6.3 Heavy duty
Chapter 7 Market Size and Forecast, By Technology, 2022 - 2035 (USD Million & MW)
- 7.1 Key trends
- 7.2 Open cycle
- 7.3 Combined cycle
Chapter 8 Market Size and Forecast, By Application, 2022 - 2035 (USD Million & MW)
- 8.1 Key trends
- 8.2 Power generation
- 8.3 Oil & gas
- 8.4 Other manufacturing
Chapter 9 Market Size and Forecast, By Region, 2022 - 2035 (USD Million & MW)
- 9.1 Key trends
- 9.2 North America
- 9.2.1 U.S.
- 9.2.2 Canada
- 9.2.3 Mexico
- 9.3 Europe
- 9.3.1 UK
- 9.3.2 France
- 9.3.3 Germany
- 9.3.4 Russia
- 9.3.5 Italy
- 9.3.6 Netherlands
- 9.3.7 Poland
- 9.4 Asia Pacific
- 9.4.1 China
- 9.4.2 Australia
- 9.4.3 Japan
- 9.4.4 India
- 9.4.5 South Korea
- 9.4.6 Indonesia
- 9.4.7 Thailand
- 9.4.8 Malaysia
- 9.5 Middle East & Africa
- 9.5.1 Saudi Arabia
- 9.5.2 UAE
- 9.5.3 Qatar
- 9.5.4 Kuwait
- 9.5.5 Oman
- 9.5.6 Egypt
- 9.5.7 Turkey
- 9.5.8 Bahrain
- 9.5.9 Iraq
- 9.5.10 South Africa
- 9.6 Latin America
- 9.6.1 Brazil
- 9.6.2 Argentina
- 9.6.3 Peru
- 9.6.4 Chile
Chapter 10 Company Profiles
- 10.1 Ansaldo Energia
- 10.2 Auxitrol Weston
- 10.3 Baker Hughes
- 10.4 Bharat Heavy Electricals
- 10.5 Destinus Energy
- 10.6 Doncasters Group
- 10.7 Doosan Enerbility
- 10.8 Everllence
- 10.9 Flex Energy Solutions
- 10.10 FUJI INDUSTRIES
- 10.11 GE Vernova
- 10.12 IHI Corporation
- 10.13 Kawasaki Heavy Industries
- 10.14 Mitsubishi Heavy Industries
- 10.15 MTU Aero Engines
- 10.16 Rolls Royce
- 10.17 Siemens Energy
- 10.18 Solar Turbines
- 10.19 VERICOR
- 10.20 Wartsila

