


 |
市場調查報告書
商品編碼
2019115
電子轉角系統市場:市場機會、成長要素、產業趨勢分析及2026-2035年預測e-Corner System Market Opportunity, Growth Drivers, Industry Trend Analysis, and Forecast 2026 - 2035 |
||||||
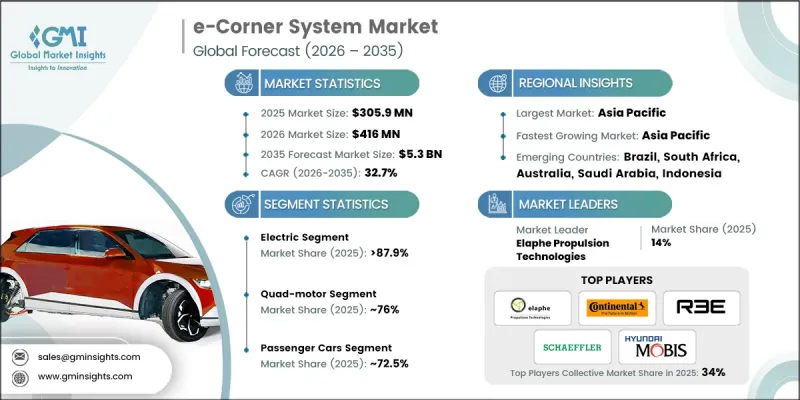
預計到 2025 年,全球電子轉角系統市場價值將達到 3.059 億美元,到 2035 年將以 32.7% 的複合年成長率成長至 53 億美元。
電動車輪轉向系統(e-Corner)產業正經歷快速成長,這主要得益於全球電動車(EV)的加速普及。這些系統尤其適用於現代電動車架構,因為它們將驅動、煞車、轉向和懸吊整合到一個緊湊的車輪模組中。這種整合使汽車製造商能夠提高車輛效率、降低機械複雜性並最大限度地利用車內空間和結構空間。同時,對更高車輛操控性的需求不斷成長也推動了市場擴張。先進的電動車輪轉向系統技術能夠精確控制車輛運動,進而提昇在狹窄空間內的駕駛性能,包括多方向行駛能力。日益成長的都市化和交通堵塞進一步加劇了對能夠在人口密集的城市環境中高效行駛的高機動性車輛的需求。隨著出行趨勢的演變,電動車輪轉向系統市場正成為推動下一代車輛設計的關鍵要素,它能夠提升安全性、操作柔軟性和整體駕駛性能。
| 市場範圍 | |
|---|---|
| 開始年份 | 2025 |
| 預測期 | 2026-2035 |
| 初始市場規模 | 3.059億美元 |
| 預測金額 | 53億美元 |
| 複合年成長率 | 32.7% |
預計到2025年,電動車市佔率將達到87.9%,到2035年市場規模將達到48億美元。在全球排放目標的推動下,向電動出行的轉型是該細分市場成長的主要驅動力。電動彎道系統在提升電動車的動力控制、操控精度和整體車輛性能方面發揮著至關重要的作用。隨著汽車製造商尋求先進的解決方案以提高效率並符合監管標準,電池式電動車的日益普及進一步刺激了市場需求。
到2025年,四電機配置車型將佔據76%的市場。這種配置能夠對每個車輪進行精確的扭力控制,從而提升操控性、穩定性和動力分配。更強大的扭力向量控制能力使車輛能夠有效適應不斷變化的路況,增強牽引力和駕駛性能。這種控制水準在需要高穩定性和反應性的應用中尤為重要,有助於推動e-Corner技術的更廣泛應用。
到2025年,中國將繼續保持在亞太地區的領先地位,佔據e-Corner系統市場38.2%的佔有率。快速的城市化發展和對高機動性車輛日益成長的需求正在推動主要市場的成長。 e-Corner系統提供的獨立車輪控制功能可實現先進的移動性,並提高車輛在擁擠環境中的操控性。在有利政策的支持下,電動車產量的強勁成長以及技術的不斷普及應用,進一步加速了e-Corner系統在乘用車和新興移動出行平台的應用。
目錄
第1章:調查方法和範圍
第2章執行摘要
第3章業界考察
- 生態系分析
- 供應商情況
- 利潤率
- 成本結構
- 每個階段增加的價值
- 影響價值鏈的因素
- 中斷
- 影響產業的因素
- 促進因素
- 對提高車輛移動性和先進停車解決方案的需求日益成長。
- 自動駕駛汽車和整合線傳和線控刹車技術的電動車的廣泛應用。
- 人們越來越關注車輛的安全、穩定性和動態控制。
- 輪內馬達技術和模組化電子角架構的進步
- 產業潛在風險與挑戰
- 高昂的開發和整合成本
- 與監管和標準化相關的挑戰
- 市場機遇
- 全球電動車(EV)普及率的提升
- 自動駕駛和智慧運輸解決方案的需求日益成長
- 輪內馬達與模組化底盤技術的融合正在逐步推進。
- 增加對先進城市交通和商用電動車平台的投資。
- 促進因素
- 監理情勢
- 北美洲
- 美國:聯邦機動車輛安全標準(FMVSS)
- 加拿大:加拿大機動車輛安全標準(CMVSS)
- 歐洲
- 德國:聯合國歐洲經濟委員會車輛法規/歐盟車輛類型認證(WVTA)
- 法國:歐盟車輛類型認證(WVTA)/聯合國歐洲經濟委員會車輛法規
- 英國:英國車輛類型認證(UKWVTA)
- 亞太地區
- 中國:GB汽車安全標準(國家標準)
- 印度:中央機動車輛法規 (CMVR) / 汽車產業標準 (AIS)
- 日本:道路車輛安全標準(國土交通省)
- 拉丁美洲
- 巴西:CONTRAN車輛安全法規
- 中東和非洲
- 南非:《國家道路交通法》/南非國家標準(SANS)
- 北美洲
- 波特五力分析
- PESTEL 分析
- 科技與創新趨勢
- 當前技術趨勢
- 新興技術
- 價格分析(基於初步調查)
- 對過去價格趨勢的分析
- 按玩家類型分類的定價策略
- 貿易統計(基於付費資料庫)
- 生產基地
- 消費中心
- 進出口
- 成本細分分析
- 專利分析(基於初步研究)
- 永續性和環境方面
- 永續計劃
- 減少廢棄物策略
- 生產中的能源效率
- 具有環保意識的舉措
- 關於碳足跡的考量
- 風險與韌性分析
- 技術風險評估
- 營運風險管理
- 安全風險框架
- 案例研究
- 人工智慧和生成式人工智慧對市場的影響
- 利用人工智慧改造現有經營模式
- 自動化系統設計與工作流程最佳化
- 自動化系統設計和佈局最佳化
- GenAI 用例和實施藍圖
- 系統自動配置和最佳化
- 即時監控與虛擬援助
- 預測性維護和性能報告
- 風險、限制和監管考量
- 預測假設和情境分析(基於初步研究)
- 基本案例-驅動複合年成長率的關鍵宏觀經濟與產業變量
- 樂觀情境-宏觀經濟與產業的順風
- 悲觀情景-宏觀經濟放緩或產業逆風
第4章 競爭情勢
- 介紹
- 企業市佔率分析
- 北美洲
- 歐洲
- 亞太地區
- 拉丁美洲
- 中東和非洲
- 主要市場公司的競爭分析
- 競爭定位矩陣
- 企業級分層基準測試
- 層級分類標準與選擇標準
- 按銷售額、地區和創新能力分類的層級定位矩陣。
- 主要進展
- 併購
- 夥伴關係和聯盟
- 新產品發布
- 業務拓展計劃及資金籌措
第5章 市場估算與預測:依馬達配置分類,2022-2035年
- 三引擎配置
- 四馬達配置
第6章 市場估價與預測:依車輛類型分類,2022-2035年
- 搭乘用車
- 轎車
- 掀背車
- SUV
- 商用車輛
- 輕型商用車(LCV)
- 中型商用車(MCV)
- 重型商用車(HCV)
第7章 市場估計與預測:依促進因素分類,2022-2035年
- 內燃機(ICE)
- 電
- BEV
- HEV
- PHEV
- FCEV
第8章 市場估計與預測:依車輛組成分類,2022-2035年
- 兩輪驅動(2WD)
- 全輪驅動(AWD)
- 四輪驅動(4WD)
第9章 市場估計與預測:依技術分類,2022-2035年
- 油壓
- 電
- 其他
第10章 市場估價與預測:依地區分類,2022-2035年
- 北美洲
- 美國
- 加拿大
- 歐洲
- 英國
- 德國
- 法國
- 義大利
- 西班牙
- 俄羅斯
- 北歐國家
- 亞太地區
- 中國
- 印度
- 日本
- 澳洲
- 韓國
- 東南亞
- 拉丁美洲
- 巴西
- 墨西哥
- 阿根廷
- 中東和非洲(MEA)
- 阿拉伯聯合大公國
- 南非
- 沙烏地阿拉伯
第11章:公司簡介
- Global leaders
- Aptiv
- Continental
- Denso
- Faurecia
- GKN Automotive
- Hitachi
- Schaeffler
- Siemens
- Valeo
- ZF Friedrichshafen
- 本地球員
- Allison Transmission
- Benteler
- BorgWarner Drive Systems
- Dana
- Elaphe Propulsion Technologies
- Indigo Technologies
- Meritor
- NSK
- Parker Hannifin
- Protean Electric
- 新興企業
- Canoo
- Lucid Motors
- NIO
- Rivian
- Zeekr
The Global e-Corner System Market was valued at USD 305.9 million in 2025 and is estimated to grow at a CAGR of 32.7% to reach USD 5.3 billion by 2035.
The e-Corner system industry is experiencing rapid growth, largely driven by the accelerating adoption of electric vehicles worldwide. These systems are particularly suited for modern EV architectures, as they integrate propulsion, braking, steering, and suspension into compact wheel modules. This integration enables automakers to improve vehicle efficiency, reduce mechanical complexity, and maximize interior and structural space. At the same time, increasing demand for enhanced vehicle maneuverability is supporting market expansion. Advanced e-Corner technologies enable precise control of vehicle movement, including multi-directional driving capabilities, which improve navigation in constrained environments. Rising urbanization and increasing traffic congestion are further strengthening the demand for highly agile vehicles that can operate efficiently in dense city conditions. As mobility trends evolve, the e-Corner system market is emerging as a key enabler of next-generation vehicle design, offering improvements in safety, operational flexibility, and overall driving performance.
| Market Scope | |
|---|---|
| Start Year | 2025 |
| Forecast Year | 2026-2035 |
| Start Value | $305.9 Million |
| Forecast Value | $5.3 Billion |
| CAGR | 32.7% |
The electric segment held an 87.9% share in 2025 and is projected to reach USD 4.8 billion by 2035. The transition toward electric mobility, supported by global emission reduction goals, is significantly contributing to segment growth. E-Corner systems play a crucial role in enhancing propulsion control, handling precision, and overall vehicle performance in electric vehicles. Increasing adoption of battery electric vehicles is further driving demand, as automakers seek advanced solutions to improve efficiency and meet regulatory standards.
The quad-motor segment held a 76% share in 2025. These configurations enable precise torque control at each wheel, resulting in improved handling, stability, and power distribution. Enhanced torque vectoring capabilities allow vehicles to adapt effectively to varying road conditions, improving traction and driving performance. This level of control is particularly valuable for applications requiring high stability and responsiveness, supporting broader adoption of e-Corner technologies.
Asia Pacific e-Corner System Market held a 38.2% share in 2025, with China maintaining a dominant position within the region. Rapid urban development and increasing demand for highly maneuverable vehicles are driving growth across key markets. Independent wheel control offered by e-Corner systems enables advanced movement capabilities, enhancing mobility in congested environments. Strong growth in electric vehicle production, supported by favorable policies and increasing technological adoption, is further accelerating the integration of e-Corner systems across passenger and emerging mobility platforms.
Key companies operating in the Global e-Corner System Market include Continental, Hyundai, ZF Friedrichshafen, Schaeffler, REE Automotive, Protean Electric, Elaphe Propulsion Technologies, BorgWarner Drive Systems, and Dana. Companies in the e-Corner System Market are strengthening their market presence through continuous innovation and strategic collaboration. They are investing heavily in research and development to enhance system integration, improve efficiency, and optimize vehicle performance. Strategic partnerships with automakers and technology providers are enabling faster deployment and commercialization of advanced solutions. Firms are also focusing on developing scalable and modular architectures to support a wide range of vehicle platforms. In addition, companies are expanding production capabilities and improving supply chain efficiency to meet rising demand. Emphasis on advanced software integration, precision control systems, and energy-efficient designs is helping companies maintain a competitive edge in the evolving mobility landscape.
Table of Contents
Chapter 1 Methodology & Scope
- 1.1 Research design
- 1.2 Research approach
- 1.2.1 Quality Commitments
- 1.3 GMI AI policy & data integrity commitment
- 1.3.1 Research Trail & Confidence Scoring
- 1.3.2 Research Trail Components
- 1.4 Scoring Components
- 1.4.1 Data Collection
- 1.5 Partial list of primary sources
- 1.5.1 Data mining sources
- 1.6 Paid sources
- 1.6.1 Base estimates and calculations
- 1.7 Base year calculation for any one approach
- 1.8 Forecast model
- 1.9 Research transparency addendum
Chapter 2 Executive Summary
- 2.1 Industry 360° synopsis, 2022 - 2035
- 2.2 Key market trends
- 2.2.1 Motor Configuration
- 2.2.2 Vehicle
- 2.2.3 Propulsion
- 2.2.4 Technology
- 2.2.5 Vehicle Configuration
- 2.3 TAM Analysis, 2026-2035
- 2.4 CXO perspectives: Strategic imperatives
Chapter 3 Industry Insights
- 3.1 Industry ecosystem analysis
- 3.1.1 Supplier landscape
- 3.1.2 Profit margin
- 3.1.3 Cost structure
- 3.1.4 Value addition at each stage
- 3.1.5 Factor affecting the value chain
- 3.1.6 Disruptions
- 3.2 Industry impact forces
- 3.2.1 Growth drivers
- 3.2.1.1 Growing demand for enhanced vehicle maneuverability and advanced parking solutions
- 3.2.1.2 Rising adoption of autonomous and electric vehicles integrating steer-by-wire and brake-by-wire technologies
- 3.2.1.3 Increasing focus on vehicle safety, stability, and dynamic control
- 3.2.1.4 Advancements in in-wheel motor technology and modular e-corner architectures
- 3.2.2 Industry pitfalls and challenges
- 3.2.2.1 High development and integration costs
- 3.2.2.2 Regulatory and standardization challenges
- 3.2.3 Market opportunities
- 3.2.3.1 Expansion of Electric Vehicle (EV) Adoption Worldwide
- 3.2.3.2 Growing Demand for Autonomous and Smart Mobility Solutions
- 3.2.3.3 Increasing Integration of In-Wheel Motor and Modular Chassis Technologies
- 3.2.3.4 Rising Investments in Advanced Urban Mobility and Commercial EV Platforms
- 3.2.1 Growth drivers
- 3.3 Regulatory landscape
- 3.3.1 North America
- 3.3.1.1 United States: Federal Motor Vehicle Safety Standards (FMVSS)
- 3.3.1.2 Canada: Canadian Motor Vehicle Safety Standards (CMVSS)
- 3.3.2 Europe
- 3.3.2.1 Germany: UNECE Vehicle Regulations / EU Whole Vehicle Type Approval (WVTA)
- 3.3.2.2 France: EU Whole Vehicle Type Approval (WVTA) / UNECE Vehicle Regulations
- 3.3.2.3 United Kingdom: UK Whole Vehicle Type Approval (UKWVTA)
- 3.3.3 Asia Pacific
- 3.3.3.1 China: GB Automotive Safety Standards (Guobiao Standards)
- 3.3.3.2 India: Central Motor Vehicle Rules (CMVR) / Automotive Industry Standards (AIS)
- 3.3.3.3 Japan: Road Vehicle Safety Standards (MLIT)
- 3.3.4 Latin America
- 3.3.4.1 Brazil: CONTRAN Vehicle Safety Regulations
- 3.3.5 MEA
- 3.3.5.1 South Africa: National Road Traffic Act / South African National Standards (SANS)
- 3.3.1 North America
- 3.4 Porter's analysis
- 3.5 PESTEL analysis
- 3.6 Technology and innovation landscape
- 3.6.1 Current technological trends
- 3.6.2 Emerging technologies
- 3.7 Pricing Analysis (Driven by Primary Research)
- 3.7.1 Historical Price Trend Analysis
- 3.7.2 Pricing Strategy by Player Type
- 3.8 Trade statistics (Driven by Paid Database)
- 3.8.1 Production hubs
- 3.8.2 Consumption hubs
- 3.8.3 Export and import
- 3.9 Cost breakdown analysis
- 3.10 Patent analysis (Driven by Primary Research)
- 3.11 Sustainability and environmental aspects
- 3.11.1 Sustainable practices
- 3.11.2 Waste reduction strategies
- 3.11.3 Energy efficiency in production
- 3.11.4 Eco-friendly initiatives
- 3.11.5 Carbon footprint considerations
- 3.12 Risk & Resilience Analysis
- 3.12.1 Technology Risk Assessment
- 3.12.2 Operational Risk Management
- 3.12.3 Security Risk Framework
- 3.13 Case Studies
- 3.14 Impact of AI & generative AI on the market
- 3.14.1 AI-driven disruption of existing business models
- 3.14.2 Automated System Design & Workflow Optimization
- 3.14.3 Automated System Design & Layout Optimization
- 3.14.3.1 GenAI Use Cases & Adoption Roadmap
- 3.14.3.2 Automated System Configuration & Optimization
- 3.14.3.3 Real-Time Monitoring & Virtual Assistance
- 3.14.3.4 Predictive Maintenance & Performance Reporting
- 3.14.4 Risks, limitations & regulatory considerations
- 3.15 Forecast assumptions & scenario analysis (Driven by Primary Research)
- 3.15.1 Base Case- Key Macro & Industry Variables Driving CAGR
- 3.15.2 Optimistic Scenarios- Favourable macro and industry tailwinds
- 3.15.3 Pessimistic Scenario - Macroeconomic slowdown or industry headwinds
Chapter 4 Competitive Landscape, 2025
- 4.1 Introduction
- 4.2 Company market share analysis
- 4.2.1 North America
- 4.2.2 Europe
- 4.2.3 Asia-Pacific
- 4.2.4 Latin America
- 4.2.5 Middle East & Africa
- 4.3 Competitive analysis of major market players
- 4.4 Competitive positioning matrix
- 4.5 Company Tier Benchmarking
- 4.5.1 Tier Classification Criteria & Qualifying Thresholds
- 4.5.2 Tier Positioning Matrix by Revenue, Geography & Innovation
- 4.6 Key developments
- 4.6.1 Mergers & acquisitions
- 4.6.2 Partnerships & collaborations
- 4.6.3 New product launches
- 4.6.4 Expansion plans and funding
Chapter 5 Market Estimates & Forecast, By Motor Configuration, 2022 - 2035 ($Bn, Units)
- 5.1 Key trends
- 5.2 Tri-motor configuration
- 5.3 Quad-motor configuration
Chapter 6 Market Estimates & Forecast, By Vehicle, 2022 - 2035 ($Bn, Units)
- 6.1 Key trends
- 6.2 Passenger cars
- 6.2.1 Sedans
- 6.2.2 Hatchbacks
- 6.2.3 SUVs
- 6.3 Commercial vehicles
- 6.3.1 Light Commercial Vehicles (LCVs)
- 6.3.2 Medium Commercial Vehicles (MCVs)
- 6.3.3 Heavy Commercial Vehicles (HCVs)
Chapter 7 Market Estimates & Forecast, By Propulsion, 2022 - 2035 ($Bn, Units)
- 7.1 Key trends
- 7.2 ICE
- 7.3 Electric
- 7.3.1 BEV
- 7.3.2 HEV
- 7.3.3 PHEV
- 7.3.4 FCEV
Chapter 8 Market Estimates & Forecast, By Vehicle Configuration, 2022 - 2035 ($Bn, Units)
- 8.1 Key trends
- 8.2 2-Wheel Drive (2WD)
- 8.3 All-Wheel Drive (AWD)
- 8.4 4-Wheel Drive (4WD)
Chapter 9 Market Estimates & Forecast, By Technology, 2022 - 2035 ($Bn, Units)
- 9.1 Key trends
- 9.2 Hydraulic
- 9.3 Electric
- 9.4 Others
Chapter 10 Market Estimates & Forecast, By Region, 2022 - 2035 ($Bn, Units)
- 10.1 Key trends
- 10.2 North America
- 10.2.1 U.S.
- 10.2.2 Canada
- 10.3 Europe
- 10.3.1 UK
- 10.3.2 Germany
- 10.3.3 France
- 10.3.4 Italy
- 10.3.5 Spain
- 10.3.6 Russia
- 10.3.7 Nordics
- 10.4 Asia Pacific
- 10.4.1 China
- 10.4.2 India
- 10.4.3 Japan
- 10.4.4 Australia
- 10.4.5 South Korea
- 10.4.6 Southeast Asia
- 10.5 Latin America
- 10.5.1 Brazil
- 10.5.2 Mexico
- 10.5.3 Argentina
- 10.6 MEA
- 10.6.1 UAE
- 10.6.2 South Africa
- 10.6.3 Saudi Arabia
Chapter 11 Company Profiles
- 11.1 Global leaders
- 11.1.1 Aptiv
- 11.1.2 Continental
- 11.1.3 Denso
- 11.1.4 Faurecia
- 11.1.5 GKN Automotive
- 11.1.6 Hitachi
- 11.1.7 Schaeffler
- 11.1.8 Siemens
- 11.1.9 Valeo
- 11.1.10 ZF Friedrichshafen
- 11.2 Regional players
- 11.2.1 Allison Transmission
- 11.2.2 Benteler
- 11.2.3 BorgWarner Drive Systems
- 11.2.4 Dana
- 11.2.5 Elaphe Propulsion Technologies
- 11.2.6 Indigo Technologies
- 11.2.7 Meritor
- 11.2.8 NSK
- 11.2.9 Parker Hannifin
- 11.2.10 Protean Electric
- 11.3 Emerging players
- 11.3.1 Canoo
- 11.3.2 Lucid Motors
- 11.3.3 NIO
- 11.3.4 Rivian
- 11.3.5 Zeekr
 汽車轉向系統市場預測至2034年—按轉向類型、組件、驅動系統、自動化程度、應用、銷售管道和地區分類的全球分析
 汽車轉向系統市場:按轉向系統類型、組件、系統配置、應用、車輛類型和最終用戶分類-2026-2032年全球市場預測
 汽車轉向系統市場分析與預測(至2035年):類型、產品類型、技術、組件、應用、材料類型、功能、安裝方式、設備、解決方案
 汽車轉向系統市場報告:按類型、組件、車輛類型和地區分類(2026-2034 年)
 2026年全球汽車轉向系統市場報告中心拉桿及轉向拉桿市場:按類型、材質、車輛類型、銷售管道和最終用途行業分類 - 2026-2032年全球市場預測
 汽車轉向系統市場:按組件、應用、銷售管道、機制、最終用途、國家和地區分類-全球產業分析、市場規模、市場佔有率及2026年至2033年預測日本汽車轉向系統市場報告(按類型(電動輔助轉向、液壓輔助轉向、電液輔助轉向、手動轉向)、組件、車輛類型和地區分類,2026-2034年)汽車轉向角感測器市場:按感測器技術、輸出類型、安裝類型、應用、國家和地區分類的全球產業分析、市場規模、市場佔有率及2025-2032年預測
 中心和拖曳連桿市場-全球產業規模、佔有率、趨勢、機會和預測,按材料、車輛類型、類型、地區和競爭細分,2020-2030F