


 |
市場調查報告書
商品編碼
2019112
水下自行車市場商機、成長要素、產業趨勢分析及2026-2035年預測Underwater Bikes Market Opportunity, Growth Drivers, Industry Trend Analysis, and Forecast 2026 - 2035 |
||||||
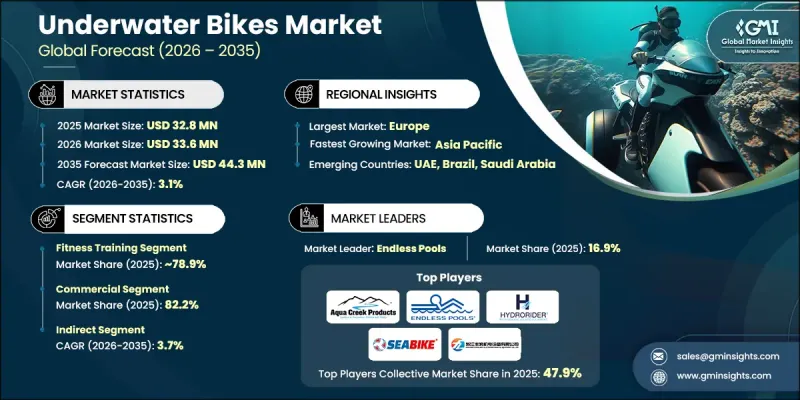
預計到 2025 年,全球水下推進器市場價值為 3,280 萬美元,並預計以 3.1% 的複合年成長率成長,到 2035 年達到 4,430 萬美元。
水下自行車運動日益普及,源自於在提供低衝擊運動的同時,也能改善心血管健康、肌肉線條和整體健康狀況。這些專為水中騎乘而設計的設備,為傳統健身器材提供了一種安全且對關節友好的替代方案,因此在健身中心、復健中心和水上健身房的應用越來越廣泛。消費者逐漸認知到水下訓練在傷後復原和低衝擊肌力訓練的價值。在健身意識不斷增強以及政府和私人舉措推廣健身計劃的推動下,水下自行車運動正逐漸成為一項主流運動。此外,製造商正在拓展線上線下銷售管道,以觸及新興市場的消費者。技術創新和高品質材料的運用,不斷提升使用者體驗和產品耐用性,進一步推動了市場滲透。
| 市場範圍 | |
|---|---|
| 開始年份 | 2025 |
| 預測期 | 2026-2035 |
| 上市時的市場規模 | 3280萬美元 |
| 預測金額 | 4430萬美元 |
| 複合年成長率 | 3.1% |
預計到2025年,健身訓練產業的銷售額將達到2,590萬美元,佔市場佔有率的78.9%。水上自行車因其水的阻力特性而備受健身愛好者和復健中心的青睞,這種特性使得在不給關節造成壓力的情況下進行有效的肌肉訓練成為可能。水上自行車尤其適合老年人和行動不便的人士,在可控的水環境中,它們能夠帶來許多好處,例如改善心血管功能、增強肌肉力量和燃燒卡路里。健康宣傳活動和健身達人的推廣也提高了人們對水上自行車的認知度,使其成為主流健康文化的一部分。
預計到2025年,商業領域將佔據82.2%的市場佔有率,並在2035年之前以3.4%的複合年成長率成長。飯店、度假村、健身中心和游泳場所正在投資水下自行車,以提供系統化的健身計劃、復健療程和休閒體驗。客流量大的場所更傾向於選擇功能先進、耐用的商用級水下自行車。將專用水下自行車引入健康計劃,透過提高客戶留存率,提升水療中心、健身房和復健中心加值服務的附加價值,從而推動了市場需求的穩定成長。
美國水下自行車市場預計到2025年將達到1,220萬美元,並在2026年至2035年間以2.6%的複合年成長率成長。該地區的成長主要得益於成熟的健康和復健計畫、消費者在健身的強勁支出,以及水下運動在心血管健康、活動能力和肌肉活化方面日益普及。支持水下運動的組織正在提供相關指南和訓練方案,間接促進了水下自行車在健身、治療和運動醫學領域的應用。
目錄
第1章:調查方法
第2章執行摘要
第3章業界考察
- 生態系分析
- 供應商情況
- 利潤率
- 成本結構
- 每個階段增加的價值
- 影響價值鏈的因素
- 中斷
- 影響產業的因素
- 促進因素
- 人們對健康和保健的日益關注推動了水中健身的流行。
- 探險旅遊和水下休閒活動的成長
- 水下自行車的設計和技術進步
- 增加豪華度假村和水岸健康設施的投資。
- 產業潛在風險與挑戰
- 海上作業中的安全問題與監理挑戰
- 來自其他水上運動和健身器材的競爭。
- 市場機遇
- 在復健和治療應用方面尚未開發的潛力
- 透過沿海旅遊業者拓展租賃模式
- 企業健康和酒店設施服務項目的需求日益成長。
- 促進因素
- 成長潛力分析
- 監理情勢
- 北美洲
- 美國消費品安全委員會(CPSC)
- 美國食品藥物管理局(FDA)
- 加拿大衛生署
- 歐洲
- 歐盟委員會(EC)
- 歐洲標準化委員會(CEN)
- 亞太地區
- 國家市場監督管理總局(SAMR)
- 印度標準局(BIS)
- 日本工業標準委員會(JISC)
- 拉丁美洲
- ANVISA
- INMETRO
- 中東和非洲
- 沙烏地阿拉伯食品藥物管理局(SFDA)
- 海灣標準化組織(GSO)
- 北美洲
- 投資與資金籌措分析
- 波特五力分析
- PESTEL 分析
- 科技與創新趨勢
- 當前技術趨勢
- 耐腐蝕材料
- 可調式阻力機制
- 緊湊便攜設計
- 新興技術
- 基於感測器的性能監測
- 動態最佳化
- 當前技術趨勢
- 價格分析(基於初步調查)
- 對過去價格趨勢的分析
- 按業務類型分類的定價策略(溢價/價值/成本加成)
- 貿易數據分析(基於付費資料庫)
- 進出口量及進口額趨勢
- 主要貿易走廊及關稅的影響
- 生產能力和生產狀況(基於初步調查)
- 按地區和主要生產商分類的設備產能
- 運轉率和擴張計劃
- 專利趨勢(基於初步調查)
- 永續性和環境影響
- 環境影響評估
- 社會影響和對社區的益處
- 公司管治與企業社會責任
- 永續金融與投資趨勢
- 人工智慧對水下摩托車市場的影響
- 利用人工智慧改造現有經營模式
- GenAI 各細分市場的應用案例與實施藍圖
- 風險、局限性和監管考量
- 行銷和品牌策略
- 產品定位與差異化
- 定價和促銷策略
- 分銷和通路策略
- 品牌合作與聯合品牌推廣活動
- 旅遊和休閒產業的綜效
- 融入酒店和度假村
- 健康水療計劃
- 探險和休閒旅遊
- 以活動為基礎的行銷和健身旅遊
- 案例研究
- 預測假設和情境分析(基於初步研究)
- 基本案例-驅動複合年成長率的關鍵宏觀經濟與產業變量
- 樂觀情境-有利的宏觀經濟和產業利好因素
- 悲觀情景-宏觀經濟放緩或產業逆風
第4章 競爭情勢
- 介紹
- 企業市佔率分析
- 北美洲
- 歐洲
- 亞太地區
- 拉丁美洲
- 中東和非洲(MEA)
- 主要市場公司的競爭分析
- 競爭定位矩陣
- 主要進展
- 併購
- 夥伴關係與合作
- 新產品發布
- 業務拓展計劃及資金籌措
第5章 市場估計與預測:依應用領域分類,2022-2035年
- 休閒
- 健身訓練
- 調查
第6章 市場估算與預測:依最終用途分類,2022-2035年
- 對於個人
- 商業的
- 健身房/健身中心
- 飯店、度假村、水療中心
- 潛水業者和海上旅遊公司
- 復健中心
第7章 市場估價與預測:依通路分類,2022-2035年
- 直銷
- 間接銷售
- 授權經銷商
- 獨立健身器材專賣店
- 第三方電子商務平台
第8章 市場估計與預測:依地區分類,2022-2035年
- 北美洲
- 美國
- 加拿大
- 歐洲
- 德國
- 英國
- 法國
- 義大利
- 西班牙
- 俄羅斯
- 荷蘭
- 北歐國家
- 亞太地區
- 中國
- 印度
- 日本
- 韓國
- 澳洲
- 新加坡
- 印尼
- 泰國
- 拉丁美洲
- 巴西
- 墨西哥
- 阿根廷
- 哥倫比亞
- 中東和非洲(MEA)
- 南非
- 沙烏地阿拉伯
- 阿拉伯聯合大公國
第9章:公司簡介
- 世界公司
- Waterflex
- Hydrorider
- SEABIKE
- POOLBIKING
- Aqua Body Strong
- Hexagone Manufacture
- 本地公司
- Aqua Creek
- EWAC medical
- AquaNess
- Endless Pools
- 新興企業
- Evoke Fitness
- Zhejiang Fenglang
- AQUAMAXX
The Global Underwater Bikes Market was valued at USD 32.8 million in 2025 and is estimated to grow at a CAGR of 3.1% to reach USD 44.3 million by 2035.
The increasing popularity of underwater bikes is being driven by their ability to provide low-impact exercise while improving cardiovascular health, muscle tone, and overall wellness. These devices, designed to be pedaled underwater, are increasingly adopted in fitness centers, rehabilitation facilities, and aquatic gyms because they offer a safe, joint-friendly alternative to conventional exercise equipment. Consumers are recognizing the value of aquatic workouts for injury recovery and gentle strength training. Rising awareness of fitness, combined with government and private health initiatives promoting wellness programs, has also helped elevate underwater cycling as a mainstream activity. Additionally, manufacturers are expanding online and offline distribution channels to reach consumers in emerging markets, while technological innovations and high-quality materials enhance user experience and durability, further boosting market adoption.
| Market Scope | |
|---|---|
| Start Year | 2025 |
| Forecast Year | 2026-2035 |
| Start Value | $32.8 Million |
| Forecast Value | $44.3 Million |
| CAGR | 3.1% |
The fitness training segment generated USD 25.9 million, holding a 78.9% share in 2025. Fitness enthusiasts and rehabilitation centers prefer underwater bikes due to water resistance, which promotes muscle engagement without stressing joints. These bikes are particularly useful for seniors and individuals with mobility challenges, providing cardiovascular benefits, strength toning, and calorie burning in a controlled aquatic environment. Increased awareness through health campaigns and fitness influencers has also contributed to the rising adoption of water cycling as part of mainstream wellness culture.
The commercial segment accounted for 82.2% share in 2025 and is expected to grow at a CAGR of 3.4% through 2035. Hotels, resorts, fitness centers, and aquatic facilities invest in underwater bikes to offer structured fitness programs, rehabilitation sessions, and recreational experiences. Commercially designed bikes with advanced features and durability are preferred for high-traffic facilities. The integration of specialized bikes in wellness programs enhances customer retention and adds value to premium services in spas, gyms, and rehabilitation centers, driving consistent demand.
U.S. Underwater Bikes Market reached USD 12.2 million in 2025 and is projected to grow at a CAGR of 2.6% from 2026 to 2035. Growth in the region is driven by well-established wellness and rehabilitation programs, strong consumer spending on fitness, and the increasing popularity of aquatic exercise for heart health, mobility, and muscle engagement. Organizations supporting aquatic exercise provide guidelines and training protocols, indirectly encouraging the adoption of underwater bikes in fitness, therapy, and sports medicine settings.
Key players operating in the Global Underwater Bikes Market include Aqua Body Strong, Aqua Creek, Endless Pools, Evoke Fitness, EWAC Medical, Hydrorider, POOLBIKING, SEABIKE, Waterflex, and Zhejiang Fenglang. Companies in the Underwater Bikes Market are focusing on expanding distribution channels and strengthening e-commerce presence to reach emerging and untapped markets. They are investing in R&D to enhance bike durability, ergonomics, and water resistance, ensuring a premium user experience. Strategic partnerships with fitness centers, aquatic gyms, and rehabilitation facilities are helping firms integrate products into structured wellness programs. Brands are also emphasizing awareness campaigns, product demonstrations, and professional endorsements to build credibility and drive adoption. Additionally, companies are differentiating their offerings through innovative designs, adjustable resistance systems, and customizable features that cater to diverse age groups, fitness levels, and rehabilitation requirements, strengthening their foothold in the competitive underwater bikes industry.
Table of Contents
Chapter 1 Methodology
- 1.1 Research approach
- 1.2 Quality commitments
- 1.2.1 GMI AI policy & data integrity commitment
- 1.3 Research trail & confidence scoring
- 1.3.1 Research trail components
- 1.3.2 Scoring components
- 1.4 Data collection
- 1.4.1 Partial list of primary sources
- 1.5 Data mining sources
- 1.5.1 Paid sources
- 1.6 Base estimates and calculations
- 1.6.1 Base year calculation
- 1.7 Forecast model
- 1.8 Research transparency addendum
Chapter 2 Executive Summary
- 2.1 Industry 360° synopsis
- 2.2 Key market trends
- 2.2.1 Regional
- 2.2.2 Application
- 2.2.3 End Use
- 2.2.4 Distribution Channel
- 2.3 TAM analysis, 2026-2035
- 2.4 CXO perspectives: Strategic imperatives
Chapter 3 Industry Insights
- 3.1 Industry ecosystem analysis
- 3.1.1 Supplier landscape
- 3.1.2 Profit margin
- 3.1.3 Cost structure
- 3.1.4 Value addition at each stage
- 3.1.5 Factor affecting the value chain
- 3.1.6 Disruptions
- 3.2 Industry impact forces
- 3.2.1 Growth drivers
- 3.2.1.1 Rising health & wellness consciousness driving aquatic fitness adoption
- 3.2.1.2 Growth in adventure tourism & underwater recreation activities
- 3.2.1.3 Advancements in underwater bike designs and technology
- 3.2.1.4 Increasing investment in luxury resorts & aquatic wellness facilities
- 3.2.2 Industry pitfalls and challenges
- 3.2.2.1 Safety concerns & regulatory challenges in open-water applications
- 3.2.2.2 Competition from alternative water sports & fitness equipment
- 3.2.3 Market opportunities
- 3.2.3.1 Untapped potential in rehabilitation & therapeutic applications
- 3.2.3.2 Expansion of rental models through coastal tourism operators
- 3.2.3.3 Growing demand in corporate wellness & hotel amenity programs
- 3.2.1 Growth drivers
- 3.3 Growth potential analysis
- 3.4 Regulatory landscape
- 3.4.1 North America
- 3.4.1.1 U.S. Consumer Product Safety Commission (CPSC)
- 3.4.1.2 Food and Drug Administration (FDA)
- 3.4.1.3 Health Canada
- 3.4.2 Europe
- 3.4.2.1 European Commission (EC)
- 3.4.2.2 European Committee for Standardization (CEN)
- 3.4.3 Asia Pacific
- 3.4.3.1 State Administration for Market Regulation (SAMR)
- 3.4.3.2 Bureau of Indian Standards (BIS)
- 3.4.3.3 Japanese Industrial Standards Committee (JISC)
- 3.4.4 Latin America
- 3.4.4.1 ANVISA
- 3.4.4.2 INMETRO
- 3.4.5 Middle East & Africa
- 3.4.5.1 Saudi Food and Drug Authority (SFDA)
- 3.4.5.2 Gulf Standardization Organization (GSO)
- 3.4.1 North America
- 3.5 Investment & funding analysis
- 3.6 Porter's analysis
- 3.7 PESTEL analysis
- 3.8 Technology and innovation landscape
- 3.8.1 Current technological trends
- 3.8.1.1 Corrosion-Resistant Materials
- 3.8.1.2 Adjustable Resistance Mechanisms
- 3.8.1.3 Compact & Portable Designs
- 3.8.2 Emerging technologies
- 3.8.2.1 Sensor-Based Performance Monitoring
- 3.8.2.2 Hydrodynamic Optimization
- 3.8.1 Current technological trends
- 3.9 Pricing analysis (Driven by Primary Research)
- 3.9.1 Historical price trend analysis
- 3.9.2 Pricing strategy by player type (Premium / Value / Cost-plus)
- 3.10 Trade data analysis (Driven by Paid Database)
- 3.10.1 Import/export volume & value trends
- 3.10.2 Key trade corridors & tariff impact
- 3.11 Capacity & Production Landscape (Driven by Primary Research)
- 3.11.1 Installed Capacity by Region & Key Producer
- 3.11.2 Capacity Utilization Rates & Expansion Pipelines
- 3.12 Patent landscape (Driven by Primary Research)
- 3.13 Sustainability and environmental impact
- 3.13.1 Environmental impact assessment
- 3.13.2 Social impact & community benefits
- 3.13.3 Governance & corporate responsibility
- 3.13.4 Sustainable finance & investment trends
- 3.14 Impact of AI on the underwater bikes market
- 3.14.1 AI-driven disruption of existing business models
- 3.14.2 GenAI use cases & adoption roadmap by segment
- 3.14.3 Risks, limitations & regulatory considerations
- 3.15 Marketing & branding strategies
- 3.15.1 Product positioning & differentiation
- 3.15.2 Pricing & promotional strategies
- 3.15.3 Distribution & channel strategies
- 3.15.4 Brand collaboration & co-branding initiatives
- 3.16 Tourism & leisure industry synergies
- 3.16.1 Integration in hotels & resorts
- 3.16.2 Wellness & spa programs
- 3.16.3 Adventure & recreational tourism
- 3.16.4 Event-based marketing & fitness tourism
- 3.17 Case studies
- 3.18 Forecast assumptions & scenario analysis (Driven by primary research)
- 3.18.1 Base Case - key macro & industry variables driving CAGR
- 3.18.2 Optimistic Scenarios - Favorable macro and industry tailwinds
- 3.18.3 Pessimistic Scenario - Macroeconomic slowdown or industry headwinds
Chapter 4 Competitive Landscape, 2025
- 4.1 Introduction
- 4.2 Company market share analysis
- 4.2.1 North America
- 4.2.2 Europe
- 4.2.3 Asia Pacific
- 4.2.4 LATAM
- 4.2.5 MEA
- 4.3 Competitive analysis of major market players
- 4.4 Competitive positioning matrix
- 4.5 Key developments
- 4.5.1 Mergers & acquisitions
- 4.5.2 Partnerships & collaborations
- 4.5.3 New product launches
- 4.5.4 Expansion plans and funding
Chapter 5 Market Estimates & Forecast, By Application, 2022 - 2035 ($Mn, Units)
- 5.1 Key trends
- 5.2 Recreational
- 5.3 Fitness Training
- 5.4 Research
Chapter 6 Market Estimates & Forecast, By End Use, 2022 - 2035 ($Mn, Units)
- 6.1 Key trends
- 6.2 Personal
- 6.3 Commercial
- 6.3.1 Gyms & fitness centers
- 6.3.2 Hotels, resorts & spas
- 6.3.3 Dive operators & marine tour companies
- 6.3.4 Rehabilitation centers
Chapter 7 Market Estimates & Forecast, By Distribution Channel, 2022 - 2035 ($Mn, Units)
- 7.1 Key trends
- 7.2 Direct
- 7.3 Indirect
- 7.3.1 Authorized distributors
- 7.3.2 Independent fitness equipment stores
- 7.3.3 Third-party e-commerce marketplaces
Chapter 8 Market Estimates & Forecast, By Region, 2022 - 2035 ($Mn, Units)
- 8.1 Key trends
- 8.2 North America
- 8.2.1 US
- 8.2.2 Canada
- 8.3 Europe
- 8.3.1 Germany
- 8.3.2 UK
- 8.3.3 France
- 8.3.4 Italy
- 8.3.5 Spain
- 8.3.6 Russia
- 8.3.7 Netherlands
- 8.3.8 Nordics
- 8.4 Asia Pacific
- 8.4.1 China
- 8.4.2 India
- 8.4.3 Japan
- 8.4.4 South Korea
- 8.4.5 Australia
- 8.4.6 Singapore
- 8.4.7 Indonesia
- 8.4.8 Thailand
- 8.5 Latin America
- 8.5.1 Brazil
- 8.5.2 Mexico
- 8.5.3 Argentina
- 8.5.4 Colombia
- 8.6 MEA
- 8.6.1 South Africa
- 8.6.2 Saudi Arabia
- 8.6.3 UAE
Chapter 9 Company Profiles
- 9.1 Global players
- 9.1.1 Waterflex
- 9.1.2 Hydrorider
- 9.1.3 SEABIKE
- 9.1.4 POOLBIKING
- 9.1.5 Aqua Body Strong
- 9.1.6 Hexagone Manufacture
- 9.2 Regional players
- 9.2.1 Aqua Creek
- 9.2.2 EWAC medical
- 9.2.3 AquaNess
- 9.2.4 Endless Pools
- 9.3 Emerging players
- 9.3.1 Evoke Fitness
- 9.3.2 Zhejiang Fenglang
- 9.3.3 AQUAMAXX
 碳纖維自行車市場:按類型、纖維類型、客戶和銷售管道分類-2026-2032年全球市場預測
 越野摩托車裝備市場規模、佔有率和成長分析:按產品類型、最終用戶、通路、認證和地區分類-2026-2033年產業預測巡航自行車市場:2026-2032年全球市場預測(依推進系統、引擎排氣量、應用及銷售管道)平衡車市場:按產品類型、年齡層、材料和銷售管道分類的全球市場預測,2026-2032年
 自行車市場:按類型、設計、技術、銷售管道、最終用戶和地區分類
 2026年全球平衡車市場報告
 碳纖維自行車輪組市場機會、成長要素、產業趨勢分析及2026-2035年預測
 自行車市場:市場規模、佔有率和趨勢分析(按類型、產品、價格範圍、最終用戶、應用和地區分類),細分市場預測(2026-2033 年)
 巡航摩托車市場 - 全球產業規模、佔有率、趨勢、機會及預測(按引擎排氣量、價格範圍、應用、地區和競爭格局分類,2021-2031年)
 巡航自行車市場規模、佔有率和成長分析(按引擎排氣量、應用、價格範圍和地區分類)—產業預測(2026-2033 年)