


 |
市場調查報告書
商品編碼
2019069
2026-2035年海洋海圖儀市場機會、成長要素、產業趨勢分析及預測Marine Chartplotter Market Opportunity, Growth Drivers, Industry Trend Analysis, and Forecast 2026 - 2035 |
||||||
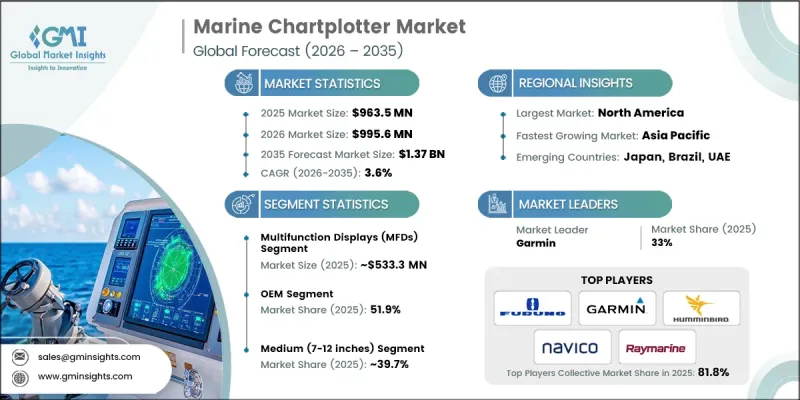
預計到 2025 年,全球海圖儀市場價值將達到 9.635 億美元,年複合成長率為 3.6%,到 2035 年將達到 13.7 億美元。
全球海圖儀市場深受活性化推動了對船上導航設備的需求。這些系統在支持精確定位和航線最佳化方面發揮著至關重要的作用,對商用和休閒船舶都必不可少。對先進顯示技術和增強連接性的投資不斷增加,正在推動海圖儀的演進。此外,法律規範鼓勵採用電子導航系統,支援持續升級和數位工具的長期部署。隨著海上作業越來越依賴數據驅動的導航,海圖儀正被整合到更廣泛的船上系統中,在提高作業效率和安全性的同時,也為使用者帶來無縫的導航體驗。
| 市場範圍 | |
|---|---|
| 開始年份 | 2025 |
| 預測期 | 2026-2035 |
| 初始市場規模 | 9.635億美元 |
| 預測金額 | 13.7億美元 |
| 複合年成長率 | 3.6% |
海洋海圖儀市場也在不斷發展,持續的技術創新提升了易用性和系統整合。最新的設備配備了高解析度介面、無線連接功能,並與船上通訊網路相容。這些系統能夠實現無縫資料交換,並支援遠端更新和與多個船上資料來源整合等高級功能。商業營運商依靠這些技術來保持導航精度並滿足監管要求,而休閒用戶則越來越青睞直覺的介面和即時資訊。集導航和其他功能於一體的多功能系統的日益普及,也進一步推動了市場擴張。
到2025年,多功能顯示器市佔率將達到55.3%,市場規模將達5.333億美元。推動這一細分市場成長的主要因素是市場對整合導航解決方案的需求不斷成長,這類解決方案能夠將多種功能整合到單一介面中。這些系統透過將各種操作資訊整合到統一的顯示器上,提高了效率,減少了對獨立儀器的需求。此外,與船上通訊網路和整合系統結構的兼容性也進一步加速了其在現代船舶上的應用。
預計到2025年,7至12吋的中型顯示器將佔據39.7%的市場佔有率,並在2026年至2035年間以4.5%的複合年成長率保持最高增速。這些設備因其顯示清晰度和空間利用率的平衡而廣受歡迎。它們提供充足的螢幕面積,便於清晰地顯示數據,同時保持緊湊的尺寸,適用於標準控制設定。同時顯示多個資料視圖的功能增強了易用性,使其成為各種船舶應用的理想選擇。
美國海圖儀市場預計到2025年將達到2.694億美元,並在2035年之前以3.9%的複合年成長率成長。活躍的海上作業和對導航技術的持續投資是推動美國市場成長的主要因素。支援數位導航系統的法規結構正在促進先進海圖儀解決方案的普及。持續致力於提高海上安全和營運效率的努力也促進了市場需求的成長。數位導航工具與海上作業的整合正在推動全部區域海圖儀市場的成長。
目錄
第1章:調查方法
第2章執行摘要
第3章業界考察
- 生態系分析
- 供應商情況
- 利潤率分析
- 成本結構
- 每個階段增加的價值
- 影響價值鏈的因素
- 中斷
- 影響產業的因素
- 促進因素
- 車輛車隊快速電氣化並向電動車/混合動力車過渡
- 現代汽車中電子設備的日益普及(ADAS、資訊娛樂系統、連網功能)
- 區域架構和智慧配電解決方案的實施
- 嚴格的排放法規正在推動高壓系統的整合。
- 消費者對先進安全性和舒適性功能的需求
- 產業潛在風險與挑戰
- 先進配電模組高成本
- 多電壓系統設計與整合的複雜性
- 半導體供應鏈中斷和零件短缺
- 緊湊型汽車內裝溫度控管面臨的挑戰
- 市場機遇
- 48V輕混系統在乘用車中的普及
- 為售後市場實施智慧PDM解決方案
- 新興市場汽車產量成長
- 與V2G(車輛到電網)基礎設施的整合
- 開發模組化、可擴充的PDM平台
- 促進因素
- 成長潛力分析
- 監理情勢
- 北美洲
- 美國環保署(EPA)溫室氣體法規第三階段與CAFE標準
- 加拿大—基於排放的法規結構
- 歐洲
- 德國—歐7排放氣體標準
- 英國-脫歐後的車輛類型認證
- 法國——脫碳藍圖
- 義大利-遵守低排放區規定
- 亞太地區
- 中國 - 中國 VI-b 和新興中國 VII 標準
- 印度BS-VI第二階段和Bharat第七階段過渡
- 日本 - 燃油效率標準(2030 年目標)
- 澳洲 - 燃油品質和 ADR 79/05 標準
- 拉丁美洲
- 墨西哥-NOM-194-SE-2021 和美墨加協定原產地規則
- 阿根廷-第24.449號法律及環境修正案
- 中東和非洲(MEA)
- 南非 - 道路交通法(1996 年)
- 沙烏地阿拉伯—2030願景的交通運輸法律與交通運輸舉措
- 北美洲
- 波特五力分析
- PESTEL 分析
- 科技與創新趨勢
- 當前技術趨勢
- 新興技術
- 專利趨勢(基於初步調查)
- 價格分析(基於初步調查)
- 對過去價格趨勢的分析
- 按業務類型分類的定價策略(溢價/價值/成本加成)
- 總擁有成本 (TCO) 分析
- 貿易數據分析(基於付費資料庫)
- 進出口量及進口額趨勢
- 主要貿易走廊和關稅的影響
- 使用案例和成功案例
- 人工智慧和生成式人工智慧對市場的影響
- 利用人工智慧改造現有經營模式
- GenAI 各細分市場的應用案例與部署藍圖
- 風險、局限性和監管考量
- 生產能力和生產趨勢(基於初步調查)
- 按地區和主要生產商分類的設備產能
- 運轉率和擴張計劃
- 永續性和環境方面
- 永續計劃
- 減少廢棄物策略
- 生產中的能源效率
- 具有環保意識的舉措
- 關於碳足跡的考量
- 預測假設和情境分析(基於初步研究)
- 基本案例-驅動複合年成長率的關鍵宏觀經濟與產業變量
- 樂觀情境-宏觀經濟與產業的順風
- 悲觀情景-宏觀經濟放緩或產業逆風
第4章 競爭情勢
- 介紹
- 企業市佔率分析
- 北美洲
- 歐洲
- 亞太地區
- 拉丁美洲
- 中東和非洲
- 主要市場公司的競爭分析
- 競爭定位矩陣
- 企業級分層基準測試
- 層級分類標準與選擇標準
- 按銷售額、地區和創新能力分類的層級定位矩陣。
- 主要進展
- 併購
- 夥伴關係和聯盟
- 新產品發布
- 業務拓展計劃及資金籌措
第5章 市場估計與預測:依組件分類,2022-2035年
- 電源模組
- 保險絲和斷路器
- 連接器和端子
- 繼電器
- 穩壓器
- 其他
第6章 市場估算與預測:依模組分類,2022-2035年
- 低電壓
- 中壓
- 高壓
第7章 市場估價與預測:依車輛類型分類,2022-2035年
- 搭乘用車
- 掀背車
- 轎車
- SUV
- 商用車輛
- 輕型商用車(LCV)
- 中型商用車(MCV)
- 重型商用車(HCV)
第8章 市場估算與預測:依銷售管道分類,2022-2035年
- OEM
- 售後市場
第9章 市場估計與預測:依應用領域分類,2022-2035年
- 照明系統
- 資訊娛樂系統
- 暖通空調系統
- 安全和駕駛輔助系統
- 動力傳動系統系統
- 電池管理系統
- 其他
第10章 市場估價與預測:依地區分類,2022-2035年
- 北美洲
- 美國
- 加拿大
- 歐洲
- 德國
- 英國
- 法國
- 義大利
- 西班牙
- 俄羅斯
- 荷蘭
- 瑞典
- 丹麥
- 波蘭
- 亞太地區
- 中國
- 印度
- 日本
- 澳洲
- 韓國
- 新加坡
- 泰國
- 印尼
- 越南
- 拉丁美洲
- 巴西
- 墨西哥
- 阿根廷
- 哥倫比亞
- 中東和非洲(MEA)
- 南非
- 沙烏地阿拉伯
- 阿拉伯聯合大公國
- 以色列
第11章:公司簡介
- 世界公司
- Aptiv
- Continental
- Denso
- Eaton
- Hitachi Astemo
- Lear
- Mitsubishi Electric
- Robert Bosch
- TE Connectivity
- Valeo
- 本地公司
- DRAXLMAIER
- Furukawa Electric
- Leoni
- Panasonic Automotive Systems
- Sumitomo Electric Industries
- Yazaki
- 新興企業
- Infineon Technologies
- NXP Semiconductors
- onsemi(ON Semiconductor)
- STMicroelectronics
The Global Marine Chartplotter Market was valued at USD 963.5 million in 2025 and is estimated to grow at a CAGR of 3.6% to reach USD 1.37 billion by 2035.
The global marine chartplotter market is closely influenced by trends in vessel production, as increased shipbuilding activity drives demand for onboard navigation equipment. These systems play a critical role in supporting accurate positioning and route optimization, making them indispensable across both commercial and recreational marine applications. Growing investments in advanced display technologies and enhanced connectivity are shaping the evolution of chartplotters. In addition, regulatory frameworks are encouraging the adoption of electronic navigation systems, supporting consistent upgrades and long-term deployment of digital tools. As maritime operations become more reliant on data-driven navigation, chartplotters are increasingly integrated into broader onboard systems, improving operational efficiency and safety while supporting seamless navigation experiences.
| Market Scope | |
|---|---|
| Start Year | 2025 |
| Forecast Year | 2026-2035 |
| Start Value | $963.5 Million |
| Forecast Value | $1.37 Billion |
| CAGR | 3.6% |
The marine chartplotter market is also advancing through continuous technological improvements that enhance usability and system integration. Modern devices feature high-resolution interfaces, wireless connectivity, and compatibility with onboard communication networks. These systems enable seamless data exchange and support advanced functionalities, including remote updates and integration with multiple onboard data sources. Commercial operators rely on these technologies to maintain navigation accuracy and meet regulatory requirements, while recreational users are increasingly drawn to intuitive interfaces and real-time information. The growing popularity of multifunction systems that combine navigation with additional capabilities is further contributing to market expansion.
In 2025, the multifunction displays segment accounted for 55.3% share, generating USD 533.3 million. This segment leads the market due to the increasing preference for integrated navigation solutions that consolidate multiple functions into a single interface. These systems combine various operational inputs into a unified display, reducing the need for separate instruments and improving efficiency. Their compatibility with onboard communication networks and integrated system architectures has further strengthened their adoption across modern vessels.
The medium-sized segment, ranging from 7 to 12 inches, held a 39.7% share in 2025 and is expected to grow at the fastest CAGR of 4.5% between 2026 and 2035. These devices are widely preferred due to their balanced combination of display clarity and space efficiency. They provide sufficient screen area for clear data visualization while maintaining compact dimensions suitable for standard control setups. Their ability to support multiple data views simultaneously enhances usability, making them a practical choice for a wide range of marine applications.
United States Marine Chartplotter Market reached USD 269.4 million in 2025 and is expected to grow at a CAGR of 3.9% through 2035. The country represents a key market driven by strong maritime activity and continuous investment in navigation technologies. Regulatory frameworks supporting digital navigation systems are encouraging widespread adoption of advanced chartplotting solutions. Ongoing initiatives focused on improving maritime safety and operational efficiency are also contributing to increased demand. The integration of digital navigation tools into maritime operations is reinforcing the growth of the marine chartplotter market across the region.
Key companies operating in the Global Marine Chartplotter Market include Furuno Electric, Garmin, Humminbird, Japan Radio, Koden Electronics, Navico, Raymarine, Samyung, SI-TEX Marine, and Standard Horizon (Yaesu). Companies in the Marine Chartplotter Market are strengthening their competitive position through innovation, product integration, and strategic expansion. They are investing in advanced display technologies, enhanced connectivity, and software-driven navigation features to improve user experience and operational efficiency. Partnerships with vessel manufacturers and marine system integrators are enabling deeper integration of chartplotters into onboard systems. Companies are also focusing on expanding their global presence through distribution networks and localized support services. Additionally, continuous upgrades in user interface design, real-time data processing, and compatibility with evolving marine communication standards help companies differentiate their offerings and maintain a strong foothold in a competitive market.
Table of Contents
Chapter 1 Methodology
- 1.1 Research approach
- 1.2 Quality commitments
- 1.3 Research trail and confidence scoring
- 1.3.1 Research trail components
- 1.3.2 Scoring components
- 1.4 Data collection
- 1.4.1 Partial list of primary sources
- 1.5 Data mining sources
- 1.5.1 Paid sources
- 1.6 Best estimates and calculations
- 1.6.1 Base year calculation for any one approach
- 1.7 Forecast model
- 1.8 Research transparency addendum
Chapter 2 Executive Summary
- 2.1 Industry 360° synopsis, 2022 - 2035
- 2.2 Key market trends
- 2.2.1 Regional
- 2.2.2 Component
- 2.2.3 Module
- 2.2.4 Vehicle
- 2.2.5 Sales Channel
- 2.2.6 Application
- 2.3 TAM Analysis, 2026-2035
- 2.4 CXO perspectives: Strategic imperatives
Chapter 3 Industry Insights
- 3.1 Industry ecosystem analysis
- 3.1.1 Supplier landscape
- 3.1.2 Profit margin analysis
- 3.1.3 Cost structure
- 3.1.4 Value addition at each stage
- 3.1.5 Factor affecting the value chain
- 3.1.6 Disruptions
- 3.2 Industry impact forces
- 3.2.1 Growth drivers
- 3.2.1.1 Rapid electrification of vehicle fleets and transition to EVs/HEVs
- 3.2.1.2 Increasing electronic content in modern vehicles (ADAS, infotainment, connectivity)
- 3.2.1.3 Adoption of zone architecture and smart power distribution solutions
- 3.2.1.4 Stringent emission regulations driving high-voltage system integration
- 3.2.1.5 Consumer demand for advanced safety and comfort features
- 3.2.2 Industry pitfalls and challenges
- 3.2.2.1 High cost of advanced power distribution modules
- 3.2.2.2 Complexity in design & integration of multi-voltage systems
- 3.2.2.3 Semiconductor supply chain disruptions & component shortages
- 3.2.2.4 Thermal management challenges in compact vehicle spaces
- 3.2.3 Market opportunities
- 3.2.3.1 Expansion of 48V mild hybrid systems in passenger vehicles
- 3.2.3.2 Retrofitting aftermarket smart PDM solutions
- 3.2.3.3 Emerging markets automotive production growth
- 3.2.3.4 Integration with vehicle-to-grid (V2G) infrastructure
- 3.2.3.5 Development of modular & scalable PDM platforms
- 3.2.1 Growth drivers
- 3.3 Growth potential analysis
- 3.4 Regulatory landscape
- 3.4.1 North America
- 3.4.1.1 US- EPA GHG phase 3 & CAFE standards
- 3.4.1.2 Canada - Emissions-based regulatory framework
- 3.4.2 Europe
- 3.4.2.1 Germany- Euro 7 Emission Standards
- 3.4.2.2 UK- Post-brexit vehicle type approval
- 3.4.2.3 France- Decarbonization roadmap
- 3.4.2.4 Italy- Low-Emission zone compliance
- 3.4.3 Asia Pacific
- 3.4.3.1 China- China VI-b & Emerging China VII standards
- 3.4.3.2 India- BS-VI Stage II & bharat stage VII transition
- 3.4.3.3 Japan- Fuel efficiency standards (2030 Targets)
- 3.4.3.4 Australia- Fuel quality & ADR 79/05 standards
- 3.4.4 LATAM
- 3.4.4.1 Mexico- NOM-194-SE-2021 & USMCA rules of origin
- 3.4.4.2 Argentina- Law 24.449 & environmental amendments
- 3.4.5 MEA
- 3.4.5.1 South Africa- National road traffic act (1996)
- 3.4.5.2 Saudi Arabia- Traffic law & vision 2030 transport initiatives
- 3.4.1 North America
- 3.5 Porter's analysis
- 3.6 PESTEL analysis
- 3.7 Technology and innovation landscape
- 3.7.1 Current technological trends
- 3.7.2 Emerging technologies
- 3.8 Patent landscape (driven by primary research)
- 3.9 Pricing analysis (Driven by Primary Research)
- 3.9.1 Historical price trend analysis
- 3.9.2 Pricing strategy by player type (premium / value / cost-plus)
- 3.9.3 Total cost of ownership (TCO) analysis
- 3.10 Trade data analysis (driven by paid database)
- 3.10.1 Import/export volume & value trends
- 3.10.2 Key trade corridors & tariff impact
- 3.11 Use cases & success stories
- 3.12 Impact of AI & generative AI on the market
- 3.12.1 AI-driven disruption of existing business models
- 3.12.2 GenAI use cases & adoption roadmap by segment
- 3.12.3 Risks, limitations & regulatory considerations
- 3.13 Capacity & production landscape (driven by primary research)
- 3.13.1 Installed capacity by region & key producer
- 3.13.2 Capacity utilization rates & expansion pipelines
- 3.14 Sustainability and environmental aspects
- 3.14.1 Sustainable practices
- 3.14.2 Waste reduction strategies
- 3.14.3 Energy efficiency in production
- 3.14.4 Eco-friendly Initiatives
- 3.14.5 Carbon footprint considerations
- 3.15 Forecast assumptions & scenario analysis (Driven by primary research)
- 3.15.1 Base Case - key macro & industry variables driving CAGR
- 3.15.2 Optimistic Scenarios - Favorable macro and industry tailwinds
- 3.15.3 Pessimistic Scenario - Macroeconomic slowdown or industry headwinds
Chapter 4 Competitive Landscape, 2025
- 4.1 Introduction
- 4.2 Company market share analysis
- 4.2.1 North America
- 4.2.2 Europe
- 4.2.3 Asia Pacific
- 4.2.4 LATAM
- 4.2.5 MEA
- 4.3 Competitive analysis of major market players
- 4.4 Competitive positioning matrix
- 4.5 Company Tier Benchmarking
- 4.5.1 Tier Classification Criteria & Qualifying Thresholds
- 4.5.2 Tier Positioning Matrix by Revenue, Geography & Innovation
- 4.6 Key developments
- 4.6.1 Mergers & acquisitions
- 4.6.2 Partnerships & collaborations
- 4.6.3 New product launches
- 4.6.4 Expansion plans and funding
Chapter 5 Market Estimates & Forecast, By Component, 2022 - 2035 ($Bn, Units)
- 5.1 Key trends
- 5.2 Power modules
- 5.3 Fuses and circuit breakers
- 5.4 Connectors and terminals
- 5.5 Relays
- 5.6 Voltage regulators
- 5.7 Others
Chapter 6 Market Estimates & Forecast, By Module, 2022 - 2035 ($Bn, Units)
- 6.1 Key trends
- 6.2 Low voltage
- 6.3 Medium voltage
- 6.4 High voltage
Chapter 7 Market Estimates & Forecast, By Vehicle, 2022 - 2035 ($Bn, Units)
- 7.1 Key trends
- 7.2 Passenger cars
- 7.2.1 Hatchback
- 7.2.2 Sedan
- 7.2.3 SUV
- 7.3 Commercial vehicles
- 7.3.1 Light commercial vehicles (LCVs)
- 7.3.2 Medium commercial vehicles (MCVs)
- 7.3.3 Heavy commercial vehicles (HCVs)
Chapter 8 Market Estimates & Forecast, By Sales Channel, 2022 - 2035 ($Bn, Units)
- 8.1 Key trends
- 8.2 OEM
- 8.3 Aftermarket
Chapter 9 Market Estimates & Forecast, By Application, 2022 - 2035 ($Bn, Units)
- 9.1 Key trends
- 9.2 Lighting systems
- 9.3 Infotainment systems
- 9.4 HVAC systems
- 9.5 Safety and driver assistance systems
- 9.6 Powertrain systems
- 9.7 Battery management systems
- 9.8 Others
Chapter 10 Market Estimates & Forecast, By Region, 2022 - 2035 ($Bn, Units)
- 10.1 Key trends
- 10.2 North America
- 10.2.1 US
- 10.2.2 Canada
- 10.3 Europe
- 10.3.1 Germany
- 10.3.2 UK
- 10.3.3 France
- 10.3.4 Italy
- 10.3.5 Spain
- 10.3.6 Russia
- 10.3.7 Netherlands
- 10.3.8 Sweden
- 10.3.9 Denmark
- 10.3.10 Poland
- 10.4 Asia Pacific
- 10.4.1 China
- 10.4.2 India
- 10.4.3 Japan
- 10.4.4 Australia
- 10.4.5 South Korea
- 10.4.6 Singapore
- 10.4.7 Thailand
- 10.4.8 Indonesia
- 10.4.9 Vietnam
- 10.5 Latin America
- 10.5.1 Brazil
- 10.5.2 Mexico
- 10.5.3 Argentina
- 10.5.4 Colombia
- 10.6 MEA
- 10.6.1 South Africa
- 10.6.2 Saudi Arabia
- 10.6.3 UAE
- 10.6.4 Israel
Chapter 11 Company Profiles
- 11.1 Global Players
- 11.1.1 Aptiv
- 11.1.2 Continental
- 11.1.3 Denso
- 11.1.4 Eaton
- 11.1.5 Hitachi Astemo
- 11.1.6 Lear
- 11.1.7 Mitsubishi Electric
- 11.1.8 Robert Bosch
- 11.1.9 TE Connectivity
- 11.1.10 Valeo
- 11.2 Regional Players
- 11.2.1 DRAXLMAIER
- 11.2.2 Furukawa Electric
- 11.2.3 Leoni
- 11.2.4 Panasonic Automotive Systems
- 11.2.5 Sumitomo Electric Industries
- 11.2.6 Yazaki
- 11.3 Emerging Players
- 11.3.1 Infineon Technologies
- 11.3.2 NXP Semiconductors
- 11.3.3 onsemi (ON Semiconductor)
- 11.3.4 STMicroelectronics


