

 |
市場調查報告書
商品編碼
1998851
連接器市場商機、成長要素、產業趨勢分析及 2026-2035 年預測。Connector Market Opportunity, Growth Drivers, Industry Trend Analysis, and Forecast 2026 - 2035 |
||||||
全球連接器市場預計到 2025 年將價值 750 億美元,預計到 2035 年將以 3.7% 的複合年成長率成長至 1,091 億美元。
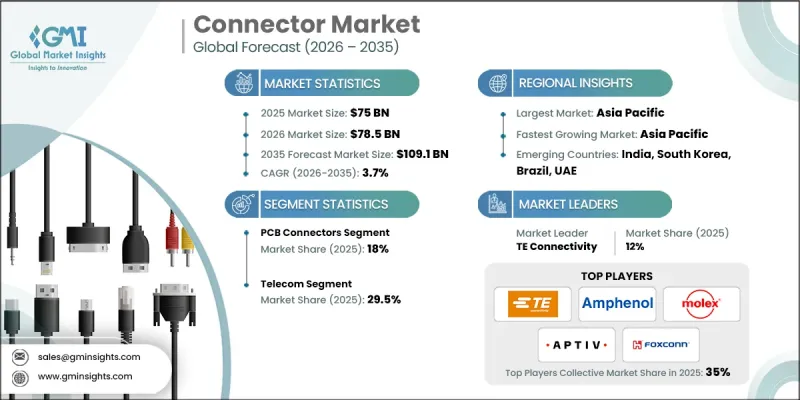
該市場的發展動力源於監管機構為規範家用電子電器充電介面和統一快速擴張的電動車基礎設施中的車輛-充電器連接所做的努力。監管機構優先考慮連接器的統一性,以減少廢棄物、簡化設備生態系統並簡化原始設備製造商 (OEM) 的合規流程。標準化的插座定義了引腳配置、安全通訊協定和快速充電要求,重新定義了材料選擇,並降低了多 SKU 生產的複雜性。在汽車領域,電氣化正在推動對具有卓越抗振性和熱穩定性的高功率連接器的需求。同時,介面標準的整合正在加速認證流程,實現充電網路的互通性,並促進售後市場的成長。此外,人工智慧在資料中心和高效能運算領域的日益普及,也推動了對高速基板對板連接器、夾層連接器、光纖連接器和電纜連接器的需求,這些連接器需要具有低插入損耗、嚴格的時延控制和減少串擾等特性,以應對高密度運算工作負載。
| 市場範圍 | |
|---|---|
| 開始年份 | 2025 |
| 預測期 | 2026-2035 |
| 上市時的市場規模 | 750億美元 |
| 預測金額 | 1091億美元 |
| 複合年成長率 | 3.7% |
受多重通訊協定支援、增強網路安全和高頻寬數位效能需求的推動,I/O連接器市場預計到2035年將以3.4%的複合年成長率成長。這些連接器對於需要高速、可靠資料傳輸和增強屏蔽能力的工業控制器、網路設備和運算系統至關重要。
預計到2025年,通訊領域將佔據29.5%的市場佔有率,到2035年將以4.3%的複合年成長率成長。這一成長主要受頻寬需求不斷成長、高密度5G/5G Advanced部署、雲端優先網路架構以及國際光纖基礎設施擴張的推動。該產業的連接器必須支援超高速資料傳輸、低損耗光纖傳輸以及能夠處理更高頻寬的射頻介面。人工智慧主導的網路現代化進一步推動了高密度光連接器、模組化互連和可擴展光纖平台的應用。
到2025年,美國連接器市場將佔據78%的佔有率,市場規模將達到118億美元。這個市場擴張主要受三大因素驅動:全國電動車充電基礎設施的建設、測試和測量I/O系統的現代化以及支持人工智慧工作負載的超大規模雲的成長。隨著高密度資料中心的增加,市場對專為高密度機架和液冷架構設計的耐熱基板級互連、光纖組件和電源連接器的需求日益成長。
目錄
第1章:調查方法和範圍
第2章執行摘要
第3章業界考察
- 生態系分析
- 監理情勢
- 影響產業的因素
- 促進因素
- 汽車產業前景光明
- 不斷擴張的通訊業
- 快速的都市化和對家用電子電器日益成長的需求
- 產業潛在風險與挑戰
- 劣質產品的流通正成為一個嚴重的問題。
- 促進因素
- 成長潛力分析
- 波特五力分析
- PESTEL 分析
- 新機會和趨勢
- 數位化和物聯網整合
- 進入新興市場
第4章 競爭情勢
- 介紹
- 企業市佔率分析
- 北美洲
- 歐洲
- 亞太地區
- 中東和非洲
- 拉丁美洲
- 競爭性標竿分析
- 戰略儀錶板
- 創新與科技趨勢
第5章 市場規模及預測:依產品分類,2022-2035年
- PCB連接器
- I/O連接器
- 圓形連接器
- 光纖連接器
- 射頻同軸連接器
- 其他
第6章 市場規模與預測:依最終用途分類,2022-2035年
- 溝通
- 運輸
- 車
- 電腦及周邊設備
- 其他行業
第7章 市場規模及預測:依地區分類,2022-2035年
- 北美洲
- 美國
- 加拿大
- 墨西哥
- 歐洲
- 德國
- 法國
- 西班牙
- 英國
- 義大利
- 亞太地區
- 中國
- 印度
- 日本
- 澳洲
- 韓國
- 中東和非洲
- 阿拉伯聯合大公國
- 沙烏地阿拉伯
- 南非
- 拉丁美洲
- 巴西
- 阿根廷
第8章:公司簡介
- 3M
- Ametek
- Amphenol
- Aptiv
- AVX
- Fischer Connectors
- Foxconn
- GTK
- Hirose Electric
- Japan Aviation Electronics
- Lapp Group
- LOTES
- Luxshare Precision
- Mencom
- Molex
- Phoenix Contact
- Rosenberger
- Samtec Inc.
- TE Connectivity
- Yazaki
The Global Connector Market was valued at USD 75 billion in 2025 and is estimated to grow at a CAGR of 3.7% to reach USD 109.1 billion by 2035.
The market is driven by regulatory initiatives aimed at standardizing charging interfaces in consumer electronics and harmonizing vehicle-to-charger connections in rapidly expanding EV infrastructure. Regulators are emphasizing connector uniformity to reduce electronic waste, streamline device ecosystems, and simplify compliance for OEMs. Standardized receptacles define pin configurations, safety protocols, and fast-charging requirements, reshaping material choices and reducing the complexity of multi-SKU production. In the automotive sector, electrification is driving demand for high-power, vibration-resistant, and thermally stable connectors, while fewer interface standards accelerate certification, enable interoperable charging networks, and support aftermarket growth. Meanwhile, rising AI adoption in data centers and high-performance computing is increasing the need for high-speed board-to-board, mezzanine, optical, and cable connectors that offer lower insertion loss, tighter skew control, and reduced crosstalk for dense computational workloads.
| Market Scope | |
|---|---|
| Start Year | 2025 |
| Forecast Year | 2026-2035 |
| Start Value | $75 Billion |
| Forecast Value | $109.1 Billion |
| CAGR | 3.7% |
The I/O connector segment is expected to grow at a CAGR of 3.4% through 2035, fueled by the need for multi-protocol support, enhanced cybersecurity, and high-bandwidth digital performance. These connectors are essential for industrial controllers, networking equipment, and computing systems that demand fast, reliable data transfer with improved shielding.
The telecom segment accounted for 29.5% share in 2025 and is projected to grow at a CAGR of 4.3% by 2035. Growth is driven by rising bandwidth requirements, dense 5G/5G Advanced deployments, cloud-first network architectures, and expanding international fiber infrastructure. Connectors for this industry must support ultra-high-speed data, low-loss optical transmission, and RF interfaces capable of handling higher frequency bands. AI-driven network modernization further increases the adoption of high-density optical connectors, modular interconnects, and scalable fiber platforms.
U.S. Connector Market held a 78% share in 2025, generating USD 11.8 billion. Market expansion is fueled by three key factors: the nationwide build-out of EV charging infrastructure, modernization of test and measurement I/O systems, and hyperscale cloud growth to support AI workloads. High-density data centers are increasing demand for thermally tolerant board-level interconnects, fiber assemblies, and power connectors designed for dense racks and liquid cooling architectures.
Prominent players in the Global Connector Market include 3M, Ametek, Amphenol, Aptiv, AVX, Fischer Connectors, Foxconn, GTK, Hirose Electric, Japan Aviation Electronics, Lapp Group, LOTES, Luxshare Precision, Mencom, Molex, Phoenix Contact, Rosenberger, Samtec Inc., TE Connectivity, and Yazaki. Key strategies deployed by connector manufacturers include investing in R&D for high-speed, high-power, and thermally robust connectors; standardizing products for interoperability across multiple industries; forming strategic partnerships with EV, telecom, and data center OEMs; expanding global manufacturing and distribution networks; and offering integrated technical support and aftersales services. Companies also focus on sustainable material adoption, modular design solutions, and certification readiness to enhance market penetration, reduce customer switching barriers, and improve competitive positioning.
Table of Contents
Chapter 1 Methodology & Scope
- 1.1 Research approach
- 1.2 Quality commitment
- 1.2.1 GMI AI policy & data integrity commitment
- 1.2.1.1 Source consistency protocol
- 1.2.1 GMI AI policy & data integrity commitment
- 1.3 Research Trail & Confidence Scoring
- 1.3.1 Research Trail Components
- 1.3.2 Scoring Components
- 1.4 Data Collection
- 1.4.1 Partial list of primary sources
- 1.5 Data mining sources
- 1.5.1 Paid sources
- 1.5.1.1 Sources, by region
- 1.5.1 Paid sources
- 1.6 Base estimates and calculations
- 1.6.1 Base year calculation for any one approach
- 1.7 Forecast model
- 1.8 Research transparency addendum
- 1.8.1 Source attribution framework
- 1.8.2 Quality assurance metrics
- 1.8.3 Our commitment to trust
- 1.9 Market definitions
Chapter 2 Executive Summary
- 2.1 Industry synopsis, 2022 - 2035
- 2.1.1 Business trends
- 2.1.2 Product trends
- 2.1.3 End use trends
- 2.1.4 Regional trends
Chapter 3 Industry Insights
- 3.1 Industry ecosystem analysis
- 3.2 Regulatory landscape
- 3.3 Industry impact forces
- 3.3.1 Growth drivers
- 3.3.1.1 Positive outlook toward automobile industry
- 3.3.1.2 Expanding telecommunication industry
- 3.3.1.3 Rapid urbanization along with growing demand for consumer electronic devices
- 3.3.2 Industry pitfalls & challenges
- 3.3.2.1 High breach of low-quality products
- 3.3.1 Growth drivers
- 3.4 Growth potential analysis
- 3.5 Porter's analysis
- 3.5.1 Bargaining power of suppliers
- 3.5.2 Bargaining power of buyers
- 3.5.3 Threat of new entrants
- 3.5.4 Threat of substitutes
- 3.6 PESTEL analysis
- 3.6.1 Political factors
- 3.6.2 Economic factors
- 3.6.3 Social factors
- 3.6.4 Technology factors
- 3.6.5 environmental factors
- 3.6.6 Legal factors
- 3.7 Emerging opportunities & trends
- 3.7.1 Digitalization and IoT integration
- 3.7.2 Emerging market penetration
Chapter 4 Competitive landscape, 2025
- 4.1 Introduction
- 4.2 Company market share analysis, 2025
- 4.2.1 North America
- 4.2.2 Europe
- 4.2.3 Asia Pacific
- 4.2.4 Middle East & Africa
- 4.2.5 Latin America
- 4.3 Competitive benchmarking
- 4.4 Strategic dashboard
- 4.5 Innovation & technology landscape
Chapter 5 Market Size and Forecast, By Product, 2022 - 2035 (USD Million, Million Units)
- 5.1 Key trends
- 5.2 PCB connectors
- 5.3 IO connectors
- 5.4 Circular connectors
- 5.5 Fiber optic connectors
- 5.6 RF coaxial connectors
- 5.7 Others
Chapter 6 Market Size and Forecast, By End use, 2022 - 2035 (USD Million, Million Units)
- 6.1 Key trends
- 6.2 Telecom
- 6.3 Transportation
- 6.4 Automotive
- 6.5 Computer & peripherals
- 6.6 Other industries
Chapter 7 Market Size and Forecast, By Region, 2022 - 2035 (USD Million, Million Units)
- 7.1 Key trends
- 7.2 North America
- 7.2.1 U.S.
- 7.2.2 Canada
- 7.2.3 Mexico
- 7.3 Europe
- 7.3.1 Germany
- 7.3.2 France
- 7.3.3 Spain
- 7.3.4 UK
- 7.3.5 Italy
- 7.4 Asia Pacific
- 7.4.1 China
- 7.4.2 India
- 7.4.3 Japan
- 7.4.4 Australia
- 7.4.5 South Korea
- 7.5 Middle East & Africa
- 7.5.1 UAE
- 7.5.2 Saudi Arabia
- 7.5.3 South Africa
- 7.6 Latin America
- 7.6.1 Brazil
- 7.6.2 Argentina
Chapter 8 Company Profiles
- 8.1 3M
- 8.2 Ametek
- 8.3 Amphenol
- 8.4 Aptiv
- 8.5 AVX
- 8.6 Fischer Connectors
- 8.7 Foxconn
- 8.8 GTK
- 8.9 Hirose Electric
- 8.10 Japan Aviation Electronics
- 8.11 Lapp Group
- 8.12 LOTES
- 8.13 Luxshare Precision
- 8.14 Mencom
- 8.15 Molex
- 8.16 Phoenix Contact
- 8.17 Rosenberger
- 8.18 Samtec Inc.
- 8.19 TE Connectivity
- 8.20 Yazaki
 2026年全球拖車7針連接器市場報告
 MS連接器市場報告:趨勢、預測和競爭分析(至2035年)壓接連接器市場報告:趨勢、預測和競爭分析(至2035年)電纜、電線和連接器市場報告:趨勢、預測和競爭分析(至2035年)彈簧銷連接器市場報告:趨勢、預測和競爭分析(至2035年)半間距連接器市場報告:趨勢、預測和競爭分析(至2035年)
 奈米微型連接器市場預測至2034年—按類型、材料、最終用戶和地區分類的全球分析SCSI連接器市場報告:趨勢、預測和競爭分析(至2035年)平面印刷電路基板連接器市場報告:趨勢、預測與競爭分析(至2035年)插座連接器市場報告:趨勢、預測和競爭分析(至2035年)