


 |
市場調查報告書
商品編碼
1998819
智慧車隊管理市場機會、成長促進因素、產業趨勢分析及預測(2026-2035年)Smart Fleet Management Market Opportunity, Growth Drivers, Industry Trend Analysis, and Forecast 2026 - 2035 |
||||||
2025年全球智慧車隊管理市場價值為614億美元,預計2035年將以8.9%的複合年成長率成長至1,395億美元。
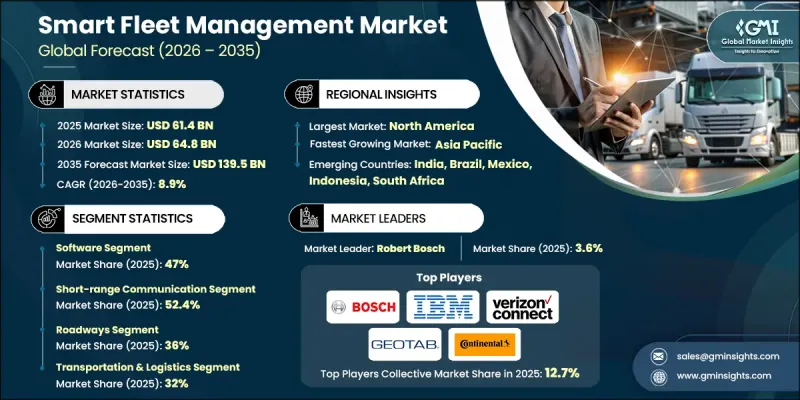
隨著企業日益重視營運視覺性和效率,市場蓄勢待發,即將迎來顯著成長。管理車隊的企業正在投資智慧車隊管理系統,以全面了解車輛位置、駕駛員表現和營運指標。這使管理人員能夠做出數據驅動的決策,減少延遲,最佳化車隊運轉率,並提高整體效率。不斷上漲的燃油成本和營運壓力正在推動企業採用能夠最大限度減少怠速、最佳化路線和追蹤駕駛員行為的解決方案。透過利用分析和遠端資訊處理技術,車隊營運商可以降低油耗、提高生產力並實施預測性維護策略。聯網汽車和物聯網系統的日益整合也促進了即時監控和可操作洞察的實現,使各行各業的企業能夠在提高成本效益和車隊績效的同時,應對營運挑戰。
| 市場範圍 | |
|---|---|
| 開始年份 | 2025 |
| 預測期 | 2026-2035 |
| 起始金額 | 614億美元 |
| 預測金額 | 1395億美元 |
| 複合年成長率 | 8.9% |
截至2025年,短程通訊領域將佔據52.4%的市場佔有率,預計到2035年將以8%的複合年成長率成長。藍牙、RFID和Wi-Fi等技術可實現車輛之間或車輛與本地基礎設施之間短距離的資料交換。這些解決方案支援局部監控、透過感測器快速更新數據,以及協調車輛在倉庫、裝卸點和園區運作中的運作。
到2025年,運輸和物流行業將佔據32%的市場佔有率。智慧車隊管理工具可協助營運商最佳化車輛運轉率、路線規劃、駕駛員行為和燃油效率。即時追蹤、預測性維護和分析功能可降低成本、確保準時交付,並提高區域和國際網路的營運效率。
預計到2025年,美國智慧車隊管理市場規模將達210億美元。美國商業車隊營運商正在擴大遠端資訊處理技術的應用,用於監控燃油消耗、最佳化配送路線和追蹤駕駛員績效。基於雲端平台和人工智慧驅動的預測性維護解決方案正被廣泛應用於各種類型的車輛。電子記錄設備(ELD)相關法規的合規性進一步推動了即時報告和績效基準測試,從而有助於提高大規模貨運網路的安全性、課責和營運效率。
目錄
第1章:調查方法
第2章執行摘要
第3章業界考察
- 產業生態系分析
- 供應商情況
- 利潤率
- 成本結構
- 每個階段增加的價值
- 影響價值鏈的因素
- 中斷
- 影響產業的因素
- 成長促進因素
- 即時車輛狀態可視化
- 最佳化燃料成本
- 安全和合法令遵循
- 電子商務和最後一公里配送的成長
- 產業潛在風險與挑戰
- 前期實施成本高
- 資料隱私與網路安全風險
- 市場機遇
- 電動車充電基礎設施的整合
- 拓展新興市場
- 里程保險(UBI)
- 公共部門車輛管理數位化
- 成長促進因素
- 成長潛力分析
- 監理情勢
- 北美洲
- 美國國家公路交通安全管理局(NHTSA)
- 加拿大運輸部車輛安全標準(CMVSS)
- 歐洲
- 歐洲車輛類型認證(WVTA)
- 歐洲經濟共同體法規 124 (R124)
- 亞太地區
- 日本汽車標準協會(JASO)
- AIS(汽車產業標準)- 印度
- 拉丁美洲
- 巴西國家交通運輸委員會(CONTRAN)-第242號決議
- 墨西哥官方標準 (Normas Oficiales Mexicanas)
- 中東和非洲
- ESMA(阿拉伯聯合大公國標準化和計量局)
- 南非標準局(SABS)
- 北美洲
- 波特五力分析
- PESTEL 分析
- 科技與創新趨勢
- 當前技術趨勢
- 新興技術
- 價格分析(基於初步調查)
- 對過去價格趨勢的分析
- 按球員類型分類的定價策略(高階/超值/成本加成)
- 成本細分分析
- 專利分析(基於初步研究)
- 永續性和環境方面
- 永續計劃
- 減少廢棄物策略
- 生產中的能源效率
- 環保意識的舉措
- 關於碳足跡的考量
- 人工智慧和生成式人工智慧對市場的影響
- 利用人工智慧改造現有經營模式
- GenAI 各細分市場的應用案例與部署藍圖
- 風險、限制和監管考量
- 基礎設施和實施情況(基於初步調查)
- 按地區和購買者群體分類的採用率
- 基礎設施投資的可擴展性限制和趨勢
- 預測假設和情境分析(基於初步研究)
- 基本案例-驅動複合年成長率的關鍵宏觀經濟與產業變量
- 樂觀情境-宏觀經濟與產業的順風
- 悲觀情景-宏觀經濟放緩或產業逆風
第4章 競爭情勢
- 介紹
- 企業市佔率分析
- 北美洲
- 歐洲
- 亞太地區
- 拉丁美洲
- 中東和非洲(MEA)
- 主要市場公司的競爭分析
- 競爭定位矩陣
- 主要進展
- 併購
- 夥伴關係與合作
- 新產品發布
- 業務拓展計劃及資金籌措
- 企業級分層基準測試
- 層級分類標準與選擇標準
- 按收入、地區和創新能力分類的層級定位矩陣。
第5章 市場估計與預測:依組件分類,2022-2035年
- 硬體
- 追蹤設備
- 車載資訊設備
- 感應器
- 遠距離診斷
- 通訊設備
- 其他
- 軟體
- 車輛追蹤
- 路線最佳化
- 合規與報告
- 其他
- 服務
- 專業服務
- 諮詢與整合
- 客製化
- 系統實現
- 託管服務
- 遠端監控
- 支援與維護
- 專業服務
第6章 市場估算與預測:依連結技術分類,2022-2035年
- 近距離場通訊
- 遠端通訊
- 混合
第7章 市場估計與預測:依運輸方式分類,2022-2035年
- 路
- 海
- 航空
- 鐵路
第8章 市場估算與預測:依最終用途產業分類,2022-2035年
- 運輸/物流
- 零售與電子商務
- 醫療和緊急服務
- 石油和天然氣
- 建築和採礦
- 現場服務
- 政府/公共部門
- 其他
第9章 市場估計與預測:依地區分類,2022-2035年
- 北美洲
- 美國
- 加拿大
- 歐洲
- 德國
- 英國
- 法國
- 義大利
- 西班牙
- 北歐國家
- 俄羅斯
- 波蘭
- 羅馬尼亞
- 亞太地區
- 中國
- 印度
- 日本
- 韓國
- ANZ
- 越南
- 印尼
- 菲律賓
- 拉丁美洲
- 巴西
- 墨西哥
- 阿根廷
- 中東和非洲(MEA)
- 南非
- 沙烏地阿拉伯
- 阿拉伯聯合大公國
第10章:公司簡介
- 世界公司
- Cisco Systems
- Continental
- Denso
- General Motors
- IBM
- Infineon Technologies
- Magellan and Trimble Navigation
- Robert Bosch
- Siemens
- Zonar Systems
- 當地公司
- MiX Telematics
- Samsara
- Teletrac Navman
- Omnitracs
- Fleet Complete
- Hitachi
- Powerfleet
- Gurtam(Wialon)
- 新興企業
- Azuga
- CalAmp
- Noregon
- Zubie
The Global Smart Fleet Management Market was valued at USD 61.4 billion in 2025 and is estimated to grow at a CAGR of 8.9% to reach USD 139.5 billion by 2035.
Market growth is poised for significant growth as businesses increasingly prioritize operational visibility and efficiency. Companies managing vehicle fleets are investing in smart fleet management systems to gain comprehensive oversight of vehicle locations, driver performance, and operational metrics. This enables managers to make data-driven decisions, reduce delays, optimize fleet utilization, and improve overall efficiency. Rising fuel costs and operational pressures are driving the adoption of solutions that minimize idling, optimize routes, and track driver behavior. By leveraging analytics and telematics, fleet operators can reduce fuel consumption, enhance productivity, and implement predictive maintenance strategies. The growing integration of connected vehicles and IoT-enabled systems also facilitates real-time monitoring and actionable insights, enabling companies to address operational challenges while improving cost efficiency and fleet performance across industries.
| Market Scope | |
|---|---|
| Start Year | 2025 |
| Forecast Year | 2026-2035 |
| Start Value | $61.4 Billion |
| Forecast Value | $139.5 Billion |
| CAGR | 8.9% |
The short-range communication segment held a 52.4% share in 2025 and is expected to grow at a CAGR of 8% through 2035. Technologies such as Bluetooth, RFID, and Wi-Fi allow limited-distance data exchange between vehicles or between vehicles and local infrastructure. These solutions support localized monitoring, rapid updates via sensors, and fleet coordination across depots, loading points, and campus operations.
The transportation and logistics sector accounted for 32% share in 2025. Smart fleet management tools help operators optimize vehicle utilization, route planning, driver behavior, and fuel efficiency. Real-time tracking, predictive maintenance, and analytics reduce costs, ensure timely deliveries, and enhance operational efficiency across regional and international networks.
U.S. Smart Fleet Management Market reached USD 21 billion in 2025. Commercial fleet operators in the U.S. increasingly use telematics to monitor fuel usage, optimize delivery routes, and track driver performance. Cloud-based platforms and AI-driven predictive maintenance solutions are widely adopted across different vehicle types. Regulatory compliance for electronic logging devices (ELDs) further supports real-time reporting and performance benchmarking, improving safety, accountability, and operational efficiency across large trucking networks.
Key players in the Global Smart Fleet Management Market include IBM, Cisco Systems, Siemens, Continental, Denso, Infineon Technologies, Robert Bosch, Magellan and Trimble Navigation, Zonar Systems, and General Motors. Companies in the Smart Fleet Management Market are leveraging multiple strategies to solidify their market presence. Key approaches include investing in advanced telematics and IoT platforms that enable real-time fleet tracking and predictive analytics. Strategic partnerships with logistics operators and automotive manufacturers allow firms to expand their customer base and integrate solutions across vehicle types. Several players are enhancing their offerings through AI-driven route optimization, fuel management tools, and driver behavior monitoring systems. Expansion into new geographic regions and development of modular, scalable solutions provide flexibility for small and large fleet operators alike. Additionally, firms are focusing on regulatory compliance, cybersecurity, and cloud-based platforms to maintain trust, improve operational efficiency, and strengthen competitive positioning in the global smart fleet management market.
Table of Contents
Chapter 1 Methodology
- 1.1 Research approach
- 1.2 Quality commitments
- 1.3 GMI AI policy & data integrity commitment
- 1.4 Research trail & confidence scoring
- 1.4.1 Research trail components
- 1.4.2 Scoring components
- 1.5 Data collection
- 1.5.1 Partial list of primary sources
- 1.6 Data mining sources
- 1.6.1 Paid sources
- 1.7 Base estimates and calculations
- 1.7.1 Base year calculation
- 1.8 Forecast model
- 1.9 Research transparency addendum
Chapter 2 Executive Summary
- 2.1 Industry 360° synopsis
- 2.2 Key market trends
- 2.2.1 Regional
- 2.2.2 Component
- 2.2.3 Connectivity technology
- 2.2.4 Transport mode
- 2.2.5 End use industry
- 2.3 TAM analysis, 2026-2035
- 2.4 CXO perspectives: Strategic imperatives
Chapter 3 Industry Insights
- 3.1 Industry ecosystem analysis
- 3.1.1 Supplier landscape
- 3.1.2 Profit margin
- 3.1.3 Cost structure
- 3.1.4 Value addition at each stage
- 3.1.5 Factor affecting the value chain
- 3.1.6 Disruptions
- 3.2 Industry impact forces
- 3.2.1 Growth drivers
- 3.2.1.1 Real-time fleet visibility
- 3.2.1.2 Fuel cost optimization
- 3.2.1.3 Safety & compliance regulations
- 3.2.1.4 E-commerce & last-mile delivery growth
- 3.2.2 Industry pitfalls and challenges
- 3.2.2.1 High initial deployment costs
- 3.2.2.2 Data privacy & cybersecurity risks
- 3.2.3 Market opportunities
- 3.2.3.1 EV charging infrastructure integration
- 3.2.3.2 Emerging market expansion
- 3.2.3.3 Usage-based insurance (UBI)
- 3.2.3.4 Public sector fleet digitization
- 3.2.1 Growth drivers
- 3.3 Growth potential analysis
- 3.4 Regulatory landscape
- 3.4.1 North America
- 3.4.1.1 National Highway Traffic Safety Administration (NHTSA)
- 3.4.1.2 Transport Canada Motor Vehicle Safety Standards (CMVSS)
- 3.4.2 Europe
- 3.4.2.1 European Whole Vehicle Type Approval (WVTA)
- 3.4.2.2 ECE Regulation 124 (R124)
- 3.4.3 Asia Pacific
- 3.4.3.1 Japan Automotive Standards Organization (JASO)
- 3.4.3.2 AIS (Automotive Industry Standards) - India
- 3.4.4 Latin America
- 3.4.4.1 Brazilian National Traffic Council (CONTRAN) - Resolution 242
- 3.4.4.2 Mexican NOM Standards (Normas Oficiales Mexicanas)
- 3.4.5 Middle East & Africa
- 3.4.5.1 Emirates Authority for Standardization and Metrology (ESMA)
- 3.4.5.2 South African Bureau of Standards (SABS)
- 3.4.1 North America
- 3.5 Porter's analysis
- 3.6 PESTEL analysis
- 3.7 Technology and innovation landscape
- 3.7.1 Current technological trends
- 3.7.2 Emerging technologies
- 3.8 Pricing Analysis (Driven by Primary Research)
- 3.8.1 Historical Price Trend Analysis
- 3.8.2 Pricing Strategy by Player Type (Premium / Value / Cost-plus)
- 3.9 Cost breakdown analysis
- 3.10 Patent analysis (Driven by Primary Research)
- 3.11 Sustainability and environmental aspects
- 3.11.1 Sustainable practices
- 3.11.2 Waste reduction strategies
- 3.11.3 Energy efficiency in production
- 3.11.4 Eco-friendly initiatives
- 3.11.5 Carbon footprint considerations
- 3.12 Impact of AI & Generative AI on the Market
- 3.12.1 AI-driven disruption of existing business models
- 3.12.2 GenAI use cases & adoption roadmap by segment
- 3.12.3 Risks, limitations & regulatory considerations
- 3.13 Infrastructure & deployment landscape (driven by primary research)
- 3.13.1 Deployment penetration by region & buyer segment
- 3.13.2 Scalability constraints & infrastructure investment trends
- 3.14 Forecast assumptions & scenario analysis (driven by primary research)
- 3.14.1 Base Case - key macro & industry variables driving CAGR
- 3.14.2 Optimistic Scenarios - Favorable macro and industry tailwinds
- 3.14.3 Pessimistic Scenario - Macroeconomic slowdown or industry headwinds
Chapter 4 Competitive Landscape, 2025
- 4.1 Introduction
- 4.2 Company market share analysis
- 4.2.1 North America
- 4.2.2 Europe
- 4.2.3 Asia Pacific
- 4.2.4 LATAM
- 4.2.5 MEA
- 4.3 Competitive analysis of major market players
- 4.4 Competitive positioning matrix
- 4.5 Key developments
- 4.5.1 Mergers & acquisitions
- 4.5.2 Partnerships & collaborations
- 4.5.3 New product launches
- 4.5.4 Expansion plans and funding
- 4.6 Company tier benchmarking
- 4.6.1 Tier classification criteria & qualifying thresholds
- 4.6.2 Tier positioning matrix by revenue, geography & innovation
Chapter 5 Market Estimates & Forecast, By Component, 2022 - 2035 ($Mn, Units)
- 5.1 Key trends
- 5.2 Hardware
- 5.2.1 Tracking devices
- 5.2.2 Telematics devices
- 5.2.3 Sensors
- 5.2.4 Remote diagnostics
- 5.2.5 Communication devices
- 5.2.6 Others
- 5.3 Software
- 5.3.1 Vehicle tracking
- 5.3.2 Route optimization
- 5.3.3 Compliance & reporting
- 5.3.4 Others
- 5.4 Services
- 5.4.1 Professional services
- 5.4.1.1 Consulting & integration
- 5.4.1.2 Customization
- 5.4.1.3 System deployment
- 5.4.2 Managed services
- 5.4.2.1 Remote monitoring
- 5.4.2.2 Support & maintenance
- 5.4.1 Professional services
Chapter 6 Market Estimates & Forecast, By Connectivity Technology, 2022 - 2035 ($Mn)
- 6.1 Key trends
- 6.2 Short-range communication
- 6.3 Long-range communication
- 6.4 Hybrid
Chapter 7 Market Estimates & Forecast, By Transport Mode, 2022 - 2035 ($Mn)
- 7.1 Key trends
- 7.2 Roadways
- 7.3 Marine
- 7.4 Airways
- 7.5 Railways
Chapter 8 Market Estimates & Forecast, By End Use Industry, 2022 - 2035 ($Mn)
- 8.1 Key trends
- 8.2 Transportation & logistics
- 8.3 Retail & e-commerce
- 8.4 Healthcare & emergency services
- 8.5 Oil & gas
- 8.6 Construction & mining
- 8.7 Field services
- 8.8 Government & public sector
- 8.9 Others
Chapter 9 Market Estimates & Forecast, By Region, 2022 - 2035 ($Mn)
- 9.1 Key trends
- 9.2 North America
- 9.2.1 US
- 9.2.2 Canada
- 9.3 Europe
- 9.3.1 Germany
- 9.3.2 UK
- 9.3.3 France
- 9.3.4 Italy
- 9.3.5 Spain
- 9.3.6 Nordics
- 9.3.7 Russia
- 9.3.8 Poland
- 9.3.9 Romania
- 9.4 Asia Pacific
- 9.4.1 China
- 9.4.2 India
- 9.4.3 Japan
- 9.4.4 South Korea
- 9.4.5 ANZ
- 9.4.6 Vietnam
- 9.4.7 Indonesia
- 9.4.8 Philippines
- 9.5 Latin America
- 9.5.1 Brazil
- 9.5.2 Mexico
- 9.5.3 Argentina
- 9.6 MEA
- 9.6.1 South Africa
- 9.6.2 Saudi Arabia
- 9.6.3 UAE
Chapter 10 Company Profiles
- 10.1 Global companies
- 10.1.1 Cisco Systems
- 10.1.2 Continental
- 10.1.3 Denso
- 10.1.4 General Motors
- 10.1.5 IBM
- 10.1.6 Infineon Technologies
- 10.1.7 Magellan and Trimble Navigation
- 10.1.8 Robert Bosch
- 10.1.9 Siemens
- 10.1.10 Zonar Systems
- 10.2 Regional players
- 10.2.1 MiX Telematics
- 10.2.2 Samsara
- 10.2.3 Teletrac Navman
- 10.2.4 Omnitracs
- 10.2.5 Fleet Complete
- 10.2.6 Hitachi
- 10.2.7 Powerfleet
- 10.2.8 Gurtam (Wialon)
- 10.3 Emerging players
- 10.3.1 Azuga
- 10.3.2 CalAmp
- 10.3.3 Noregon
- 10.3.4 Zubie
 共用電動車隊管理和訂閱式旅遊市場預測至2034年:按車輛類型、服務模式、車隊管理功能、最終用戶和地區分類的全球分析智慧車隊事件管理市場預測至2034年-按組件、部署模式、車隊類型、事件類型、最終用戶和地區分類的全球分析
 2026年全球智慧車隊管理市場報告智慧車隊遠端資訊處理市場預測:至 2034 年:全球解決方案、硬體、運輸方式、連接方式、車隊規模、最終用戶和區域分析
 智慧車隊管理市場規模、佔有率、成長及全球產業分析:按類型、應用和地區分類的洞察,2026-2034 年預測全球智慧車隊管理市場規模、佔有率、趨勢和成長分析報告:2026-2034年
 智慧車隊管理市場-全球產業規模、佔有率、趨勢、機會及預測(按模式、應用、連接方式、營運模式、地區和競爭格局分類,2021-2031年)
 智慧公車交通管理系統市場:按組件、公車類型、服務、應用和部署模式分類-全球預測,2026-2032年
 智慧車隊管理市場規模、佔有率和成長分析(按模式、連接方式、營運方式、應用領域和地區分類)-2026-2033年產業預測
 2024-2028年全球智慧車隊管理市場