

 |
市場調查報告書
商品編碼
1998777
可攜式投影機市場機會、成長要素、產業趨勢分析及2026-2035年預測Portable Projector Market Opportunity, Growth Drivers, Industry Trend Analysis, and Forecast 2026 - 2035 |
||||||
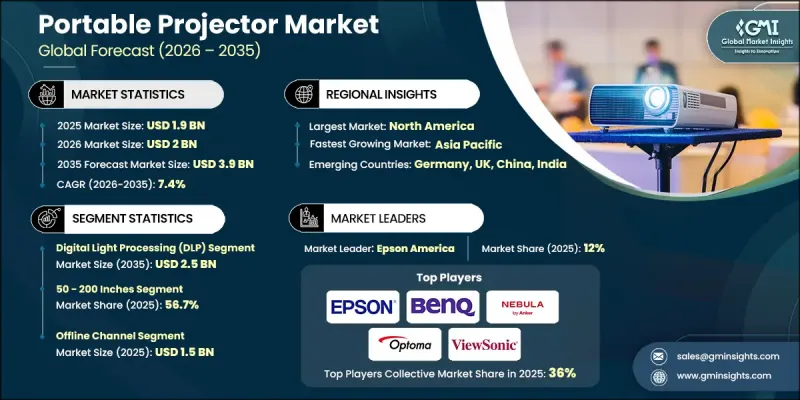
全球可攜式投影機市場預計到 2025 年將價值 19 億美元,預計到 2035 年將以 7.4% 的複合年成長率成長至 39 億美元。
隨著數位化學習和靈活演示技術在各個領域的廣泛應用,全球可攜式投影機產業正經歷著穩定成長。教育機構擴大在教室部署可攜式顯示器解決方案,以支援互動式和協作式學習環境。隨著人們對數位教育工具的興趣日益濃厚,學校、大學和培訓機構都在推廣使用便於攜帶且可安裝在各種教育環境中的緊湊型投影設備。支持教育領域數位轉型的公共措施也促進了對可攜式投影機的需求成長。除了教育領域,企業和組織也將可攜式投影機應用於專業培訓專案、研討會和內部學習課程。這些設備使主講人能夠在各種環境中有效地呈現視覺內容,而無需進行永久性安裝。投影系統的技術進步進一步推動了市場擴張,尤其是在消費者對更高解析度顯示器和更高視覺清晰度的需求不斷成長的情況下。隨著用戶對高品質觀看體驗的日益重視,能夠提供更清晰影像和更高色彩準確度的先進影像技術的需求也日益成長。隨著可攜式娛樂系統和靈活工作模式的日益普及,可攜式投影機預計將繼續在全球可攜式投影機市場中扮演重要角色,無論是在商用還是個人領域。
| 市場範圍 | |
|---|---|
| 開始年份 | 2025 |
| 預測期 | 2026-2035 |
| 上市時的市場規模 | 19億美元 |
| 預測金額 | 39億美元 |
| 複合年成長率 | 7.4% |
數位光處理 (DLP) 投影機市場預計在 2025 年達到 12 億美元,到 2035 年將達到 25 億美元。憑藉其卓越的性能和緊湊的設計,DLP 技術在可攜式投影機市場持續佔據重要佔有率。採用此技術的投影機以其高對比度和快速的影像反應時間而廣受認可,從而能夠輸出更清晰的影像。其緊湊的結構和輕巧的設計使其對追求高便攜性的用戶極具吸引力,方便用戶隨時隨地攜帶。這些優勢推動了 DLP 投影機在商用和個人中的廣泛應用。此外,該技術支援高品質的圖像再現,因此也深受尋求可靠影像性能以進行演示和娛樂應用的消費者的青睞。
到2025年,50-200吋投影機將佔據56.7%的市場。中等尺寸的投影機因其在顯示尺寸和便攜性之間取得的實用平衡而備受消費者青睞。這些投影機保持了緊湊的外形規格,便於運輸和安裝,同時又能提供足夠大的螢幕尺寸,帶來沉浸式的觀看體驗。它們的柔軟性使其對住宅和商用用戶都極具吸引力,因為它們可以在各種環境中使用。許多消費者正在將這一尺寸範圍的投影機納入其個人娛樂系統,從而推動了產品需求的成長。此外,中等尺寸投影系統的多功能性也促使它們在需要靈活顯示解決方案的各種環境中得到應用。
預計到2025年,美國可攜式投影機市場佔有率將達到82.5%。美國可攜式投影機產業受益於其強大的技術應用文化和對數位基礎設施的持續投入。全國範圍內為學習環境現代化和採用先進教育技術所做的努力,正在推動可攜式投影系統在教育機構中的應用。網路連接的改善和數位學習平台的擴展也促進了可攜式顯示設備的普及。此外,混合辦公室模式的興起和數位協作工具的增加,也為可攜式投影技術在工作場所的應用創造了新的機會。數位基礎設施的改善使得線上內容的存取更加便捷,進一步促進了可攜式投影機在教育機構和職場的應用。
目錄
第1章:調查方法和範圍
第2章執行摘要
第3章業界考察
- 生態系分析
- 供應商情況
- 利潤率
- 每個階段增加的價值
- 影響價值鏈的因素
- 影響產業的因素
- 促進因素
- 教育領域的數位化
- 可支配所得增加
- 線上市場的興起
- 產業潛在風險與挑戰
- 其他投影螢幕方案及已安裝投影機的可用性
- 亮度和影像品質限制
- 機會
- 家庭娛樂和混合辦公的需求日益成長。
- 智慧/物聯網和人工智慧主導能力的整合
- 促進因素
- 成長潛力分析
- 未來市場趨勢
- 科技與創新趨勢
- 當前技術趨勢
- 新興技術
- 價格趨勢
- 按類型
- 按地區
- 監理情勢
- 北美洲
- 美國:消費品安全委員會(CPSC)聯邦法規(CFR)第16篇第1512節
- 加拿大:國際標準化組織(ISO)4210
- 歐洲
- 德國:德國標準化協會 (DIN)、歐洲標準 (EN)、ISO 4210
- 英國:歐洲標準 (EN) ISO 4210 /英國合格評定 (UKCA)
- 法國:歐洲標準 (EN) ISO 4210
- 亞太地區
- 中國:國家標誌(GB)3565
- 印度:印度標準 (IS) 10613
- 日本:日本工業標準(JIS)D 9110
- 拉丁美洲
- 巴西:巴西技術標準協會 (ABNT)、巴西標準局 (NBR)、ISO 4210
- 墨西哥:國際標準化組織(ISO)4210
- 中東和非洲
- 南非:南非國家標準 (SANS) 311
- 沙烏地阿拉伯:沙烏地阿拉伯標準、計量和品質組織 (SASO)、海灣標準化組織 (GSO)、ISO 4210
- 北美洲
- 貿易數據分析
- 進出口數量和價值的變化趨勢
- 主要貿易路線及關稅的影響
- 人工智慧和生成式人工智慧對市場的影響
- 利用人工智慧改造現有經營模式
- Genai 各細分市場的應用案例與實施藍圖
- 風險、限制和監管考量
- 波特五力分析
- PESTEL 分析
- 消費行為分析
- 購買模式
- 偏好分析
- 消費行為的區域差異
- 電子商務對購買決策的影響
第4章 競爭情勢
- 介紹
- 企業市佔率分析
- 按地區
- 企業矩陣分析
- 主要市場公司的競爭分析
- 競爭定位矩陣
- 主要進展
- 併購
- 夥伴關係與合作
- 新產品發布
- 業務拓展計劃
第5章 市場估計與預測:依技術分類,2022-2035年
- 數位光處理(DLP)
- 液晶顯示器(LCD)
- 矽基液晶顯示器(LOCOS)
- 其他
第6章 市場估價與預測:依投影螢幕尺寸分類,2022-2035年
- 小於50英寸
- 50-200英寸
- 超過200英寸
第7章 市場估計與預測:以連結方式分類,2022-2035年
- 有線
- 無線的
第8章 市場估算與預測:依最終用途分類,2022-2035年
- 家庭娛樂
- 教育機構
- 商業專業人士
- 遊戲
- 活動主辦者
- 媒體製作/內容製作公司
- 其他設施(休息室、俱樂部、運動中心等)
第9章 市場估價與預測:依通路分類,2022-2035年
- 線上
- 電子商務
- 企業網站
- 離線
- 專賣店
- 大型零售商店
- 其他
第10章 市場估價與預測:依地區分類,2022-2035年
- 北美洲
- 美國
- 加拿大
- 歐洲
- 德國
- 法國
- 英國
- 義大利
- 西班牙
- 亞太地區
- 中國
- 印度
- 日本
- 韓國
- 澳洲
- 拉丁美洲
- 巴西
- 墨西哥
- 阿根廷
- 中東和非洲(MEA)
- 南非
- 沙烏地阿拉伯
- 阿拉伯聯合大公國
第11章:公司簡介
- AAXA Technologies
- Acer
- Anker(Nebula)
- ASUS
- BenQ
- Epson America
- JMGO
- LG Electronics
- Optoma
- Philips
- Samsung
- Sony
- ViewSonic
- Xiaomi
- XGIMI
The Global Portable Projector Market was valued at USD 1.9 billion in 2025 and is estimated to grow at a CAGR of 7.4% to reach USD 3.9 billion by 2035.
The global portable projector industry is witnessing steady growth as digital learning and flexible presentation technologies become more widely adopted across multiple sectors. Educational institutions are increasingly integrating portable display solutions into classrooms to support interactive and collaborative learning environments. The growing emphasis on digital education tools is encouraging schools, universities, and training institutions to adopt compact projection devices that can be easily transported and deployed in different teaching spaces. Public initiatives supporting digital transformation in education are also contributing to the rising demand for portable projectors. Beyond the education sector, businesses and organizations are incorporating portable projection devices into professional training programs, workshops, and corporate learning sessions. These devices allow presenters to deliver visual content efficiently in a variety of environments without requiring permanent installations. Technological improvements in projection systems are further supporting market expansion, particularly as consumers seek higher resolution displays and enhanced visual clarity. Demand for advanced imaging technologies capable of delivering sharper images and improved color accuracy is increasing as users prioritize high-quality viewing experiences. As portable entertainment systems and flexible work environments become more common, portable projectors are expected to remain an important tool for both professional and personal use across the global portable projector market.
| Market Scope | |
|---|---|
| Start Year | 2025 |
| Forecast Year | 2026-2035 |
| Start Value | $1.9 Billion |
| Forecast Value | $3.9 Billion |
| CAGR | 7.4% |
The digital light processing (DLP) segment generated USD 1.2 billion in 2025 and is expected to reach USD 2.5 billion by 2035. DLP technology continues to represent a significant portion of the portable projector market due to its strong performance capabilities and compact design. Projectors based on this technology are widely recognized for delivering high contrast ratios and fast image response times, which contribute to clearer visual output. Their compact structure and lightweight construction make them particularly attractive for users who require highly portable devices that can be transported easily between locations. These advantages have strengthened the adoption of DLP projectors across professional and personal use cases. The technology also supports high-quality image rendering, which appeals to consumers seeking reliable visual performance for presentations and entertainment applications.
The 50-200 inches segment held 56.7% share in 2025. Mid-range projection sizes remain highly popular among consumers because they offer a practical balance between display size and device portability. These projectors provide sufficient screen dimensions for immersive viewing experiences while still maintaining compact form factors that allow convenient transport and setup. Their flexibility allows them to be used across a variety of settings, making them appealing to both residential and professional users. Many consumers are adopting projectors within this size range as part of their personal entertainment setups, contributing to increased product demand. The versatility of mid-size projection systems also supports their use in different environments where adaptable display solutions are required.
United States Portable Projector Market accounted for 82.5% share in 2025. The US portable projector industry benefits from a strong technology adoption culture and ongoing investment in digital infrastructure. Nationwide efforts to modernize learning environments and incorporate advanced educational technologies are encouraging the use of portable projection systems in academic institutions. Increased connectivity and expanding digital learning platforms are also supporting the broader adoption of portable display devices. In addition, the growing prevalence of hybrid work arrangements and digital collaboration tools has created new opportunities for portable projection technologies across professional environments. Improvements in digital infrastructure have enabled greater access to online content, which further supports the use of portable projectors for both educational and workplace applications.
Major companies operating in the Global Portable Projector Market include AAXA Technologies, Acer, Anker (Nebula), ASUS, BenQ, Epson America, JMGO, LG Electronics, Optoma, Philips, Samsung, Sony, ViewSonic, Xiaomi, and XGIMI. Companies active in the Portable Projector Market are implementing several strategic initiatives to strengthen their competitive position and expand their market presence. Product innovation remains a central focus, with manufacturers investing in advanced display technologies that improve resolution, brightness, and overall image performance. Many companies are also developing compact designs that enhance portability while maintaining high visual quality. Strategic partnerships with technology distributors and retail networks help manufacturers increase product accessibility across global markets. In addition, companies are expanding their smart projector portfolios by integrating wireless connectivity, streaming capabilities, and mobile device compatibility. Continuous investment in research and development supports the introduction of improved projection systems that meet evolving consumer expectations.
Table of Contents
Chapter 1 Methodology & Scope
- 1.1 Market scope & definitions
- 1.2 Research design
- 1.2.1 Research approach
- 1.2.2 Data collection methods
- 1.3 Base estimates and calculations
- 1.3.1 Base year calculation
- 1.3.2 Market estimates & forecasts parameters
- 1.4 Forecast Model
- 1.4.1 Key trends for market estimates
- 1.4.2 Quantified market impact analysis
- 1.4.2.1 Mathematical impact of growth parameters on forecast
- 1.4.3 Scenario analysis framework
- 1.5 Primary research and validation
- 1.5.1 Some of the primary sources (but not limited to)
- 1.6 Data mining sources
- 1.6.1 Paid Sources
- 1.7 Primary research and validation
- 1.7.1 Primary sources
- 1.8 Research Trail & confidence scoring
- 1.8.1 Research trail components
- 1.8.2 Scoring components
- 1.9 Research transparency addendum
- 1.9.1 Source attribution framework
- 1.9.2 Quality assurance metrics
- 1.9.3 Our commitment to trust
- 1.10 Market Definitions
Chapter 2 Executive Summary
- 2.1 Industry 360° synopsis
- 2.2 Key market trends
- 2.2.1 Regional
- 2.2.2 Technology
- 2.2.3 Projector screen size
- 2.2.4 Connectivity
- 2.2.5 End use
- 2.2.6 Distribution channel
- 2.3 CXO perspectives: Strategic imperatives
- 2.3.1 Key decision points for industry executives
- 2.3.2 Critical success factors for market players
- 2.4 Future outlook and strategic recommendations
Chapter 3 Industry Insights
- 3.1 Industry ecosystem analysis
- 3.1.1 Supplier landscape
- 3.1.2 Profit margin
- 3.1.3 Value addition at each stage
- 3.1.4 Factor affecting the value chain
- 3.2 Industry impact forces
- 3.2.1 Growth drivers
- 3.2.1.1 Digitalization in education sector
- 3.2.1.2 Growing disposable income
- 3.2.1.3 Rise of online marketplaces
- 3.2.2 Industry pitfalls & challenges
- 3.2.2.1 Availability of alternative screen projection options and installed projectors
- 3.2.2.2 Brightness and image quality limitations
- 3.2.3 Opportunities
- 3.2.3.1 Rising demand across home entertainment & hybrid work
- 3.2.3.2 Integration of smart / IoT & AI-driven capabilities
- 3.2.1 Growth drivers
- 3.3 Growth potential analysis
- 3.4 Future market trends
- 3.5 Technology and innovation landscape
- 3.5.1 Current technological trends
- 3.5.2 Emerging technologies
- 3.6 Price trends
- 3.6.1 By type
- 3.6.2 By region
- 3.7 Regulatory landscape
- 3.7.1 North America
- 3.7.1.1 US: Consumer Product Safety Commission (CPSC) 16 Code of Federal Regulations (CFR) part 1512
- 3.7.1.2 Canada: International Organization for Standardization (ISO) 4210
- 3.7.2 Europe
- 3.7.2.1 Germany: Deutsches Institut fur Normung (DIN) European Norm (EN) ISO 4210
- 3.7.2.2 UK: European Norm (EN) ISO 4210 / United Kingdom Conformity Assessed (UKCA)
- 3.7.2.3 France: European Norm (EN) ISO 4210
- 3.7.3 Asia Pacific
- 3.7.3.1 China: Guobiao (GB) 3565
- 3.7.3.2 India: Indian Standard (IS) 10613
- 3.7.3.3 Japan: Japanese Industrial Standard (JIS) D 9110
- 3.7.4 Latin America
- 3.7.4.1 Brazil: Associacao Brasileira de Normas Tecnicas (ABNT) Norma Brasileira (NBR) ISO 4210
- 3.7.4.2 Mexico: International Organization for Standardization (ISO) 4210
- 3.7.5 Middle East & Africa
- 3.7.5.1 South Africa: South African National Standard (SANS) 311
- 3.7.5.2 Saudi Arabia: Saudi Standards, Metrology and Quality Organization (SASO) Gulf Standardization Organization (GSO) ISO 4210
- 3.7.1 North America
- 3.8 Trade data analysis
- 3.8.1 Import/export volume & value trends
- 3.8.2 Key trade corridors & tariff impact
- 3.9 Impact of AI & generative AI on the market
- 3.9.1 AI-driven disruption of existing business models
- 3.9.2 Genai use cases & adoption roadmap by segment
- 3.9.3 Risks, limitations & regulatory considerations
- 3.10 Porter's analysis
- 3.11 PESTEL analysis
- 3.12 Consumer behaviour analysis
- 3.12.1 Purchasing patterns
- 3.12.2 Preference analysis
- 3.12.3 Regional variations in consumer behaviour
- 3.12.4 Impact of e-commerce on buying decisions
Chapter 4 Competitive Landscape, 2025
- 4.1 Introduction
- 4.2 Company market share analysis
- 4.2.1 By region
- 4.2.1.1 North America
- 4.2.1.2 Europe
- 4.2.1.3 Asia Pacific
- 4.2.1.4 Latin America
- 4.2.1.5 Middle East and Africa
- 4.2.1 By region
- 4.3 Company matrix analysis
- 4.4 Competitive analysis of major market players
- 4.5 Competitive positioning matrix
- 4.6 Key developments
- 4.6.1 Mergers & acquisitions
- 4.6.2 Partnerships & collaborations
- 4.6.3 New product launches
- 4.6.4 Expansion plans
Chapter 5 Market Estimates & Forecast, By Technology, 2022 - 2035, (USD Billion) (Thousand Units)
- 5.1 Key trends
- 5.2 Digital light processing (DLP)
- 5.3 Liquid crystal display (LCD)
- 5.4 Liquid crystal on silicon (Locos)
- 5.5 Others
Chapter 6 Market Estimates & Forecast, By Projector Screen Size, 2022 - 2035, (USD Billion) (Thousand Units)
- 6.1 Key trends
- 6.2 Below 50 Inches
- 6.3 50 - 200 Inches
- 6.4 Above 200 Inches
Chapter 7 Market Estimates & Forecast, By Connectivity, 2022 - 2035, (USD Billion) (Thousand Units)
- 7.1 Key trends
- 7.2 Wired
- 7.3 Wireless
Chapter 8 Market Estimates & Forecast, By End Use, 2022 - 2035, (USD Billion) (Thousand Units)
- 8.1 Key trends
- 8.2 Home entertainment
- 8.3 Educational institutions
- 8.4 Business professionals
- 8.5 Gaming
- 8.6 Event organizers
- 8.7 Media production / content house
- 8.8 Others (lounges, clubs, sports center etc.)
Chapter 9 Market Estimates & Forecast, By Distribution Channel, 2022 - 2035, (USD Billion) (Thousand Units)
- 9.1 Key trends
- 9.2 Online
- 9.2.1 E-Commerce
- 9.2.2 Company websites
- 9.3 Offline
- 9.3.1 Specialty stores
- 9.3.2 Mega retail stores
- 9.3.3 Others
Chapter 10 Market Estimates & Forecast, By Region, 2022-2035 (USD Billion) (Thousand Units)
- 10.1 Key trends
- 10.2 North America
- 10.2.1 U.S.
- 10.2.2 Canada
- 10.3 Europe
- 10.3.1 Germany
- 10.3.2 France
- 10.3.3 UK
- 10.3.4 Italy
- 10.3.5 Spain
- 10.4 Asia Pacific
- 10.4.1 China
- 10.4.2 India
- 10.4.3 Japan
- 10.4.4 South Korea
- 10.4.5 Australia
- 10.5 Latin America
- 10.5.1 Brazil
- 10.5.2 Mexico
- 10.5.3 Argentina
- 10.6 MEA
- 10.6.1 South Africa
- 10.6.2 Saudi Arabia
- 10.6.3 UAE
Chapter 11 Company Profiles
- 11.1 AAXA Technologies
- 11.2 Acer
- 11.3 Anker (Nebula)
- 11.4 ASUS
- 11.5 BenQ
- 11.6 Epson America
- 11.7 JMGO
- 11.8 LG Electronics
- 11.9 Optoma
- 11.10 Philips
- 11.11 Samsung
- 11.12 Sony
- 11.13 ViewSonic
- 11.14 Xiaomi
- 11.15 XGIMI
 可攜式投影機市場:按解析度、光源、連接方式、攜帶式類型、應用、最終用戶和分銷管道分類-2026-2032年全球市場預測
 可攜式投影機市場分析及預測(至2035年):類型、產品、技術、組件、應用、外形尺寸、設備、最終用戶、安裝方式、模式
 攜帶式投影機市場 - 全球產業規模、佔有率、趨勢、機會及預測(按產品類型、連接方式、銷售管道、地區和競爭格局分類,2021-2031年)
 可攜式投影機市場規模、佔有率和成長分析(按分銷管道、技術、尺寸、流明、解析度、投影影像尺寸、應用和地區分類)—2026-2033年行業預測
 可攜式投影機市場:按技術、尺寸、流明、解析度、投影影像尺寸、應用、地區分類 - 到 2029 年的預測