


 |
市場調查報告書
商品編碼
1998768
2026 年至 2035 年電動商用車的市場機會、成長要素、產業趨勢分析與預測。Electric Commercial Vehicle Market Opportunity, Growth Drivers, Industry Trend Analysis, and Forecast 2026 - 2035 |
||||||
預計到 2025 年,全球電動商用車市場規模將達到 842 億美元,並預計以 10.1% 的複合年成長率成長,到 2035 年達到 2,220 億美元。
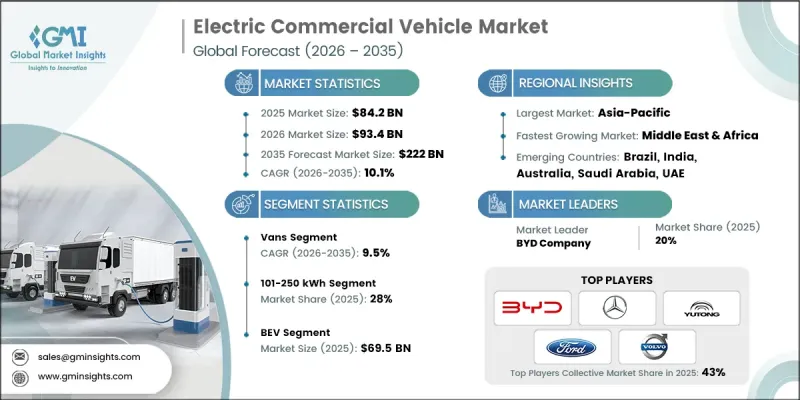
這一強勁成長得益於車輛電氣化進程的加速、電池成本的下降、日益嚴格的排放氣體法規以及政府大力支持零排放交通的獎勵措施。電動商用車(ECV)因其整體擁有成本更低、維護需求更少以及零排放等優勢,正日益被物流、公共交通、市政服務和工業領域所採用。電池能量密度、電力電子技術和快速充電基礎設施的進步顯著提升了車輛的續航里程、有效載荷能力和運營效率,使電動商用車在都市區和鄉村應用中都更加實用化。此外,企業永續發展要求和ESG合規目標正促使車主逐步淘汰柴油車,進一步推動了市場的長期成長。
| 市場範圍 | |
|---|---|
| 開始年份 | 2025 |
| 預測期 | 2026-2035 |
| 上市時的市場規模 | 842億美元 |
| 預計金額 | 2220億美元 |
| 複合年成長率 | 10.1% |
預計到2025年,廂型車市佔率將達到37%,並在2026年至2035年間以9.5%的複合年成長率成長。電動廂型車因其車身緊湊、操控靈活、能夠高效應對堵塞路況等優勢,正日益受到關注,成為都市區營運的理想解決方案。隨著電子商務和當日達服務需求的不斷成長,物流和配送公司也越來越青睞電動廂型車。與柴油廂型車相比,電動廂型車的燃料和維護成本更低,為企業帶來長期的成本節約和營運效率的提升。
到2025年,101-250kWh電池組的市佔率將達到28%,預計2026年至2035年將以8.2%的複合年成長率成長。此容量範圍內的中檔電池能夠實現高效的電力消耗和更快的充電速度,無論是在家中或公共快充站都能快速充電。這些電池與大多數現有的充電基礎設施相容,能夠快速為電動商用車充電,同時確保日常營運的最佳便利性和性能。
預計2025年,中國電動商用車市場規模將達375億美元。由於國產商用車具有成本效益,中國電動車產業正快速發展。中國對電動車供應鏈擁有強大的控制力,電池生產和原料採購都在國內完成。這種垂直整合降低了生產成本,減少了對海外供應商的依賴,使中國電動商用車在全球範圍內極具競爭力。此外,不同地區的製造商正在拓展企業發展在不同市場的細分電動商用車業務,進一步推動市場成長。
目錄
第1章:調查方法和範圍
第2章執行摘要
第3章業界考察
- 生態系分析
- 供應商情況
- 電池製造商
- 零件供應商
- OEM(原始設備製造商)
- 銷售代理商/經銷商
- 5 個最終用戶
- 成本結構
- 利潤率
- 每個階段增加的價值
- 垂直整合趨勢
- 顛覆者
- 供應商情況
- 影響因素
- 促進因素
- 嚴格執行排放法規
- 電子商務和最後一公里需求的成長
- 公司車輛強制電氣化
- 改善都市區空氣品質的努力
- 產業潛在風險與挑戰
- 充電基礎設施發展不足
- 原料和電池供不應求
- 市場機遇
- 引入高功率快速充電
- 降低電池成本的進展
- 可擴展模組化汽車平臺
- V2G和儲能整合
- 促進因素
- 技術趨勢與創新生態系統
- 目前技術
- 新興技術
- 成長潛力分析
- 監理情勢
- 北美洲
- 美國聯邦機動車安全標準
- 加拿大電動車安全法規
- 歐洲
- 聯合國歐洲經濟委員會規章
- 歐盟電動車標籤法規
- 亞太地區
- AIS-142(印度汽車工業標準)
- 中國 GB
- 拉丁美洲
- ABNT NBR
- NOM-116-SCFI-2016
- 中東和非洲
- SASO 2888/2018
- SANS 1737
- 北美洲
- 波特五力分析
- PESTEL 分析
- 專利分析(基於初步研究)
- 價格分析(基於初步調查)
- 對過去價格趨勢的分析
- 按玩家類型分類的定價策略
- 貿易統計(基於付費資料庫)
- 生產基地
- 消費中心
- 進出口
- 永續性和環境方面
- 永續計劃
- 減少廢棄物策略
- 生產中的能源效率
- 具有環保意識的舉措
- 碳足跡考量
- 人工智慧和生成式人工智慧對市場的影響
- 利用人工智慧改造現有經營模式
- 預測性維護和營運最佳化
- 自動化設計最佳化
- 用於需求預測的供應鏈人工智慧
- GenAI 各細分市場的應用案例與部署藍圖
- 胎面花紋設計與生成
- 客戶服務聊天機器人和技術支援
- 行銷內容創作
- 風險、限制和監管考量
- 物聯網智慧產品中的資料隱私
- 人工智慧演算法的透明度要求
- 人工智慧驅動的產品故障責任
- 利用人工智慧改造現有經營模式
- 預測假設和情境分析(基於初步研究)
- 基本案例-驅動複合年成長率的關鍵宏觀經濟與產業變量
- 樂觀情境-有利的宏觀經濟和產業利好因素
- 悲觀情景-宏觀經濟放緩或產業逆風
第4章 競爭情勢
- 介紹
- 企業市佔率分析
- 北美洲
- 歐洲
- 亞太地區
- 拉丁美洲
- 中東和非洲
- 主要市場公司的競爭分析
- 競爭定位矩陣
- 企業級分層基準測試
- 層級分類標準與選擇標準
- 按銷售額、地區和創新能力分類的層級定位矩陣。
- 主要進展
- 併購
- 夥伴關係和聯盟
- 新產品發布
- 業務拓展計劃及資金籌措
第5章 市場估價與預測:依車輛類型分類,2022-2035年
- 皮卡車
- 小型電動皮卡
- 大型和小型電動皮卡
- 範
- 緊湊型電動貨車
- 中型電動貨車
- 全尺寸電動貨車
- 追蹤
- 中型電動卡車
- 大型電動卡車
- 巴士和長途汽車
- 電動巴士
- 電動長途巴士
- 電動校車
第6章 市場估價與預測:依電池容量分類,2022-2035年
- 小於100度
- 101~250 kWh
- 251~400 kWh
- 401~550 kWh
- 超過550度
第7章 市場估計與預測:依促進因素分類,2022-2035年
- 電池式電動車(BEV)
- 燃料電池電動車(FCEV)
- 插電式混合動力汽車(PHEV)
第8章 市場估計與預測:依應用領域分類,2022-2035年
- 最後一公里配送
- 現場服務
- 配送服務
- 長途
- 其他
第9章 市場估計與預測:依地區分類,2022-2035年
- 北美洲
- 美國
- 加拿大
- 歐洲
- 英國
- 德國
- 法國
- 義大利
- 西班牙
- 比利時
- 荷蘭
- 瑞典
- 俄羅斯
- 亞太地區
- 中國
- 印度
- 日本
- 澳洲
- 新加坡
- 韓國
- 越南
- 印尼
- 拉丁美洲
- 巴西
- 墨西哥
- 阿根廷
- 中東和非洲(MEA)
- 南非
- 沙烏地阿拉伯
- 阿拉伯聯合大公國
第10章:公司簡介
- 世界公司
- BYD Company
- Mercedes-Benz
- Volvo
- Tesla
- Yutong Bus
- Ford Motor Company
- Scania
- Daimler Truck
- PACCAR
- 本地球員
- Tata Motors
- Dongfeng Motor
- Renault Trucks
- Proterra
- Arrival
- VinFast Auto
- Lion Electric
- 新興企業
- Rivian Automotive
- Nikola
- Workhorse
- VDL Groep
The Global Electric Commercial Vehicle Market was valued at USD 84.2 billion in 2025 and is estimated to grow at a CAGR of 10.1% to reach USD 222 billion by 2035.
The robust growth is driven by accelerating fleet electrification, declining battery costs, stringent emission regulations, and strong government incentives supporting zero-emission transportation. Electric commercial vehicles (ECVs) are increasingly adopted across logistics, public transportation, municipal services, and industrial operations due to their lower total cost of ownership, reduced maintenance requirements, and zero tailpipe emissions. Advancements in battery energy density, power electronics, and fast-charging infrastructure are significantly improving vehicle range, payload capacity, and operational efficiency, making electric commercial vehicles viable across both urban and regional applications. In addition, corporate sustainability mandates and ESG compliance goals are compelling fleet operators to transition away from diesel-powered vehicles, further reinforcing long-term market growth.
| Market Scope | |
|---|---|
| Start Year | 2025 |
| Forecast Year | 2026-2035 |
| Start Value | $84.2 Billion |
| Forecast Value | $222 Billion |
| CAGR | 10.1% |
The vans segment held 37% share in 2025 and is estimated to grow at a CAGR of 9.5% from 2026 to 2035. Electric vans are increasingly seen as ideal solutions for urban operations due to their compact size, high maneuverability, and ability to navigate congested streets efficiently. Logistics and delivery companies favor electric vans because of the rising demand for e-commerce and same-day delivery services. Compared to diesel vans, electric vans offer lower fuel and maintenance costs, providing operators with long-term cost savings and improved operational efficiency.
The 101-250 kWh battery segment held a 28% share in 2025 and is expected to grow at a CAGR of 8.2% from 2026 to 2035. Mid-sized batteries in this range deliver efficient power consumption and faster charging, whether at home or at public fast-charging stations. These batteries are compatible with most existing charging infrastructure, allowing electric commercial vehicles to recharge quickly while ensuring optimal usability and performance for daily operations.
China Electric Commercial Vehicle Market reached USD 37.5 billion in 2025. The country's EV industry is rapidly growing due to the cost-effectiveness of locally produced commercial vehicles. China maintains strong control over its EV supply chain, producing batteries and sourcing raw materials domestically. This vertical integration lowers production costs and reduces reliance on international suppliers, making Chinese electric commercial vehicles highly competitive globally. Regional manufacturers are also expanding their footprint in niche electric commercial vehicle segments across different markets, driving further growth.
Key players operating in the Global Electric Commercial Vehicle Market include AB Volvo, BYD, Daimler Truck Holding AG, Ford Motor Company, Hyundai Motor Company, Tesla Inc., PACCAR Inc., Rivian Automotive, Traton SE, Zhengzhou Yutong Bus Co., Ltd., Tata Motors, Ashok Leyland, and NFI Group, among others. Companies in the Electric Commercial Vehicle Market are strengthening their market presence through a combination of product innovation, strategic partnerships, and capacity expansion. Leading manufacturers are investing heavily in advanced battery technologies, modular electric platforms, and ultra-fast charging capabilities to enhance vehicle performance and reduce total ownership costs. Partnerships with battery suppliers, charging infrastructure providers, and logistics operators enable faster commercialization and large-scale fleet deployments. Many players are expanding regional manufacturing facilities to localize production, reduce costs, and comply with government localization policies.
Table of Contents
Chapter 1 Methodology & Scope
- 1.1 Research approach
- 1.2 Quality Commitments
- 1.2.1 GMI AI policy & data integrity commitment
- 1.2.1.1 Source consistency protocol
- 1.2.1 GMI AI policy & data integrity commitment
- 1.3 Research Trail & Confidence Scoring
- 1.3.1 Research Trail Components
- 1.3.2 Scoring Components
- 1.4 Data Collection
- 1.4.1 Partial list of primary sources
- 1.5 Data mining sources
- 1.5.1 Paid sources
- 1.5.1.1 Sources, by region
- 1.5.1 Paid sources
- 1.6 Base estimates and calculations
- 1.6.1 Base year calculation for any one approach
- 1.7 Forecast
- 1.7.1 Quantified market impact analysis
- 1.7.1.1 Mathematical impact of growth parameters on forecast
- 1.7.1 Quantified market impact analysis
- 1.8 Research transparency addendum
- 1.8.1 Source attribution framework
- 1.8.2 Quality assurance metrics
- 1.8.3 Our commitment to trust
Chapter 2 Executive Summary
- 2.1 Industry 360° synopsis
- 2.2 Key market trends
- 2.2.1 Regional
- 2.2.2 Vehicle
- 2.2.3 Battery capacity
- 2.2.4 Propulsion
- 2.2.5 Application
- 2.3 TAM Analysis, 2026-2035
- 2.4 CXO perspectives: Strategic imperatives
Chapter 3 Industry Insights
- 3.1 Industry ecosystem analysis
- 3.1.1 Supplier landscape
- 3.1.1.1 Battery Manufacturer
- 3.1.1.2 Component Supplier
- 3.1.1.3 OEM (Original Equipment Manufacturer)
- 3.1.1.4 Distributor / Dealer
- 3.1.1. 5 End user
- 3.1.2 Cost structure
- 3.1.3 Profit margin
- 3.1.4 Value addition at each stage
- 3.1.5 Vertical integration trends
- 3.1.6 Disruptors
- 3.1.1 Supplier landscape
- 3.2 Impact on forces
- 3.2.1 Growth drivers
- 3.2.1.1 Strict emission regulations enforcement
- 3.2.1.2 E-commerce and last-mile demand growth
- 3.2.1.3 Corporate fleet electrification mandates
- 3.2.1.4 Urban air quality improvement initiatives
- 3.2.2 Industry pitfalls & challenges
- 3.2.2.1 Insufficient charging infrastructure coverage
- 3.2.2.2 Raw material and battery shortages
- 3.2.3 Market opportunities
- 3.2.3.1 High-power fast charging deployment
- 3.2.3.2 Battery cost reduction advances
- 3.2.3.3 Scalable modular vehicle platforms
- 3.2.3.4 V2G and energy storage integration
- 3.2.1 Growth drivers
- 3.3 Technology trends & innovation ecosystem
- 3.3.1 Current technologies
- 3.3.2 Emerging technologies
- 3.4 Growth potential analysis
- 3.5 Regulatory landscape
- 3.5.1 North America
- 3.5.1.1 U.S. Federal Motor Vehicle Safety Standards
- 3.5.1.2 Canadian Electric Vehicle Safety Regulations
- 3.5.2 Europe
- 3.5.2.1 UNECE Regulation
- 3.5.2.2 EU EV Labelling Regulation
- 3.5.3 Asia-Pacific
- 3.5.3.1 AIS-142 (Automotive Industry Standard, India)
- 3.5.3.2 China GB
- 3.5.4 Latin America
- 3.5.4.1 ABNT NBR
- 3.5.4.2 NOM-116-SCFI-2016
- 3.5.5 Middle East & Africa
- 3.5.5.1 SASO 2888/2018
- 3.5.5.2 SANS 1737
- 3.5.1 North America
- 3.6 Porter's analysis
- 3.7 PESTEL analysis
- 3.8 Patent analysis (Driven by Primary Research)
- 3.9 Pricing Analysis (Driven by Primary Research)
- 3.9.1 Historical Price Trend Analysis
- 3.9.2 Pricing Strategy by Player Type
- 3.10 Trade statistics (Driven by Paid Database)
- 3.10.1 Production hubs
- 3.10.2 Consumption hubs
- 3.10.3 Export and import
- 3.11 Sustainability and environmental aspects
- 3.11.1 Sustainable practices
- 3.11.2 Waste reduction strategies
- 3.11.3 Energy efficiency in production
- 3.11.4 Eco-friendly initiatives
- 3.11.5 Carbon footprint considerations
- 3.12 Impact of AI & generative AI on the market
- 3.12.1 AI-driven disruption of existing business models
- 3.12.1.1 Predictive Maintenance & Operations Optimization
- 3.12.1.2 Automated design optimization
- 3.12.1.3 Supply chain AI for demand forecasting
- 3.12.1.4 GenAI use cases & adoption roadmap by segment
- 3.12.1.4.1 Tread pattern design generation
- 3.12.1.4.2 Customer service chatbots & technical support
- 3.12.1.4.3 Marketing content creation
- 3.12.1.4.4 Risks, limitations & regulatory considerations
- 3.12.1.4.4.1 Data privacy in IoT-enabled smart products
- 3.12.1.4.4.2 AI algorithm transparency requirements
- 3.12.1.4.4.3 Liability in AI-driven product failures
- 3.12.1 AI-driven disruption of existing business models
- 3.13 Forecast assumptions & scenario analysis (Driven by Primary Research)
- 3.13.1 Base Case - key macro & industry variables driving CAGR
- 3.13.2 Optimistic Scenarios - Favorable Macro and Industry Tailwinds
- 3.13.3 Pessimistic Scenario - Macroeconomic slowdown or industry headwinds
Chapter 4 Competitive Landscape, 2025
- 4.1 Introduction
- 4.2 Company market share analysis
- 4.2.1 North America
- 4.2.2 Europe
- 4.2.3 Asia-Pacific
- 4.2.4 Latin America
- 4.2.5 Middle East & Africa
- 4.3 Competitive analysis of major market players
- 4.4 Competitive positioning matrix
- 4.5 Company Tier Benchmarking
- 4.5.1 Tier Classification Criteria & Qualifying Thresholds
- 4.5.2 Tier Positioning Matrix by Revenue, Geography & Innovation
- 4.6 Key developments
- 4.6.1 Mergers & acquisitions
- 4.6.2 Partnerships & collaborations
- 4.6.3 New product launches
- 4.6.4 Expansion plans and funding
Chapter 5 Market Estimates & Forecast, By Vehicle, 2022 - 2035 ($ Bn, Units)
- 5.1 Key trends
- 5.2 Pickup Trucks
- 5.2.1 Light-Duty Electric Pickups
- 5.2.2 Heavy Light-Duty Electric Pickups
- 5.3 Vans
- 5.3.1 Compact Electric Vans
- 5.3.2 Mid-Size Electric Vans
- 5.3.3 Full-Size Electric Vans
- 5.4 Trucks
- 5.4.1 Medium-Duty Electric Trucks
- 5.4.2 Heavy-Duty Electric Trucks
- 5.5 Buses & Coaches
- 5.5.1 Electric Transit Buses
- 5.5.2 Electric Intercity Coaches
- 5.5.3 Electric School Buses
Chapter 6 Market Estimates & Forecast, By Battery Capacity, 2022 - 2035 ($ Bn, Units)
- 6.1 Key trends
- 6.2 Less than 100 kWh
- 6.3 101-250 kWh
- 6.4 251-400 kWh
- 6.5 401-550 kWh
- 6.6 More than 550 kWh
Chapter 7 Market Estimates & Forecast, By Propulsion, 2022 - 2035 ($ Bn, Units)
- 7.1 Key trends
- 7.2 Battery Electric Vehicle (BEV)
- 7.3 Fuel Cell Electric Vehicle (FCEV)
- 7.4 Plug-in Hybrid Electric Vehicle (PHEV)
Chapter 8 Market Estimates & Forecast, By Application, 2022 - 2035 ($ Bn, Units)
- 8.1 Key trends
- 8.2 Last-Mile Delivery
- 8.3 Field Services
- 8.4 Distribution Services
- 8.5 Long-Haul Transportation
- 8.6 Others
Chapter 9 Market Estimates & Forecast, By Region, 2022 - 2035 ($ Bn, Units)
- 9.1 North America
- 9.1.1 US
- 9.1.2 Canada
- 9.2 Europe
- 9.2.1 UK
- 9.2.2 Germany
- 9.2.3 France
- 9.2.4 Italy
- 9.2.5 Spain
- 9.2.6 Belgium
- 9.2.7 Netherlands
- 9.2.8 Sweden
- 9.2.9 Russia
- 9.3 Asia Pacific
- 9.3.1 China
- 9.3.2 India
- 9.3.3 Japan
- 9.3.4 Australia
- 9.3.5 Singapore
- 9.3.6 South Korea
- 9.3.7 Vietnam
- 9.3.8 Indonesia
- 9.4 Latin America
- 9.4.1 Brazil
- 9.4.2 Mexico
- 9.4.3 Argentina
- 9.5 MEA
- 9.5.1 South Africa
- 9.5.2 Saudi Arabia
- 9.5.3 UAE
Chapter 10 Company Profiles
- 10.1 Global players
- 10.1.1 BYD Company
- 10.1.2 Mercedes-Benz
- 10.1.3 Volvo
- 10.1.4 Tesla
- 10.1.5 Yutong Bus
- 10.1.6 Ford Motor Company
- 10.1.7 Scania
- 10.1.8 Daimler Truck
- 10.1.9 PACCAR
- 10.2 Regional players
- 10.2.1 Tata Motors
- 10.2.2 Dongfeng Motor
- 10.2.3 Renault Trucks
- 10.2.4 Proterra
- 10.2.5 Arrival
- 10.2.6 VinFast Auto
- 10.2.7 Lion Electric
- 10.3 Emerging players
- 10.3.1 Rivian Automotive
- 10.3.2 Nikola
- 10.3.3 Workhorse
- 10.3.4 VDL Groep
 電動商用車市場-2026-2032年全球市場預測
 商用電動車市場預測至2034年-全球分析(按車輛類型、驅動系統、電池類型、電池容量、續航里程、充電方式、最終用戶和地區分類)
 全球商用電動車市場:按車輛類型、推進系統、電池類型、功率輸出、續航里程、最終用途、組件、電池容量和地區分類-預測至2033年
 工業電動車市場分析與預測(至2035年):按類型、產品、服務、技術、組件、應用、最終用戶、功能、安裝方式和解決方案分類電動商用車市場分析及預測(至2035年):類型、產品、服務、技術、組件、應用、部署、最終用戶、功能、安裝配置
 電動商用車市場規模、佔有率和趨勢分析報告:按車輛類型、推進系統、驅動系統、車速、地區和細分市場預測(2026-2033 年)
 2026-2030年全球電動商用車(ECV)市場
 2026年全球中重型商用電動車市場報告2026年全球商用電動車市場報告
 全球電動商用車MRO市場規模、佔有率、趨勢與成長分析報告(2026-2034年)