


 |
市場調查報告書
商品編碼
1998764
骨質疏鬆症治療市場:市場機會、成長要素、產業趨勢分析及2026-2035年預測Osteoporosis Drugs Market Opportunity, Growth Drivers, Industry Trend Analysis, and Forecast 2026 - 2035 |
||||||
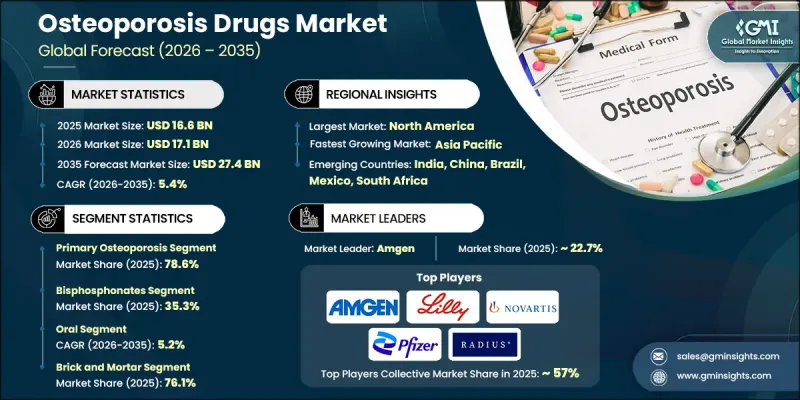
2025 年全球骨質疏鬆症治療市場價值 166 億美元,預計到 2035 年將以 5.4% 的複合年成長率成長至 274 億美元。
骨質疏鬆症治療市場的成長與人口結構變化密切相關,尤其是全球老年人口的持續成長。隨著老齡化,骨骼強度逐漸下降,骨折和骨骼相關併發症的風險顯著增加。旨在控制骨質疏鬆症的藥物治療在維持骨骼密度和最大限度降低骨折風險方面發揮著至關重要的作用。這些藥物透過減緩骨骼分解過程或促進新骨形成來發揮作用,幫助患者長期維持骨骼強度。病人和醫護人員對骨質疏鬆症的認知不斷提高,也促進了診斷率的提升,尤其是在醫療體係日益重視骨質疏鬆症早期檢測方面。診斷篩檢技術的廣泛應用有助於更早啟動治療,並增加參與長期治療計畫的患者人數。此外,旨在支持患者監測和治療依從性的數位健康工具正逐漸成為骨質疏鬆症常規管理的一部分。這些技術有助於改善治療效果,並幫助醫護人員追蹤長期治療的有效性。
| 市場範圍 | |
|---|---|
| 開始年份 | 2025 |
| 預測期 | 2026-2035 |
| 上市時的市場規模 | 166億美元 |
| 預測金額 | 274億美元 |
| 複合年成長率 | 5.4% |
預計到2025年,骨質疏鬆症主要細分市場將佔據78.6%的市場佔有率,到2035年市場規模將達到220億美元,年複合成長率(CAGR)為5.6%。由於骨骼密度老齡化成長而下降是全球骨質疏鬆症病例的主要原因,因此該細分市場需求強勁。隨著許多國家預期壽命的延長,面臨骨骼劣化風險的人數持續成長。這種人口趨勢導致人們對長期藥物干預以維持骨骼健康的需求不斷增加。此外,診斷篩檢技術的普及使醫療專業人員能夠及早發現骨質流失,並在出現嚴重併發症之前啟動治療。早期發現疾病有助於更積極主動地進行疾病管理,從而導致接受骨質疏鬆症治療的患者總數增加。
預計到2025年,口服藥物市場規模將達到91億美元,並在2026年至2035年間以5.2%的複合年成長率成長。口服製劑因其服用方便、易於透過多種醫療管道分銷而廣泛使用。已開發國家和開發中國家醫療體系的供應確保了市場需求的穩定和持續。由於口服骨質疏鬆症藥物在維持骨骼健康和降低骨折相關併發症發生率方面具有確切的療效,醫療專業人員仍繼續開立此類藥物。豐富的臨床經驗增強了醫生對這些治療方法的信心,並促進了其在全球的普及。
預計到2025年,美國骨質疏鬆症治療市場規模將達57億美元。骨質疏鬆症相關疾病在北美老齡化人口中仍然普遍存在,導致長期藥物治療的需求日益成長。預期壽命的延長使得需要持續進行骨骼健康管理的患者人數不斷增加。加強宣傳活動和醫生主導的篩檢計畫也有助於提高早期發現率並推廣預防性治療方法。此外,先進的醫療基礎設施和完善的診斷技術也持續全部區域有效的疾病管理提供支援。
目錄
第1章:調查方法
- 研究途徑
- 品質改進計劃
- GMI人工智慧政策和資料完整性計劃
- 資訊來源一致性通訊協定
- GMI人工智慧政策和資料完整性計劃
- 調查過程和可靠性評分
- 調查過程的組成部分
- 評分組成部分
- 數據收集
- 主要來源部分列表
- 資料探勘資訊來源
- 付費資訊來源
- 區域資訊來源
- 付費資訊來源
- 基本估算和計算方法
- 每種方法中基準年的計算
- 預測模型
- 量化市場影響分析
- 生長參數對預測的數學影響
- 量化市場影響分析
- 關於調查透明度的補充信息
- 資訊來源歸屬框架
- 品質保證指標
- 對信任的承諾
第2章執行摘要
第3章業界考察
- 生態系分析
- 影響產業的因素
- 促進因素
- 骨質疏鬆症盛行率增加
- 藥物研發中的技術進步
- 骨折發生率增加
- 生物製藥和新型治療方法的應用日益廣泛
- 產業潛在風險與挑戰
- 高昂的醫療費用
- 副作用和安全問題
- 市場機遇
- 下一代合成代謝藥物的研發
- 生物相似藥和生技改良藥的出現
- 促進因素
- 成長潛力分析
- 監理情勢
- 北美洲
- 歐洲
- 亞太地區
- 科技趨勢
- 當前技術趨勢
- 新興技術
- 救贖方案
- 未來市場趨勢
- 管道分析
- 價值鏈分析
- 人工智慧和生成式人工智慧對市場的影響
- 波特五力分析
- PESTEL 分析
- Start-Ups場景
- 差距分析
第4章 競爭情勢
- 介紹
- 企業矩陣分析
- 企業市佔率分析
- 世界
- 北美洲
- 歐洲
- 亞太地區
- 競爭定位矩陣
- 主要市場公司的競爭分析
- 主要進展
- 併購
- 夥伴關係與合作
- 新產品發布
- 業務拓展計劃
第5章 市場估計與預測:依類型分類,2022-2035年
- 原發性骨質疏鬆症
- 停經後骨質疏鬆症
- 老年性骨質疏鬆症
- 特發性骨質疏鬆症
- 續發性骨質疏鬆症
第6章 市場估計與預測:依藥物類別分類,2022-2035年
- 雙磷酸鹽
- RANK配體抑制劑
- 副甲狀腺素類似物
- 荷爾蒙補充療法(HRT)
- 選擇性雌激素受體調節(SERMs)
- 其他藥物分類
第7章 市場估計與預測:依給藥途徑分類,2022-2035年
- 口服
- 注射藥物
- 其他給藥途徑
第8章 市場估算與預測:依通路分類,2022-2035年
- 店鋪
- 電子商務
第9章 市場估計與預測:依地區分類,2022-2035年
- 北美洲
- 美國
- 加拿大
- 歐洲
- 德國
- 英國
- 法國
- 西班牙
- 義大利
- 荷蘭
- 亞太地區
- 中國
- 日本
- 印度
- 澳洲
- 韓國
- 拉丁美洲
- 巴西
- 墨西哥
- 阿根廷
- 中東和非洲
- 南非
- 沙烏地阿拉伯
- 阿拉伯聯合大公國
第10章:公司簡介
- Amgen
- Apotex
- DAIICHI SANKYO COMPANY
- Dr. Reddy's Laboratories
- Eisai
- Eli Lilly and Company
- Merck &Co.
- Mylan
- Novartis
- Pfizer
- Radius Health
- Roche
- Sanofi
- Sun Pharmaceutical Industries
- Teva Pharmaceutical Industries
The Global Osteoporosis Drugs Market was valued at USD 16.6 billion in 2025 and is estimated to grow at a CAGR of 5.4% to reach USD 27.4 billion by 2035.
The growth of the osteoporosis drugs market is closely associated with demographic changes, particularly the steady expansion of the elderly population worldwide. As individuals age, bone strength gradually declines, which significantly increases the risk of fractures and bone-related complications. Pharmaceutical therapies designed to manage osteoporosis play an essential role in preserving bone density and minimizing fracture risk. These medications function by slowing the process of bone degradation or by stimulating new bone formation, helping patients maintain skeletal strength over time. Increased awareness among patients and healthcare providers has also contributed to improved diagnosis rates, particularly as healthcare systems emphasize early detection of bone loss conditions. The growing use of diagnostic screening technologies is encouraging earlier treatment initiation and expanding the number of patients entering long-term therapy programs. In addition, digital health tools designed to support patient monitoring and treatment adherence are gradually becoming part of routine osteoporosis management. These technologies contribute to better therapeutic outcomes and help healthcare providers track long-term treatment effectiveness.
| Market Scope | |
|---|---|
| Start Year | 2025 |
| Forecast Year | 2026-2035 |
| Start Value | $16.6 Billion |
| Forecast Value | $27.4 Billion |
| CAGR | 5.4% |
The primary osteoporosis segment held 78.6% share in 2025 and is expected to reach USD 22 billion by 2035 while growing at a CAGR of 5.6%. This segment maintains strong demand because bone density loss associated with aging represents the largest source of osteoporosis cases globally. As life expectancy increases across many countries, the number of individuals vulnerable to bone deterioration continues to grow. This demographic trend is generating sustained demand for long-term pharmaceutical interventions designed to preserve bone health. Expanding use of diagnostic screening technologies is also enabling healthcare professionals to detect bone loss at earlier stages, allowing treatment to begin before severe complications occur. Earlier identification of the condition is encouraging more proactive disease management and increasing the overall patient population receiving osteoporosis therapies.
The oral segment generated USD 9.1 billion in 2025 and is projected to grow at a CAGR of 5.2% throughout 2026-2035. Oral drug formulations remain widely used because they are convenient for patients and easily distributed through multiple healthcare channels. Their accessibility across both developed and developing healthcare systems ensures stable and consistent market demand. Healthcare professionals continue to prescribe oral osteoporosis medications due to their well-established therapeutic effectiveness in supporting bone health and lowering the likelihood of fracture-related complications. The extensive clinical history associated with oral treatments has strengthened physician confidence in these therapies and contributed to their continued adoption worldwide.
U.S. Osteoporosis Drugs Market reached USD 5.7 billion in 2025. Osteoporosis-related conditions remain common among the aging population in North America, contributing to the growing need for long-term pharmaceutical treatment. Rising life expectancy is expanding the number of patients who require continued management of bone health conditions. Increased awareness initiatives and physician-led screening programs have also improved early detection and encouraged the use of preventive treatment options. In addition, advanced healthcare infrastructure and strong availability of diagnostic technologies continue to support effective disease management across the region.
Prominent companies operating in the Global Osteoporosis Drugs Market include Amgen, Apotex, DAIICHI SANKYO COMPANY, Dr. Reddy's Laboratories, Eisai, Eli Lilly and Company, Merck & Co., Mylan, Novartis, Pfizer, Radius Health, Roche, Sanofi, Sun Pharmaceutical Industries, and Teva Pharmaceutical Industries. Companies competing in the Global Osteoporosis Drugs Market are strengthening their competitive position through a combination of product innovation, research investments, and strategic collaborations. Many pharmaceutical manufacturers are increasing funding for clinical research to develop next-generation therapies that improve treatment outcomes and support long-term bone health management. Organizations are also expanding their global distribution networks to increase product availability across emerging healthcare markets. Partnerships with healthcare providers and research institutions are helping companies accelerate drug development and improve patient access to therapies. Additionally, firms are focusing on digital health integration to support medication adherence and patient monitoring.
Table of Contents
Chapter 1 Research Methodology
- 1.1 Research approach
- 1.2 Quality commitments
- 1.2.1 GMI AI policy & data integrity commitment
- 1.2.1.1 Source consistency protocol
- 1.2.1 GMI AI policy & data integrity commitment
- 1.3 Research trail & confidence scoring
- 1.3.1 Research trail components
- 1.3.2 Scoring components
- 1.4 Data collection
- 1.4.1 Partial list of primary sources
- 1.5 Data mining sources
- 1.5.1 Paid sources
- 1.5.1.1 Sources, by region
- 1.5.1 Paid sources
- 1.6 Base estimates and calculations
- 1.6.1 Base year calculation for any one approach
- 1.7 Forecast model
- 1.7.1 Quantified market impact analysis
- 1.7.1.1 Mathematical impact of growth parameters on forecast
- 1.7.1 Quantified market impact analysis
- 1.8 Research transparency addendum
- 1.8.1 Source attribution framework
- 1.8.2 Quality assurance metrics
- 1.8.3 Our commitment to trust
Chapter 2 Executive Summary
- 2.1 Industry 3600 synopsis
- 2.2 Key market trends
- 2.2.1 Regional trends
- 2.2.2 Type trends
- 2.2.3 Drug class trends
- 2.2.4 Route of administration trends
- 2.2.5 Distribution channel trends
- 2.3 CXO perspectives: Strategic imperatives
Chapter 3 Industry Insights
- 3.1 Industry ecosystem analysis
- 3.2 Industry impact forces
- 3.2.1 Growth drivers
- 3.2.1.1 Increasing prevalence of osteoporosis
- 3.2.1.2 Technological advancements in drug development
- 3.2.1.3 Rising incidence of fractures
- 3.2.1.4 Growth in biologic and novel therapeutic adoption
- 3.2.2 Industry pitfalls and challenges
- 3.2.2.1 High cost of treatment
- 3.2.2.2 Side effects and safety concerns
- 3.2.3 Market opportunities
- 3.2.3.1 Development of next-generation anabolic agents
- 3.2.3.2 Biosimilar and biobetter entry
- 3.2.1 Growth drivers
- 3.3 Growth potential analysis
- 3.4 Regulatory landscape
- 3.4.1 North America
- 3.4.2 Europe
- 3.4.3 Asia Pacific
- 3.5 Technology landscape
- 3.5.1 Current technological trends
- 3.5.2 Emerging technologies
- 3.6 Reimbursement scenario
- 3.7 Future market trends
- 3.8 Pipeline analysis
- 3.9 Value chain analysis
- 3.10 Impact of AI and generative AI on the market
- 3.11 Porter's analysis
- 3.12 PESTEL analysis
- 3.13 Start-up scenarios
- 3.14 Gap analysis
Chapter 4 Competitive Landscape, 2025
- 4.1 Introduction
- 4.2 Company matrix analysis
- 4.3 Company market share analysis
- 4.3.1 Global
- 4.3.2 North America
- 4.3.3 Europe
- 4.3.4 Asia Pacific
- 4.4 Competitive positioning matrix
- 4.5 Competitive analysis of major market players
- 4.6 Key developments
- 4.6.1 Mergers & acquisitions
- 4.6.2 Partnerships & collaborations
- 4.6.3 New product launches
- 4.6.4 Expansion plans
Chapter 5 Market Estimates and Forecast, By Type, 2022 - 2035 ($ Mn)
- 5.1 Key trends
- 5.2 Primary osteoporosis
- 5.2.1 Postmenopausal osteoporosis
- 5.2.2 Senile osteoporosis
- 5.2.3 Idiopathic osteoporosis
- 5.3 Secondary osteoporosis
Chapter 6 Market Estimates and Forecast, By Drug Class, 2022 - 2035 ($ Mn)
- 6.1 Key trends
- 6.2 Bisphosphonates
- 6.3 RANK ligand inhibitors
- 6.4 Parathyroid hormone analogs
- 6.5 Hormone replacement therapy (HRT)
- 6.6 Selective estrogen receptor modulators (SERMs)
- 6.7 Other drug classes
Chapter 7 Market Estimates and Forecast, By Route of Administration, 2022 - 2035 ($ Mn)
- 7.1 Key trends
- 7.2 Oral
- 7.3 Injectable
- 7.4 Other route of administrations
Chapter 8 Market Estimates and Forecast, By Distribution Channel, 2022 - 2035 ($ Mn)
- 8.1 Key trends
- 8.2 Brick and mortar
- 8.3 E-commerce
Chapter 9 Market Estimates and Forecast, By Region, 2022 - 2035 ($ Mn)
- 9.1 Key trends
- 9.2 North America
- 9.2.1 U.S.
- 9.2.2 Canada
- 9.3 Europe
- 9.3.1 Germany
- 9.3.2 UK
- 9.3.3 France
- 9.3.4 Spain
- 9.3.5 Italy
- 9.3.6 Netherlands
- 9.4 Asia Pacific
- 9.4.1 China
- 9.4.2 Japan
- 9.4.3 India
- 9.4.4 Australia
- 9.4.5 South Korea
- 9.5 Latin America
- 9.5.1 Brazil
- 9.5.2 Mexico
- 9.5.3 Argentina
- 9.6 Middle East and Africa
- 9.6.1 South Africa
- 9.6.2 Saudi Arabia
- 9.6.3 UAE
Chapter 10 Company Profiles
- 10.1 Amgen
- 10.2 Apotex
- 10.3 DAIICHI SANKYO COMPANY
- 10.4 Dr. Reddy’s Laboratories
- 10.5 Eisai
- 10.6 Eli Lilly and Company
- 10.7 Merck & Co.
- 10.8 Mylan
- 10.9 Novartis
- 10.10 Pfizer
- 10.11 Radius Health
- 10.12 Roche
- 10.13 Sanofi
- 10.14 Sun Pharmaceutical Industries
- 10.15 Teva Pharmaceutical Industries
 骨質疏鬆症治療和骨折癒合市場-全球產業規模、佔有率、趨勢、機會和預測:按藥物類型、給藥途徑、分銷管道、地區和競爭格局分類,2021-2031年
 停經後骨質疏鬆症治療市場規模、佔有率和成長分析:按藥物類別、給藥途徑、分銷管道和地區分類-2026-2033年產業預測
 全球骨質疏鬆症治療市場規模、佔有率、趨勢和成長分析報告(2026-2034年)
 停經後骨質疏鬆症治療市場預測至2034年-全球按治療方法、給藥途徑、藥物輸送系統、病患細分、分銷管道和地區分類的分析
 抗骨質疏鬆和骨折癒合市場:依藥物類別、給藥途徑、分銷管道和地區分類。
 骨質疏鬆症治療市場報告:按產品類型、給藥途徑和地區分類(2026-2034 年)骨質疏鬆症藥物市場-全球產業規模、佔有率、趨勢、機會、預測:按給藥途徑、藥物類型、地區和競爭格局分類,2021-2031年
 骨質疏鬆症治療和骨折癒合市場:按治療方法、給藥途徑、骨折類型和最終用戶分類-2026年至2032年全球市場預測骨質疏鬆症治療市場:依藥物類型、給藥途徑、通路及地區分類停經後骨質疏鬆症市場:依藥物類別、給藥途徑、銷售管道及地區分類