


 |
市場調查報告書
商品編碼
1998758
2026 年至 2035 年飲料罐市場的商業機會、成長要素、產業趨勢分析與預測。Beverage Cans Market Opportunity, Growth Drivers, Industry Trend Analysis, and Forecast 2026 - 2035 |
||||||
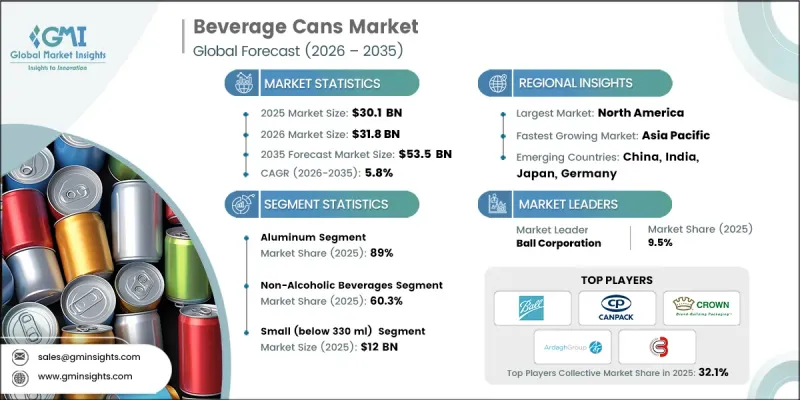
預計到 2025 年,全球飲料罐市場價值將達到 301 億美元,並預計以 5.8% 的複合年成長率成長,到 2035 年達到 535 億美元。
全球對便利單份飲料的需求不斷成長,以及能量飲料和機能飲料的快速發展,共同推動了這個市場擴張。飲料製造商加大永續性力度,以及監管機構推行可回收包裝,進一步促進了市場成長。此外,高階包裝的差異化、新興市場產能的擴張,以及多個飲料類別從寶特瓶轉向鋁罐,也是推動市場成長的重要因素。同時,輕量化設計的創新、回收基礎設施的完善以及家庭消費趨勢的興起,也促進了環保包裝解決方案的普及,使飲料公司能夠在最佳化供應鏈的同時,提供環保的包裝選擇。
| 市場範圍 | |
|---|---|
| 開始年份 | 2025 |
| 預測期 | 2026-2035 |
| 上市時的市場規模 | 301億美元 |
| 預測金額 | 535億美元 |
| 複合年成長率 | 5.8% |
碳酸飲料、啤酒和機能飲料中鋁罐飲料消費量的成長是市場成長的主要驅動力。對高速罐裝生產線的投資、能量飲料和即飲酒精飲料產品線的拓展以及輕量化罐體生產技術的改進,都在推動市場滲透。鋁罐憑藉其可回收性、輕盈性和有效的阻光阻氧性能而佔據市場主導地位,這些特性延長了產品的保存期限,並符合循環經濟的原則。
到2025年,鋁製包裝將佔據89%的市場。其廣泛應用得益於其卓越的可回收性、與碳酸飲料和機能飲料的兼容性以及降低運輸成本的輕質特性。鋁的特性使其能夠在保證產品品質的同時實現高品質的印刷和標籤,這進一步增強了其吸引力。全球高回收率和對永續包裝的持續監管支持,也促成了鋁製包裝在全球飲料製造領域的統治地位。
預計到2025年,小罐裝(330毫升以下)市場規模將達120億美元。消費者對單份裝和定量包裝飲料的偏好日益成長,推動了小罐裝飲料市場的發展。這種規格的飲料適用於能量飲料、機能飲料和高階碳酸飲料,目標客戶是注重便利性和經常購買的消費者。小罐裝飲料便於在都市區進行多包裝銷售,也便於在自動販賣機上銷售,並能促進衝動消費。製造商透過確保零售店、便利商店和娛樂場所等管道的廣泛分銷,以及在主要市場提供穩定的產品供應,來保持其競爭力。
預計到2025年,北美飲料罐市佔率將達到36%。這一成長得益於健全的永續性法規、完善的回收體係以及寶特瓶向鋁罐的轉變。美國多個州和加拿大多個省份實施的押金返還計劃正在加強鋁的回收和閉合迴路供應鏈。主要企業正在擴大產能,並投資先進的輕量化罐體製造技術,以滿足碳酸飲料、能量飲料和即飲酒精飲料日益成長的需求。罐體製造技術的進步和永續實踐的結合,確保了該地區在全球飲料包裝市場中保持主導地位。
目錄
第1章:調查方法和範圍
第2章執行摘要
第3章業界考察
- 生態系分析
- 供應商情況
- 利潤率
- 成本結構
- 每個階段增加的價值
- 影響價值鏈的因素
- 中斷
- 影響產業的因素
- 促進因素
- 全球飲料業鋁消費量增加
- 精釀啤酒和即飲雞尾酒的優質化
- 高可回收性支援強制採用循環包裝。
- 品牌從PET材質過渡到可無限循環利用的罐裝材質
- 能量飲料和機能飲料的擴張
- 產業潛在風險與挑戰
- 鋁捲價格波動給利潤率帶來了壓力。
- 旺季需求期間產能受限
- 市場機遇
- 苗條而精緻的成長可以塑造
- 瓶裝水領域的普及率不斷提高
- 促進因素
- 成長潛力分析
- 監理情勢
- 波特五力分析
- PESTEL 分析
- 科技與創新趨勢
- 當前技術趨勢
- 新興技術
- 價格趨勢
- 按地區
- 依產品
- 定價策略
- 新興經營模式
- 合規要求
- 專利和智慧財產權分析
第4章 競爭情勢
- 介紹
- 企業市佔率分析
- 按地區
- 市場集中度分析
- 主要企業的競爭標竿分析
- 財務績效比較
- 銷售量
- 利潤率
- 研究與發展(R&D)
- 產品系列比較
- 產品線寬度
- 科技
- 創新
- 區域擴張比較
- 全球擴張分析
- 服務網路覆蓋
- 按地區分類的市場滲透率
- 競爭定位矩陣
- 領導者
- 挑戰者
- 追蹤者
- 小眾玩家
- 戰略展望矩陣
- 財務績效比較
- 主要進展
- 併購
- 夥伴關係與合作
- 技術進步
- 業務拓展與投資策略
- 數位轉型計劃
- 新興/Start-Ups競爭對手的發展趨勢
第5章 市場估計與預測:依材料分類,2022-2035年
- 鋁
- 鋼
第6章 市場估算與預測:依產品類型分類,2022-2035年
- 1 件裝
- 兩件套罐
- 三件組罐
第7章 市場估計與預測:依產能分類,2022-2035年
- 小容量(小於330毫升)
- 中等容量(330毫升至500毫升)
- 大容量(超過500毫升)
第8章 市場估計與預測:依應用領域分類,2022-2035年
- 酒精飲料
- 不含酒精的飲料
- 碳酸飲料
- 果菜汁
- 其他
第9章 市場估計與預測:依地區分類,2022-2035年
- 北美洲
- 美國
- 加拿大
- 歐洲
- 德國
- 英國
- 法國
- 西班牙
- 義大利
- 荷蘭
- 亞太地區
- 中國
- 印度
- 日本
- 澳洲
- 韓國
- 拉丁美洲
- 巴西
- 墨西哥
- 阿根廷
- 中東和非洲
- 南非
- 沙烏地阿拉伯
- 阿拉伯聯合大公國
第10章:公司簡介
- 主要企業
- Ball Corporation
- Crown Holdings
- Ardagh Group
- Novelis
- Canpack
- 按地區分類的主要企業
- 北美洲
- G3 Enterprises, Inc.
- GZI Industries
- Envases Group
- 亞太地區
- Ceylon Beverage Can
- Showa Aluminum-Can Co., Ltd.
- Toyo Seikan
- Thai Beverage Can
- Orora Packaging
- Tata Steel
- Visy
- 歐洲
- Baixicans
- Speira GmbH
- Scan Holdings
- Nampak
- 北美洲
The Global Beverage Cans Market was valued at USD 30.1 billion in 2025 and is estimated to grow at a CAGR of 5.8% to reach USD 53.5 billion by 2035.
The market's expansion is fueled by rising global demand for convenient, single-serve beverages and the rapid growth of energy drinks and functional beverages. Increasing sustainability commitments by beverage manufacturers, along with regulatory initiatives promoting recyclable packaging, are further supporting the market. Premium packaging differentiation, expanding production capacity in emerging economies, and the shift from plastic bottles to aluminum cans in several beverage segments are also driving growth. Additionally, innovations in lightweight design, enhanced recycling infrastructure, and at-home consumption trends have strengthened adoption, allowing beverage companies to optimize supply chains while maintaining environmentally responsible packaging solutions.
| Market Scope | |
|---|---|
| Start Year | 2025 |
| Forecast Year | 2026-2035 |
| Start Value | $30.1 Billion |
| Forecast Value | $53.5 Billion |
| CAGR | 5.8% |
Rising aluminum beverage consumption across carbonated drinks, beer, and functional beverages is a key driver of market growth. Investments in high-speed canning lines, expansion of energy drink and ready-to-drink alcoholic beverage product lines, and improvements in lightweight can production have bolstered penetration. Aluminum cans dominate the market due to their recyclability, light weight, and ability to create effective barriers against light and oxygen, which extends product shelf life and aligns with circular economy principles.
The aluminum segment held 89% share in 2025. Its widespread adoption is driven by superior recyclability, compatibility with carbonated and functional beverages, and lightweight properties that reduce transportation costs. Aluminum's ability to maintain product integrity while supporting premium printing and labeling further enhances its appeal. High global recycling rates and ongoing regulatory support for sustainable packaging help maintain aluminum's dominance in beverage manufacturing worldwide.
The small-size cans segment (below 330 ml) reached USD 12 billion in 2025. The growing preference for single-serve and portion-controlled beverages has fueled demand for compact cans. These sizes cater to energy drinks, functional beverages, and premium carbonated drinks, targeting convenience-oriented consumers and frequent purchase occasions. Compact cans support multipack sales, vending machine compatibility, and impulse buying in urban environments. Manufacturers maintain competitive positioning by ensuring wide distribution through retail, convenience, and entertainment channels, ensuring consistent product availability across key markets.
North America Beverage Cans Market accounted for 36% share in 2025. Growth in this region is supported by strong sustainability regulations, established recycling frameworks, and the substitution of plastic bottles with aluminum cans. Deposit return schemes in multiple U.S. states and Canadian provinces strengthen aluminum recycling and closed-loop supply chains. Leading players are investing in capacity expansion and advanced lightweight canning technologies to meet increasing demand from carbonated beverages, energy drinks, and ready-to-drink alcoholic products. Technological advancements in can production, combined with sustainable practices, help the region maintain its leadership in global beverage packaging.
Key players operating in the Global Beverage Cans Market include Ball Corporation, Crown Holdings, Ardagh Group, Canpack, Showa Aluminum-Can Co., Ltd., Novelis, G3 Enterprises, Inc., Ceylon Beverage Can, Tata Steel, Visy, Baixicans, Envases Group, Scan Holdings, Toyo Seikan, GZI Industries, Orora Packaging, Speira GmbH, and Thai Beverage Can. Companies in the Global Beverage Cans Market are leveraging multiple strategies to strengthen their market position and growth. Investments in research and development focus on lightweight and eco-friendly aluminum designs to enhance recyclability while reducing carbon footprints. Expansion of production facilities and high-speed canning lines in emerging markets ensures capacity meets growing demand. Firms are collaborating with beverage manufacturers to offer customized, branded, and limited-edition cans that differentiate products on the shelf. Sustainability initiatives, such as closed-loop recycling partnerships and the adoption of low-carbon production practices, reinforce compliance with regulatory requirements.
Table of Contents
Chapter 1 Methodology and Scope
- 1.1 Market scope and definition
- 1.2 Research design
- 1.2.1 Research approach
- 1.2.2 Data collection methods
- 1.3 Data mining sources
- 1.3.1 Global
- 1.3.2 Regional/Country
- 1.4 Base estimates and calculations
- 1.4.1 Base year calculation
- 1.4.2 Key trends for market estimation
- 1.5 Primary research and validation
- 1.5.1 Primary sources
- 1.6 Forecast model
- 1.7 Research assumptions and limitations
Chapter 2 Executive Summary
- 2.1 Industry 360° synopsis, 2022 - 2035
- 2.2 Key market trends
- 2.2.1 Material trends
- 2.2.2 Product type trends
- 2.2.3 Capacity trends
- 2.2.4 Application trends
- 2.2.5 Regional trends
- 2.3 TAM Analysis, 2026-2035
- 2.4 CXO perspectives: Strategic imperatives
Chapter 3 Industry Insights
- 3.1 Industry ecosystem analysis
- 3.1.1 Supplier Landscape
- 3.1.2 Profit Margin
- 3.1.3 Cost structure
- 3.1.4 Value addition at each stage
- 3.1.5 Factor affecting the value chain
- 3.1.6 Disruptions
- 3.2 Industry impact forces
- 3.2.1 Growth drivers
- 3.2.1.1 Rising global aluminum beverage consumption volumes
- 3.2.1.2 Premiumization of craft beer and RTD cocktails
- 3.2.1.3 High recyclability supporting circular packaging mandates
- 3.2.1.4 Brand shift from PET to infinitely recyclable cans
- 3.2.1.5 Expansion of energy drink and functional beverages
- 3.2.2 Industry pitfalls and challenges
- 3.2.2.1 Volatile aluminum coil pricing pressures margins
- 3.2.2.2 Capacity constraints during peak seasonal demand
- 3.2.3 Market opportunities
- 3.2.3.1 Growth in slim and sleek can formats
- 3.2.3.2 Increasing adoption in bottled water segment
- 3.2.1 Growth drivers
- 3.3 Growth potential analysis
- 3.4 Regulatory landscape
- 3.4.1 North America
- 3.4.2 Europe
- 3.4.3 Asia Pacific
- 3.4.4 Latin America
- 3.4.5 Middle East & Africa
- 3.5 Porter's analysis
- 3.6 PESTEL analysis
- 3.7 Technology and Innovation landscape
- 3.7.1 Current technological trends
- 3.7.2 Emerging technologies
- 3.8 Price trends
- 3.8.1 By region
- 3.8.2 By product
- 3.9 Pricing Strategies
- 3.10 Emerging Business Models
- 3.11 Compliance Requirements
- 3.12 Patent and IP analysis
Chapter 4 Competitive Landscape, 2025
- 4.1 Introduction
- 4.2 Company market share analysis
- 4.2.1 By region
- 4.2.1.1 North America
- 4.2.1.2 Europe
- 4.2.1.3 Asia Pacific
- 4.2.1.4 Latin America
- 4.2.1.5 Middle East & Africa
- 4.2.2 Market concentration analysis
- 4.2.1 By region
- 4.3 Competitive benchmarking of key players
- 4.3.1 Financial performance comparison
- 4.3.1.1 Revenue
- 4.3.1.2 Profit margin
- 4.3.1.3 R&D
- 4.3.2 Product portfolio comparison
- 4.3.2.1 Product range breadth
- 4.3.2.2 Technology
- 4.3.2.3 Innovation
- 4.3.3 Geographic presence comparison
- 4.3.3.1 Global footprint analysis
- 4.3.3.2 Service network coverage
- 4.3.3.3 Market penetration by region
- 4.3.4 Competitive positioning matrix
- 4.3.4.1 Leaders
- 4.3.4.2 Challengers
- 4.3.4.3 Followers
- 4.3.4.4 Niche players
- 4.3.5 Strategic outlook matrix
- 4.3.1 Financial performance comparison
- 4.4 Key developments
- 4.4.1 Mergers and acquisitions
- 4.4.2 Partnerships and collaborations
- 4.4.3 Technological advancements
- 4.4.4 Expansion and investment strategies
- 4.4.5 Digital transformation initiatives
- 4.5 Emerging/ startup competitors landscape
Chapter 5 Market Estimates and Forecast, By Material, 2022 - 2035 (USD Million)
- 5.1 Key trends
- 5.2 Aluminum
- 5.3 Steel
Chapter 6 Market Estimates and Forecast, By Product Type, 2022 - 2035 (USD Million)
- 6.1 Key trends
- 6.2 1-piece cans
- 6.3 2-piece cans
- 6.4 3-piece cans
Chapter 7 Market Estimates and Forecast, By Capacity, 2022 - 2035 (USD Million)
- 7.1 Key trends
- 7.2 Small (below 330 ml)
- 7.3 Medium (330 ml - 500 ml)
- 7.4 Large (above 500 ml)
Chapter 8 Market Estimates and Forecast, By Application, 2022 - 2035 (USD Million)
- 8.1 Key trends
- 8.2 Alcoholic beverages
- 8.3 Non-alcoholic beverages
- 8.3.1 Carbonated soft drinks
- 8.3.2 Fruit & vegetable juices
- 8.3.3 Others
Chapter 9 Market Estimates and Forecast, By Region, 2022 - 2035 (USD Million)
- 9.1 Key trends
- 9.2 North America
- 9.2.1 U.S.
- 9.2.2 Canada
- 9.3 Europe
- 9.3.1 Germany
- 9.3.2 UK
- 9.3.3 France
- 9.3.4 Spain
- 9.3.5 Italy
- 9.3.6 Netherlands
- 9.4 Asia Pacific
- 9.4.1 China
- 9.4.2 India
- 9.4.3 Japan
- 9.4.4 Australia
- 9.4.5 South Korea
- 9.5 Latin America
- 9.5.1 Brazil
- 9.5.2 Mexico
- 9.5.3 Argentina
- 9.6 Middle East and Africa
- 9.6.1 South Africa
- 9.6.2 Saudi Arabia
- 9.6.3 UAE
Chapter 10 Company Profiles
- 10.1 Global Key Players
- 10.1.1 Ball Corporation
- 10.1.2 Crown Holdings
- 10.1.3 Ardagh Group
- 10.1.4 Novelis
- 10.1.5 Canpack
- 10.2 Regional key players
- 10.2.1 North America
- 10.2.1.1 G3 Enterprises, Inc.
- 10.2.1.2 GZI Industries
- 10.2.1.3 Envases Group
- 10.2.2 Asia Pacific
- 10.2.2.1 Ceylon Beverage Can
- 10.2.2.2 Showa Aluminum-Can Co., Ltd.
- 10.2.2.3 Toyo Seikan
- 10.2.2.4 Thai Beverage Can
- 10.2.2.5 Orora Packaging
- 10.2.2.6 Tata Steel
- 10.2.2.7 Visy
- 10.2.3 Europe
- 10.2.3.1 Baixicans
- 10.2.3.2 Speira GmbH
- 10.2.3.3 Scan Holdings
- 10.2.3.4 Nampak
- 10.2.1 North America
 飲料罐市場-2026-2032年全球市場預測
 2026-2030年全球飲料罐市場
 飲料罐包裝市場預測至2034年-按材料類型、結構、罐體形狀、容量、飲料類型、最終用戶和地區分類的全球分析
 2026年全球鋁瓶市場報告
 全球飲料罐市場:市場規模、佔有率和趨勢分析(按材料、應用和地區分類),細分市場預測(2026-2033 年)
 鋁瓶市場規模、佔有率、成長及全球產業分析:按類型、應用和區域分類,預測2026-2034年全球飲料罐市場規模、佔有率、趨勢和成長分析報告(2026-2034)2026年全球飲料罐市場報告
 飲料罐市場規模、佔有率和成長分析(按材料、應用和地區分類)-2026-2033年產業預測
 全球飲料罐市場